ORIGINAL ARTICLE
Effect of plasma NO
x
values on cardiac function in obese
hypertensive and normotensive pediatric patients
Meltem Akcaboy1&Serdar Kula2&Tayfun Göktas3&Bijen Nazlıel4
&
Semiha Terlemez2&Nurullah Celik5&Bülent Celik6&Necla Buyan1
Received: 19 April 2015 / Revised: 9 August 2015 / Accepted: 8 September 2015 / Published online: 19 October 2015 # IPNA 2015
Abstract
Background Hypertension (HT) is a major comorbidity of obesity that is associated with an increased risk of cardiovas-cular disease and higher mortality. The aim of our study was to evaluate cardiac function in obese hypertensive (OHT) and obese normotensive (ONT) pediatric patients and determine the effects of plasma nitric oxide (NOx) values on cardiac
function, while demonstrating the role of plasma NOxin HT
in obese pediatric patients.
Methods The study population consisted of 62 patients (27 boys, 35 girls), aged 13–18 years and 21 age-matched healthy controls. All subjects enrolled in the study underwent echo-cardiography (Echo) evaluation and ambulatory blood pres-sure monitoring for HT. Plasma NOxand biochemical values
were studied in both patient groups separately.
Results Plasma NOx levels were found to be lower in the
OHT group than in the ONT and control groups (p<0.001) and to be negatively correlated with left ventricular mass
index values (p<0.05). Both the OHT and ONT groups had concentric hypertrophy of the heart.
Conclusions Plasma NOxplays an essential role in
obesity-induced HT. Concentric hypertrophy of the left ventricle was found in both the OHT and ONT groups, indicating structural deformation of the heart.
Keywords Plasma NOx. Hypertension . Obese . Children .
Echocardiography
Introduction
The prevalence of obesity is increasing significantly in pedi-atric age groups worldwide and is a public health problem of epidemic proportions in many countries [1].
Hypertension (HT) is the most serious comorbidity of obesity and an important risk factor for cardiovascular disease [2]. Two separate studies on obesity-related hy-pertension and childhood obesity revealed that nearly one-third of the obese children and four-fifths of the obese adolescents were obese in adulthood [2, 3]. Although clinical complications of coronary heart dis-ease mostly occur in middle age or in later life, athero-sclerosis has its roots in childhood and progresses over decades [4]. Blood pressure (BP) level values are re-ported to be one of the most important measurable markers in obese children of potential cardiovascular risk factors later in life [5]. Echocardiography (Echo) is an important diagnostic technique to not only confirm HT but also to assess end-organ damage [6]. Recent studies have demonstrated that obese patients have a deformation in the geometric shape of their hearts even if they are not hypertensive or have left ventricle hyper-trophy (LVH) [7, 8].
* Meltem Akcaboy [email protected]
1
Department of Pediatric Nephrology, Gazi University School of Medicine, Konya yolu, 06500 Besevler, Ankara, Turkey
2
Department of Pediatric Cardiology, Gazi University School of Medicine, Ankara, Turkey
3 Department of Physiology, Gazi University School of Medicine,
Ankara, Turkey
4
Department of Neurology, Gazi University School of Medicine, Ankara, Turkey
5
Department of Pediatric Endocrinology, Gazi University School of Medicine, Ankara, Turkey
6 Faculty of Science, Department of Biostatistics, Gazi University,
The mechanism of HT in obesity seems to be multifactorial [9], with hyperinsulinemia, hyperleptinemia, renal structural deformation, inflammation, oxidative stress, activation of the central nervous system and endothelial dysfunction compris-ing major components of this mechanism [10,11]. Nitric ox-ide (NOx) is a potent regulator of vasomotor tone and an
important anti-atherogenic molecule. There is growing evi-dence that NOxis critically involved in obesity and its clinical
consequences, such as cardiovascular diseases, diabetes and HT [12]. Obesity-related oxidative stress reduces the bioavail-ability of NOx[13].
The aims of our study were to evaluate cardiac function in obese hypertensive (OHT) and obese normotensive (ONT) pediatric patients and to determine the effect(s) of plasma NOxvalues on cardiac function, as well as to demonstrate
the role of plasma NOxin HT in obese pediatric patients and
evaluate the role of inflammation.
Patients and methods
Patients
The study population consisted of 62 patients (27 boys, 35 girls), aged 13–18 years, who were followed-up for obesity for at least 2 years in the Department of Pediatric Endocrinology, Gazi University School of Medicine, Ankara, Turkey. Patients were divided into two groups based on ambulatory blood pressure monitoring (ABPM) measure-ments, with one group consisting of OHT children (16 boys, 19 girls) and the second group comprising ONT children (11 boys, 16 girls). The children in the study population did not have any acute or chronic kidney, cardiac or neurological dis-orders and were not taking any medication. The control group consisted of 21 healthy pubertal normotensive children (11 boys, 10 girls), aged 13–18 years, who were not obese, did not have any kidney, cardiac or neurological disorders and were not taking any medication. These healthy children were selected from children admitted to the Child and Adolescent Outpatient Clinic for follow-up and subsequently diagnosed as healthy. Glomerular filtration rate was estimated (eGFR) by the Schwartz Formula [14].
Anthropometric measurements
As part of routine clinical care, height was measured with a stadiometer and weight was measured on a calibrated scale with the child wearing light clothing. Body mass index (BMI) was calculated as weight in kilograms divided by height in meters squared (kg/m2). Obesity was defined, ac-cording to the BMI percentiles for the Turkish population based on gender and age, as being≥95th percentile [15]. Waist circumference (WC) of all patients was measured in
the standing position using a non-flexible tape, from the inter-section of the midaxillary line and iliac crests at the end of expiration, and was evaluated according to the Turkish population-based data based on age and gender [16]. The BMI z-score was calculated using Cole’s lambda-mu-sigma method [17].
Insulin resistance and metabolic syndrome
Insulin resistance (IR) was analyzed using the homeostasis model assessment of IR (HOMA-IR). HOMA-IR was calcu-lated by the following formula: [fasting glucose (mg/dL) × fasting insulin (U/L)]/405. IR was defined according to the HOMA-IR values for the population as the 95th percentile of the HOMA-IR values according to Tanner stage; the cut-off values for IR were determined to be 5.22 in boys and 3.82 in girls [18].
The International Diabetes Federation (IDF) consensus criteria were used to define whether patients had metabolic syndrome (MS) [19].
Office BP measurements
All patients and children in the control group were evaluated for hypertensive status. Office BP measurements were per-formed using an aneroid sphygmomanometer with the appro-priately sized cuff for the child’s upper arm. The sphygmo-manometer was calibrated before starting the study and once a month thereafter with a mercury sphygmomanom-eter. Systolic BP (SBP) was defined by the first Korotkoff sound (appearance of sounds), and diastolic BP (DBP) was identified by the fifth Korotkoff sound (disappearance of sounds). Measurements were performed while the children were sitting with their back supported and the cubital fossa supported at the heart level, after a rest of at least 5 min. The mean of three readings was recorded as the office BP. SBP and DBP percentiles were calculated according to the normograms recommended by the National High Blood Pressure in Children and Adolescents Institute [20]. HT was defined in a child or adolescent if the mean SBP or DBP was above the 95th percentile for gender, age and height on three or more occasions. A child was diagnosed as normotensive if both or either of the SBP and DBP percentiles were <90th percentile, and prehypertension was diagnosed if both or either of the SBP and DBP per-centiles were≥90th percentile but both were<95th. For the classification of HT, each patient was evaluated by ABPM. The BP index was the ratio of the BP and corresponding 95th BP percentile from the Fourth Report [20]. Office BP z-score was calculated based on the 95th percentile for age, sex and height from the Fourth Report [20].
Ambulatory blood pressure monitoring
Ambulatory blood pressure monitoring measurements were obtained for all patients in the study and the subjects in the control group using a Spacelabs monitor (model no: 90207; SpaceLabs Medical, Redmond, WA). Cuff size was deter-mined by measuring the circumference of the mid-arm. The device was set to take measurements every 30 min during the day (08:00 to 23:00 hours) and every 60 min during sleep (23:00 to 08:00 hours). The patients were instructed to avoid heavy physical exercise but to continue their normal daily activities. The patient or their parents were asked to keep a diary to record events on a 24-h basis, including the awake and asleep times; daytime and nighttime periods were determined according to the times recorded in these diaries. At least 40 readings were considered satisfactory for analysis. ABPM da-ta (24-h mean SBP and DBP, daytime SBP and DBP, nighttime SBP and DBP) were registered. Elevated BP load was defined as more than 25 % of recordings of SBP or DBP measurements being≥95th percentile for gender and height, respectively [6,21]. Office BP percentiles, 24-h mean SBP and 24-h mean DBP percentiles and SBP and DBP load were used to classify HT in patients [22]. Patients were grouped as having white-coat HT, masked HT, ambulatory HT and severe ambulatory HT, respectively, according to the data [22]. White-coat HT was defined as office BP percentiles of>95th percentile, 24-h mean SBP of<95th percentile and SBP load of <25 %; masked HT was defined as office BP of<95th percentile, 24-h mean SBP of>95th percentile and SBP load of>25 %; ambulatory HT was defined as office BP of>95th percentile, 24-h mean SBP of>95th percentile and SBP load of 25–50 %; severe ambulatory HT was defined as office BP of>95th percentile, and 24-h mean SBP of>95th percentile and SBP load of >50 % [22]. Our study did not include prehypertensive patients. The patients were classified as dip-pers if the mean SBP and/or DBP decreased by≥10 % during the sleep period, and this was calculated as follows: (mean daytime− mean nighttime/mean daytime) × 100. Subjects with a nighttime drop of SBP or DBP of <10 % of daytime values were considered to be non-dippers.
The OHT group consisted of masked, ambulatory, severe ambulatory hypertensive and obese patients. The ONT group consisted of obese and normotensive or white-coat hyperten-sive patients. The control group consisted healthy children matched for age and gender who were neither obese nor hypertensive.
All of the patients and control subjects underwent the Echo evaluation.
Serum blood sample measurements
Blood samples were obtained from all study subjects after a 12-h fasting period. Blood glucose, lipids and routine
laboratory parameters were measured using enzymatic spec-trophotometric methods on an automated clinical chemistry analyzer (Olympus AU2700 plus analyzer; Beckman Coulter Inc., Pasadena, CA). Low-density lipoprotein was calculated using the Friedewald formula. Insulin levels were measured using an electrochemiluminescence immunoassay method (Architect i2000 Analyzer; Abbott Laboratories, Chicago, IL). Lipoprotein A, high-sensitivity C-reactive pro-tein (hsCRP) and urine albumin levels were measured by a nephelometric method using automated equipment (BN ProSpec; Siemens Healthcare GmbH, Erlangen, Germany). Fibrinogen was measured by the coagulometric method (ACL TOP700; Beckman Coulter).
Plasma NOxmeasurements
The NOxlevel in whole blood was determined by measuring
nitrite and nitrate production using the classical colorimetric reaction. Plasma samples for the determination of NOx
con-centration were diluted 1:1 (v/v) with 0.3 M NaOH and incu-bated for 5 min and then protein-precipitated using 10 % ZnSO4. The mixture was then centrifuged for 10 min at 14,
000 rpm. The supernatants were collected and plated briefly, and then equal volumes of sample and Griess reagent (sulfa-nilamide and naphthalene–ethylene diaminedihydrochloride) were mixed at room temperature. After 5 min, absorbance was measured at 540 nm using a spectrophotometer. The concen-tration of nitrite was determined by comparison with a stan-dard curve prepared with sodium nitrite [23].
Echocardiographic evaluation
Echocardiography was performed on the same day as the col-lection of blood samples by the same pediatric cardiologist who was blinded to the groups. All Echo examinations were performed using a Vivid 7 ultrasound system (GE Vingmed Ultrasound AS, Horten Norway). Left ventricular (LV) func-tions were evaluated according to the American Society of Echocardiography Pediatric Guidelines [24]. LV mass (LVM) was calculated according to the formula of Devereux et al. [25]. The LVM index (LVMI) was obtained by dividing LVM by height to the power of 2.7. The use of height2.7as a denominator to calculate the LVMI minimizes the effect of age, gender, obesity and race [26]. Three different models were used to determine (LVH, as described by Khoury et al. [27]: LVMI>38.6 g/m2.7, LVMI>51 g/m2.7and LVMI>95th percentile for age and gender in normal children and adolescents.
LV diastolic function was evaluated by determining the maximal mitral early (E) and late (A) diastolic flow velocity ratio (E/A) and mitral annular velocity by tissue Doppler ex-amination. To evaluate late diastole, the mitral early inflow wave (E) to lateral mitral annulus Doppler wave (E’) velocity
ratio was calculated (E/E’). An E/E’ ratio of >10 represents abnormal LV diastolic functions, while an E/A ratio of<1 or>3 is considered normal [28].
Relative wall thickness (RWT) was calculated to assess the LV geometric pattern using the following formula: interven-tricular septum+LV posterior wall/LV end diastolic diameter. Patients with a LVMI of>95 % and RWT of>0.42 were con-sidered to have concentric LVH, while those with a LVMI of>95 % and RWT of<0.42 were considered to have eccentric LVH. Concentric remodeling was defined as normal LVMI and a RWT of >0.42 [29].
Statistical analysis
Data analysis was performed using SPSS ver. 15.0 (IBM Corp., Armonk, NY). Categorical variables were analyzed by the chi-square test and are presented as frequency and percentage. Each continuous independent and dependent var-iable was analyzed using the Kolmogorov–Smirnov or Shapiro-Wilk tests for normality of distribution. Normally dis-tributed data were presented as the mean and standard devia-tion. One-way analysis of variance with Scheffe post hoc test was used to compare differences between the three groups. Non-normally distributed data are presented as the median with interquartile range, and data on the three groups were compared using the Kruskal–Wallis H test and the Mann– Whitney U test with Bonferroni correction. Bivariate correla-tion coefficients (r) were calculated using the Pearson product moment or Spearman’s rank test, depending on whether or not the data were distributed normally. Multiple regression analy-ses were used to investigate the association between plasma NOxlevel and the measured laboratory parameters. All
statis-tical analyses were two-sided, and a P value<0.05 was con-sidered to be statistically significant.
Results
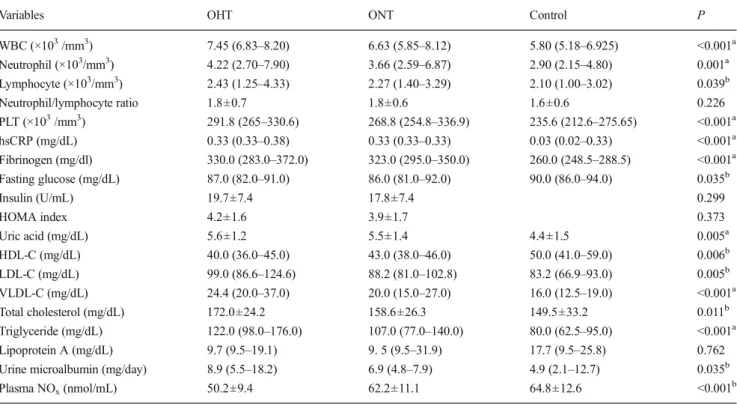
Demographic data and the physical characteristics, of the study and control groups are given in Table1. The OHT and ONT group had significantly higher white blood cell (WBC), neutrophil and platelet counts, and higher hsCRP, fibrinogen and uric acid levels than the control group. The results of selected laboratory tests are given in Table2.
Plasma NOxlevels were lower in the OHT group than in
the ONT and control groups (P<0.001) (Table3).
In the Echo evaluation, LVMI values were higher in the OHT and ONT groups than in the control group (P=0.001). LVH, defined as a LVMI (g/m2.7) of>95th percentile, and a LVMI (g/m2.7) of>38.6 were found at similar percentages in both the OHT and ONT groups. The E/A ratios were lower and the trend in the E/E′ ratios was highest in the OHT group, reflecting diastolic dysfunction, but neither parameter was
significantly different from that in the ONT and control groups, respectively (p>0.05). (Table3).
Twenty-three patients in the OHT group (88.5 %) and three patients in the ONT group (11.5 %) were assessed as having MS based on related criteria [19], and this differ-ence was significant (P < 0.001). Insulin levels in the OHT and ONT groups were 19.7 ± 7.4 and 17.8 ± 7.4 U/mL, re-spectively; this difference was not significant (P > 0.05). The mean values of the HOMA index did not differ be-tween the two patient groups (P > 0.05). Sixteen patients in the OHT group (45.7 %) and seven patients in the ONT group (25.9 %) were diagnosed as having IR; this differ-ence was not significant (P > 0.05).
The ABPM values of all ONT patients were higher than those of the control group, even if the former were not defined as hypertensive (P<0.001). The ONT patients also had higher BP loads than the control group (P< 0.001). Five patients (8.06 %) in the ONT group had white-coat HT according to the classification by Urbina et al. [21]. In the OHT group, 20 patients (57.1 %) had masked HT, ten patients (28.6 %) had ambulatory HT and five patients had severe ambulatory HT, according to the same classification [21]. A non-dipping pat-tern was found to be present in 60 % (n = 21 patients) of the children in the OHT group (60 %) and in 38.1 % of the chil-dren in the control group.
Plasma NOxlevels negatively correlated with office SBP
and DBP, daytime and nighttime mean SBP and DBP and daytime and nighttime SBP and DBP loads (P < 0.05) (Fig. 1). They did not differ between the dipping and non-dipping groups, nor between the different HT groups (p<0.05).
eGFR values were found to be higher in the OHT group than in the ONT and control groups, but the difference did not reach significance (P>0.05). A positive correlation was found only between BMI, BMI z-scores and eGFR (P<0.05).
There was a negative correlation between plasma NOx
levels and BMI, BMI z-scores, WBC, uric acid, very low-density lipoprotein-cholesterol (VLDL-C) and triglyceride values (P<0.05). Patients with IR and MS had lower plasma NOxlevels (P<0.05). Plasma NOxvalues were negatively
correlated with LVMI values (P<0.05) (Fig.2).
ABPM results are shown in Table4. BMI values and BMI z-scores positively correlated with office SBP and DBP values and with all ABPM parameters (P<0.05). A positive correla-tion was observed between WC and office DBP and SBP loads (P<0.05).
We found a positive correlation between ABPM values and hsCRP, fibrinogen, uric acid, VLDL-C and triglyceride values (P<0.05) and a negative correlation between ABPM values and high-density lipoprotein-cholesterol (HDL-C) values (P<0.05).
To identify independent risk factors for plasma NOx, we
NOxvalues in the univariate analyses into the logistic
regres-sion multivariate analysis. This latter analysis revealed that HDL-C values (β=0.332, P=0.005) and lipoprotein A (β= 0.184, P=0.020) levels were independent predictors of plasma NOxlevels in obese children (Table5).
Multivariate regression analysis also determined that 45 % of daytime and 46 % of variability in nighttime SBP loads, and 29 % of daytime and 35 % of variability in nighttime DBP loads, respectively, were explained by plasma NOxand
fibrin-ogen values.
Discussion
Hypertension is a well-known consequence of obesity in both adults and children, and among adolescents, obesity-related HT has become one of the commonest forms of HT [30]. Increased rates of death, premature heart failure, coronary ar-tery disease and vascular stiffness among individuals younger than 55 years of age have been associated with elevated BP levels during childhood and adolescence [31]. It has been proven that structural deformations in the vascular endotheli-um play a primary role in HT physiopathology, as well as in
systemic and vascular inflammation [10]. Endothelial dys-function is the first step in the development of atherosclerotic disease: it is present in the early course of all known cardio-vascular risk factors and is characterized by impaired bioavail-ability of NOx[32]. Potential mechanisms for the pathogenic
relationship between impaired NOxbioavailability and HT
include defects in theL-arginine/NO pathway, leading to de-creased NOxproduction. Genetic polymorphisms in
endothe-lial NO-synthase may cause reduced availability of cofactors essential for NOx formation. Another possible mechanism
could be high levels of NOxinhibitors and also the destruction
of NOxreactive oxygen species [32]. Obesity-related
oxida-tive stress reduces the bioavailability of NOx[13], which may
result in impaired endothelium-dependent vasodilatation and possibly promote atherosclerosis [33]. Gruber et al. [33] showed that the level of NOxwas decreased in obese juveniles
compared to normal weight juveniles and was also significant-ly negativesignificant-ly correlated with body weight. These findings provide additional support for low plasma NOxlevels in obese
individuals even when not HT, but the authors only took office BP measurements into account in their evaluation of HT, and ABPM data were not evaluated [33]. In a recent experimental study on male mice, strong evidence emerged which suggests
Table 1 Demographic variables of the study population and control group
Demographic variables OHT (n = 35) ONT (n = 27) Control (n= 21) P
Males (n = 38) 16 (42.2) 11 (28.9) 11 (28.9) 0.724 Females (n = 45) 19 (42.2) 16 (35.6) 10 (22.2) Age (year) 14.9±1.4 14.7±1.5 15.4±1.7 0.279 Weight (kg) 90.8±12.6 87.6±10.4 54.6±10.0 <0.001a Weight z-score 3.1±1.3 3.0±1.0 −0.5±0.7 <0.001a Height (cm) 166.1±7.8 164.0±7.3 163.0±10.0 0.351 Height z-score 0.4±1.1 0.2±1.4 −0.4±0.9 0.087 BMI (kg/m2) 33.1±4.7 32.6±3.3 20.5±2.6 <0.001a BMI z-score 2.8±1.0 2.7±0.4 −0.4±1.0 <0.001a Waist circumference (cm) 105.3±9.7 102.8±7.2 0.267 WC (cm), males 100.9±9.3 102.1±7.0 0.715 WC (cm), females 108.7±8.7 103.2±7.6 0.055 SBP (mmHg) 126.5±12.5 118.0±11.5 98.6±12.0 <0.001b SBP z-score 1.4±1.2 0.6±1.1 −1.3±1.1 <0.001b SBP index 0.98±0.10 0.93±0.09 0.77±0.09 <0.001b DBP (mmHg) 83.9±8.8 76.9±10.1 63.3±9.7 <0.001b DBP z-score 1.6±0.8 1.1±0.9 −0.2±1.1 <0.001a DBP index 1.01±0.11 0.93±0.12 0.77±0.12 <0.001a eGFR(mL/min/1.73 m2) 116.7±20.4 110.0±18.2 104.1±78.7 0.052 Birth weight (g) 3467.4±810.0 3441.5±509.9 2766.7±251.7 <0.001a
Data are presented as a number with the percentage in parenthesis, i.e. the frequency, or as mean ± standard deviation (SD); see sectionStatistical analysis
OHT, Obese hypertensive; ONT, obese normotensive; BMI, body mass index; SBP, Systolic blood pressure; DBP, diastolic blood pressure; WC, waist circumference; eGFR, estimated glomerular filtration rate
a
P < 0.05 for controls vs. OHT and ONT groups combined
a reduction in cellular transport ofL-arginine for NOx
biosyn-thesis, indicating that reduced bioavailability of NOxmay
contribute to the development of obesity-induced HT [34]. Our results confirm the clinical importance of plasma NOx
levels in obesity-induced HT. First, we found significantly lower values of plasma NOx only in the OHT group.
Second, plasma NOx levels were significantly negatively
correlated with BP levels and LVMI. Third, BMI, BMI z-scores, WBC levels, uric acid levels and lipid levels, such as VLDL and triglycerides, showed significant negative correla-tions with plasma NOxlevels. Finally, MS and IR levels also
demonstrated significant negative correlations with plasma NOxlevels. Taken together, our findings support the
hypoth-esis that plasma NOxis involved in HT in obese patients.
Obesity has other significant adverse cardiovascular impli-cations in addition to elevated BP, including inflammation and dyslipidemia [4]. Systemic inflammation has been accepted as a cardiovascular risk factor, and increased levels of inflammation-sensitive plasma proteins have been shown to be associated with an increased incidence of HT [4]. Meng et al. reported that in their longitudinal study of urban Han Chinese, higher total leukocyte levels were significantly relat-ed to MS in obesity [35]. Demir [36] studied the relationship between neutrophil lymphocyte ratio and non-dipper hyper-tension and reported that total leukocyte levels and monocyte levels were significantly related to non-dipping HT and that he
Table 2 Results from selected laboratory tests carried out on both patient groups and the control group
Variables OHT ONT Control P
WBC (×103/mm3) 7.45 (6.83–8.20) 6.63 (5.85–8.12) 5.80 (5.18–6.925) <0.001a Neutrophil (×103/mm3) 4.22 (2.70–7.90) 3.66 (2.59–6.87) 2.90 (2.15–4.80) 0.001a Lymphocyte (×103/mm3) 2.43 (1.25–4.33) 2.27 (1.40–3.29) 2.10 (1.00–3.02) 0.039b Neutrophil/lymphocyte ratio 1.8±0.7 1.8±0.6 1.6±0.6 0.226 PLT (×103/mm3) 291.8 (265–330.6) 268.8 (254.8–336.9) 235.6 (212.6–275.65) <0.001a hsCRP (mg/dL) 0.33 (0.33–0.38) 0.33 (0.33–0.33) 0.03 (0.02–0.33) <0.001a Fibrinogen (mg/dl) 330.0 (283.0–372.0) 323.0 (295.0–350.0) 260.0 (248.5–288.5) <0.001a Fasting glucose (mg/dL) 87.0 (82.0–91.0) 86.0 (81.0–92.0) 90.0 (86.0–94.0) 0.035b Insulin (U/mL) 19.7±7.4 17.8±7.4 0.299 HOMA index 4.2±1.6 3.9±1.7 0.373 Uric acid (mg/dL) 5.6±1.2 5.5±1.4 4.4±1.5 0.005a HDL-C (mg/dL) 40.0 (36.0–45.0) 43.0 (38.0–46.0) 50.0 (41.0–59.0) 0.006b LDL-C (mg/dL) 99.0 (86.6–124.6) 88.2 (81.0–102.8) 83.2 (66.9–93.0) 0.005b VLDL-C (mg/dL) 24.4 (20.0–37.0) 20.0 (15.0–27.0) 16.0 (12.5–19.0) <0.001a Total cholesterol (mg/dL) 172.0±24.2 158.6±26.3 149.5±33.2 0.011b Triglyceride (mg/dL) 122.0 (98.0–176.0) 107.0 (77.0–140.0) 80.0 (62.5–95.0) <0.001a Lipoprotein A (mg/dL) 9.7 (9.5–19.1) 9. 5 (9.5–31.9) 17.7 (9.5–25.8) 0.762
Urine microalbumin (mg/day) 8.9 (5.5–18.2) 6.9 (4.8–7.9) 4.9 (2.1–12.7) 0.035b
Plasma NOx(nmol/mL) 50.2±9.4 62.2±11.1 64.8±12.6 <0.001b
Data are presented as mean±SD or as the median with the interquartile range in parenthesis, as appropriate; see sectionStatistical analysis
WBC, White blood cell; PLT, platelet count; hsCRP, highly sensitive C-reactive protein; HDL-C, high-density lipoprotein cholesterol; LDL-C, low-density lipoprotein cholesterol; VLDL-C, very low-low-density lipoprotein cholesterol; HOMA (homeostasis model assessment) index = plasma insulin (U/mL) × plasma glucose (mg/dL)/405; OHT, obese hypertensive; ONT, obese normotensive; NOx, nitric oxide
a
P<0.05 for control vs. OHT and ONT combined
b
P<0.05 for control vs. OHT
Table 3 Selected echocardiographic parameters of both patient groups and the control group
Variables OHT ONT Control P
LVMI (g/m2.7) 43.60±11.68 43.68±14.52 32.28±6.83 0.001a
RWT (mm) 0.46±0.9 0.43±0.7 0.46±0.6 0.202
E/A ratio 1.47±0.17 1.51±0.2 1.74±0.3 0.296
E/E′ ratio 6.23±1.30 5.67±1.22 5.76±1.12 0.177
Data are presented as the mean±SD or as the median with the IQR in parenthesis, as appropriate; see sectionStatistical analysis
LVMI, left ventricle mass index; RWT, relative wall thickness; E, mitral diastolic flow velocity curve–E wave; E′, mean of the septum and lateral mitral annulus E′ wave; A, mitral diastolic flow velocity curve–A wave
a
p<0.05 for control vs. OHT and ONT combined
b
P<0.05 for control vs. OHT
Fig. 1 Correlations of plasma nitric oxide (NOx) levels and
blood pressure values. DBP Diastolic blood pressure, SBP systolic blood pressure
observed a significant positive correlation between higher levels of neutrophils and HT [36]. Uric acid is an important factor that causes endothelial dysfunction and supports in-flammation by causing an increase in renal renin levels and
a decrease in plasma NOxlevels, as well as by inhibiting NOx
synthesis [37,38]. In our study, the OHT and ONT groups had significantly higher WBC, neutrophil and platelet counts and higher hsCRP and fibrinogen levels than the control group, reflecting the systemic inflammation parameters in obese pa-tients. Lymphocyte count was only significantly higher in the OHT group compared to the control group, but the neutrophil/ lymphocyte ratio did not differ between the groups.
As lipid profiles were significantly higher in both the OHT and ONT groups in our study, we suggest that both hyperlip-idemia and inflammation should be monitored carefully in obese patients. We found a significant positive correlation between ABPM values and hsCRP, fibrinogen, uric acid, VLDL-C and triglyceride levels (P<0.05) and a significant negative correlation between ABPM values and HDL-C levels (P<0.05). The significant differences in inflammation and lipid parameters between the control group and both the ONT and OHT groups should indicate increased vascular risk factors in obese patients, even if they are not HT. In our study, the OHT and ONT groups had significantly higher levels of uric acid. Patients satisfying the criteria for MS had signifi-cantly higher uric acid levels, which showed a significant positive correlation with both the BP and ABPM parameters. These results emphasize the importance of uric acid in the presence of HT with obesity. Thus, obese patients should avoid overconsumption of soft drinks containing high levels of fructose. Uric acid level monitoring could be accepted as an important early biomarker reflecting the high potential risk of HT in obese patients.
Obesity is the major risk factor for HT, and it has been shown that mean BP values are significantly directly correlat-ed with BMI values [39]. Daytime and nighttime BP loads are significantly higher in obese patients than in normal weight individuals [40]. As the severity of the obesity increases, of-fice BP measurements increase significantly, and WC, which is an important marker of probable visceral fat accumulation, shows a positive correlation with DBP values [41]. Patients with non-dipper HT have a threefold higher risk for athero-sclerotic events than patients with dipper HT [42]. There is a strong correlation between a non-dipping pattern and LVMI, silent cerebrovascular events, microalbuminuria and also pro-gression in renal disease [43]. Civilibal et al. [44] studied a group of children with MS and found that higher nighttime
Fig. 2 Correlations of left ventricular mass index (LVMI) and plasma nitric oxide (NOx) values
Table 4 Ambulatory blood pressure monitoring values of both patient groups and the control group
Variables OHT ONT Control P
Mean 24-h ABPM
SBP (mmHg) 128.1±10.6 115.8±5.1 109.3±7.2 <0.001a
DBP (mmHg) 71.3±9.7 63.7±4.9 65.3±6.3 <0.001b
Mean daytime ABPM
SPB (mmHg) 132.3±10.8 118.0±6.8 112.3±7.0 <0.001b
DBP (mmHg) 75.7±8.9 66.3±5.9 67.5±4.6 <0.001b
Mean nighttime ABPM
SBP (mmHg) 118.8±9.8 111.2±5.3 99.9±5.9 <0.001a DBP (mmHg) 64.7±10.8 59.8±7.4 56.7±4.8 <0.001c SBP load (%) Daytime 51.8±18.6 11.6±6.5 4.6±5.6 <0.001a Nighttime 44.8±25.7 15.7±8.7 2.3±4.0 <0.001a DBP load (%) Daytime 32.0±19.1 9.9±9.8 3.6±3.7 <0.001a Nighttime 27.2±23.5 10.2±8.0 3.3±4.1 <0.001a Nocturnal BP Dipping (%) 40 18.5 38.1 0.009a Non-dipping (%) 60 81.5 61.9 0.009a
Data are presented as the mean± SD
ABPM, Ambulatory blood pressure monitoring; SBP, systolic blood pres-sure; DBP, diastolic blood prespres-sure; OHT, obese hypertensive; ONT, obese normotensive
a
All groups vs. each group
b
OHT vs. ONT and control combined
c
Control vs. OHT
Table 5 Multiple regression analyses for plasma nitric oxide values
Variables β 95 % Confidence interval P
Constant 68.282 44.587–91.977 <0.001
HDL-C 0.332 0.105–0.558 0.005
Lipoprotein A 0.184 0.030–0.338 0.020
Adjusted R2: 0.434
SBP was significantly related to early atherosclerosis and en-dothelial dysfunction. In our study, patients with a non-dipping pattern had significantly higher levels of fibrinogen (P<0.05), indicating the significant risk for inflammation in these pa-tients. Also in our study, the ABPM values of all ONT patients were significantly higher than those of the control group, even though according to our criteria the former were classified as normotensive. The ONT patients also had significantly higher BP loads than the control group. In the OHT group, 20 patients (57.1 %) were defined as masked HT, which is very high. BMI values and BMI z-scores significantly positively correlated with office SBP and DBP values, as well as with all ABPM parameters (P<0.05); there was a significant positive correla-tion between WC and office DBP and systolic BP loads (P<0.05). In our study population, office BP values and sys-tolic night loads were significantly higher in patients with IR (P<0.05). These results indicate that obese patients should routinely be evaluated by ABPM as well as by office BP mon-itoring where the incidence of masked HT is much higher than expected. In routine clinical follow-ups, changes in BMI, BMI z-scores and WC should be evaluated carefully in order to define HT risk in obese patients.
Data reported to date suggest that end-organ damage is present at the time of diagnosis in a substantial number of children with HT. Thompson et al. found that LVH was pres-ent in up to approximately 40 % of adolescpres-ents who had re-cently received a diagnosis of HT [45]. In children, LVMI is correlated directly and strongly with BMI and HT [46]. BMI is known as an independent predictor of LV diastolic dysfunc-tion [41]. Dhuper et al. reported that the LVMI, RWT and E/E′
ratio in the obese adolescents enrolled in their study were significantly higher than those of the controls, suggesting di-astolic dysfunction [8]. Obese and normotensive children show significantly higher E/A ratios than controls and also show diastolic dysfunction [47]. Obese and overweight chil-dren have lower E/A ratios, also reflecting diastolic dysfunc-tion [48]. We found that LVH defined by a LVMI (g/m2.7) of>95th percentile and by a LVMI (g/m2.7) of>38.6, respec-tively, was equally prevalent in both the OHT and ONT groups compared to the healthy control group. There was no significant difference in RWT, an indicator of remodeling, between the groups, resulting in all of the groups having con-centric hypertrophy. In our patients, the E/E′ ratio and E/A ratio were within normal ranges, but the OHT and ONT groups had lower E/A ratios and the OHT group had higher E/E′ ratios than the controls, reflecting impaired diastolic functions, but without statistical significance.
Overweight and obese children are reported to have de-creased renal function and to be at risk for developing chronic kidney disease [49]. However, hyperfiltration has also been reported to be associated with cardiometabolic risk factors [50]. Our OHT patients had increased eGFR compared to the other two groups, but the difference was not statistically
significant (P> 0.05), and the eGFR was significantly and positively correlated with the BMI and BMI z-scores. BP loads, the ratio of night non-dipping patients and IR and MS did not affect eGFR values. The patients having higher eGFR may be candidates for renal function deterioration with or without diabetes.
It was formerly believed that obese children did not devel-op cardiovascular problems until they reached adulthood. However, increasing evidence now indicates that obesity in children and adolescents is associated with short- and long-term cardiovascular risks that include both hemodynamic changes and structural and functional changes in the heart and blood vessels [51]. LVMI has been significantly associat-ed with MS, BMI, central obesity, fasting blood glucose, hyperinsulinemia, IR and arterial BP [26,51]. Our study con-firms that cardiac hypertrophy might be developed by both hemodynamic and non-hemodynamic factors, such as HT and BMI. In our study, BMI and BMI z-scores showed a significant positive correlation with LVMI. We also found a significant positive correlation between LVMI and both insu-lin levels and HOMA-IR values. Our patients in the OHT and ONT groups had significantly higher LVMI indexes than the control group subjects, even though the children in the ONT group were not hypertensive. As their RWT values did not differ significantly from each other, both ONT and OHT groups showed concentric hypertrophy of the left ventricle. It is known that in the absence of volume and pressure load, fat distribution may influence LV remodeling by adipose de-pots which may be visualized by cardiac magnetic resonance imaging [52].
In the multiple regression analyses, the parameters that sig-nificantly affected ABPM values were fibrinogen and plasma NOxlevels. Plasma NOxlevels were significantly lower in the
OHT group, thus supporting the role of NOx in
obesity-induced HT. In routine clinical practice, WBC, hsCRP and fibrinogen levels should be used to indicate the risk of obese children for HT. Plasma NOxlevels are significantly affected
by HDL-C and lipoprotein A, such that lipoprotein A should be used as a biomarker to follow-up obese children.
In conclusion, based on our results, we suggest that for the follow-up of obese patients, WC, fibrinogen levels, lipid pro-files and lipoprotein A levels are the most important biomarkers for the risk of HT and cardiovascular diseases. Concentric hy-pertrophy of the left ventricle was found in both of our obese patient groups, indicating structural deformation of the heart.
Compliance with ethical standards
Conflict of interest The authors declare that they have no conflict of interest.
Ethical statement The study adhered to the principles of the Declaration of Helsinki and was approved by the local Ethics Committee (Date: 27 April 2011; Protocol Number: 105). Written
informed consent was obtained from all patients enrolled in the study and also from all control subjects and their parents.
References
1. McCrindle BW (2010) Assesment and management of hyperten-sion in children and adolescents. Nat Rev Cardiol 7:155–163 2. Kotchen TA (2010) Obesity-related hypertension: epidemiology,
pathophysiology, and clinical management. Am J Hypertens 23: 1170–1178
3. Ludwig DS (2007) Childhood obesity—the shape of things to come. N Eng J Med 357:2325–2327
4. Flynn JT (2011) Ambulatory blood pressure monitoring in children: imperfect yet essential. Pediatr Nephrol 26:2089–2094
5. Lurbe E, Torro I, Aguilar F, Alvarez J, Alcon J, Pascual JM, Redon J (2008) Added impact of obesity and insulin resistance in nocturnal blood pressure elevation in children and adolescents. Hypertension 51:635–641
6. Flynn JT, Urbina EM (2012) Pediatric ambulatory blood pressure monitoring: indications and interpretations. J Clin Hypertens (Greenwich) 14:372–382
7. Sürücü H, Tatli E, Okudan S, Değirmenci A (2008) Evaluation of the effects of obesity on heart functions using standard echocardi-ography and pulsed wave tissue Doppler imaging. South Med J 101:152–157
8. Dhuper S, Abdullah RA, Weichbrod L, Mahdi E, Cohen HW (2011) Association of obesity and hypertension with left ventricular geometry and function in children and adolescents. Obesity (Silver Spring) 19:128–133
9. Bełtowski J (2006) Role of leptin in blood pressure regulation and arterial hypertension. J Hypertens 24:789–801
10. Kotsis V, Stabouli S, Papakatsika S, Rizos Z, Parati G (2010) Mechanisms of obesity-induced hypertension. Hypertens Res 33: 386–393
11. Hall JE, da Silva AA, do Carmo JM, Dubinion J, Hamza S, Munusamy S, Smith G, Stec DE (2010) Obesity-induced hyperten-sion: role of sympathetic nervous system, leptin, and melanocortins. J Biol Chem 285:17271–17276
12. Williams IL, Wheatcroft SB, Shah AM, Kearney MT (2002) Obesity, atherosclerosis and the vascular endothelium: mechanisms of reduced nitric oxide bioavailability in obese humans. Int J Obes Relat Metab Disord 26:754–764
13. Higashi Y, Sasaki S, Nakagawa K, Matsuura H, Chayama K, Oshima T (2001) Effect of obesity on endothelium-dependent, ni-tric oxide-mediated vasodilation innormotensive individuals and patients with essential hypertension. Am J Hypertens 14:1038– 1045
14. Schwartz GJ, Muñoz A, Schneider MF, Mak RH, Kaskel F, Warady BA, Furth SL (2009) New equations to estimate GFR in children with CKD. J Am Soc Nephrol 20:629–637
15. Bundak R, Furman A, Gunoz H, Darendeliler F, Bas F, Neyzi O (2006) Body mass index references for Turkish children. Acta Paediatr 95:194–198
16. Hatipoglu N, Ozturk A, Mazicioglu MM, Kurtoglu S, Seyhan S, Lokoglu F (2008) Waist circumference percentiles for 7- to 17-year-old Turkish children and adolescents. Eur J Pediatr 167:383–389 17. Cole TJ, Bellizzi MC, Flegal KM, Dietz WH (2000) Establishing a
standard definition for child overweight and obesity worldwide: international survey. BMJ 320:1240–1243
18. Kurtoğlu S, Hatipoğlu N, Mazıcıoğlu M, Kendirici M, Keskin M, Kondolot M (2010) Insulin resistance in obese children and
adolescents: HOMA-IR cut-off levels in the prepubertal and puber-tal periods. J Clin Res Pediatr Endocrinol 2:100–106
19. Zimmet P, Alberti KG, Kaufman F, Tajima N, Silink M, Arslanian S (2007) The metabolic syndrome in children and adolescents - an IDF consensus report. Pediatr Diabetes 8:299–306
20. National High Blood Pressure Education Program Working Group on High Blood Pressure in Children and Adolescents (2004) The fourth report on the diagnosis, evaluation, and treatment of high blood pressure in children and adolescents. Pediatrics 114:555–576 21. Urbina E, Alpert B, Flynn J, Hayman L, Harshfield GA, Jacobson M, Mahoney L, McCrindle B, Mietus-Snyder M, Steinberger J, Daniels S, American Heart Association Atherosclerosis, Hypertension, and Obesity in Youth Committee (2008) Ambulatory blood pressure monitoring in children and adolescents: recommendations for standard assessment: a scientific statement from the American Heart Association Atherosclerosis, Hypertension, and Obesity in Youth Committee of the council on cardiovascular disease in the young and the council for high blood pressure research. Hypertension 52:433–451
22. Soergel M, Kirschstein M, Busch C, Danne T, Gellermann J, Holl R, Krull F, Reichert H, Reusz GS, Rascher W (1997) Oscillometric twenty-four-hour ambulatory blood pressure values in healthy chil-dren and adolescents: a multicenter trial including 1141 subjects. J Pediatr 130:178–184
23. Miranda KM, Espey MG, Wink DA (2001) A rapid, simple spec-trophotometric method for simultaneous detection of nitrate and nitrite. Nitric Oxide 5:62–71
24. Lai WW, Geva T, Shirali GS, Frommelt PC, Humes RA, Brook MM, Pignatelli RH, Rychik J, Task Force of the Pediatric Council of the American Society of Echocardiography; Pediatric Council of the American Society of Echocardiography (2006) Guidelines and stan-dards for performance of a pediatric echocardiogram: a report from the Task Force of the Pediatric Council of the American Society of Echocardiography. J Am Soc Echocardiogr 19:1413–1430 25. Devereux RB, Alonso DR, Lutas EM, Gottlieb GJ, Campo E, Sachs
I, Reichek N (1986) Echocardiographic assessment of left ventric-ular hypertrophy: comparison to necropsy findings. Am J Cardiol 57:450–458
26. de Simone G, Daniels SR, Devereux RB, Meyer RA, Roman MJ, de Divitiis O, Alderman MH (1992) Left ventricular mass and body size in normotensive children and adults: assessment of allometric relations and impact of overweight. J Am Coll Cardiol 20:1251– 1260
27. Khoury PR, Mitsnefes M, Daniels SR, Kimball TR (2009) Age-specific reference intervals for indexed left ventricular mass in chil-dren. J Am Soc Echocardiogr 22:709–714
28. Nagueh SF, Appleton CP, Gillebert TC, Marino PN, Oh JK, Smiseth OA, Waggoner AD, Flachskampf FA, Pellikka PA, Evangelista A (2009) Recommendations for the evaluation of left ventricular diastolic function by echocardiography. J Am Soc Echocardiogr 22:107–133
29. Mirchandani D, Bhatia J, Leisman D, Kwon EN, Cooper R, Chorny N, Frank R, Infante L, Sethna C (2014) Concordance of measures of left-ventricular hypertrophy in pediatric hypertension. Pediatr Cardiol 35:622–626
30. Flynn JT, Falkner BE (2011) Obesity hypertension in adolescents: epidemiology, evaluation, and management. J Clin Hypertens 13: 323–331
31. Franks PW, Hanson RL, Knowler WC, Sievers ML, Bennett PH, Looker HC (2010) Childhood obesity, other cardiovascular risk factors, and premature death. N Engl J Med 362:485–493 32. Hermann M, Flammer A, Lüscher TF (2006) Nitric oxide in
hyper-tension. J Clin Hypertens (Greenwich) 8:17–29
33. Gruber HJ, Mayer C, Mangge H, Fauler G, Grandits N, Wilders-Truschnig M (2008) Obesity reduces the bioavailability of nitric oxide in juveniles. Int J Obes 32:826–831
34. Rajapakse NW, Karim F, Straznicky NE, Fernandez S, Evans RG, Head GA, Kaye DM (2014) Augmented endothelial-specificL -ar-ginine transport prevents obesity-induced hypertension. Acta Physiol 212:39–48
35. Meng W, Zhang C, Zhang Q, Song X, Lin H, Zhang D (2012) Association between leukocyte and metabolic syndrome in urban Han Chinese: a longitudinal cohort study. PLoS 7:e49875 36. Demir M (2013) The relationship between neutrophil lymphocyte
ratio and non-dipper hypertension. Clin Exp Hypertens 35:570–573 37. Feig DI, Madero M, Jalal DI, Sanchez-Lozada LG, Johnson RJ (2013) Uric acid and the origins of hypertension. J Pediatr 162: 896–902
38. Viazzi F, Antolini L, Giussani M, Brambilla P, Galbiati S, Mastriani S (2013) Serum uric acid and blood pressure in children at cardio-vascular risk. Pediatrics 132:e93–99
39. Babinska K, Kovacs L, Janko V, Dallos T, Feber J (2012) Association between obesity and the severity of ambulatory hyper-tension in children and adolescents. J Am Soc Hypertens 6:356– 363
40. Kim YK, Kim HU, Song JY (2009) Ambulatory blood pressure monitoring and blood pressure load in obese children. Korean Circ J 39:482–487
41. Aguilar A, Ostrow V, De Luca F, Suarez E (2010) Elevated ambu-latory blood pressure in a multi-ethnic population of obese children and adolescents. J Pediatr 156:930–935
42. Turak O, Ozcan F, Tok D, Işleyen A, Sökmen E, Taşoğlu I, Aydoğdu S, Sen N, McFann K, Johnson RJ, Kanbay M (2013) Serum uric acid, inflammation, and nondipping circadian pattern in essential hypertension. J Clin Hypertens (Greenwich) 15:7–13 43. Kotsis V, Stabouli S, Bouldin M, Low A, Toumanidis S,
Zakopoulos N (2005) Impact of obesity on 24-hour ambulatory blood pressure and hypertension. Hypertension 45:602–607 44. Civilibal M, Duru NS, Elevli M (2014) Subclinical atherosclerosis
and ambulatory blood pressure in children with metabolic syn-drome. Pediatr Nephrol 29:2197–2204
45. Thompson M, Dana T, Bougatsos C, Blazina I, Norris SL (2013) Screening for hypertension in children and adolescents to prevent cardiovascular disease. Pediatrics 131:490–525
46. Hanevold C, Waller J, Daniels S, Portman R, Sorof J, International Pediatric Hypertension Association (2004) The effects of obesity, gender, and ethnic group on left ventricular hypertrophy and geom-etry in hypertensive children: a collaborative study of the International Pediatric Hypertension Association. Pediatrics 113: 328–333
47. Battal F, Ermis B, Aktop Z, Can M, Demirel F (2011) Early cardiac abnormalities and serum N-terminal pro B-type natriuretic peptide levels in obese children. J Pediatr Endocrinol Metab 24:723–726 48. Dahiya R, Shultz SP, Dahiya A, Fu J, Flatley C, Duncan D,
Cardinal J, Kostner KM, Byrne NM, Hills AP, Harris M, Conwell LS, Leong GM (2015) Relation of reduced preclinical left ventric-ular diastolic function and cardiac remodeling in overweight youth to insulin resistance and inflammation. Am J Cardiol 115:1222– 1228
49. Correia-Costa L, Afonso AC, Schaefer F, Guimarães JT, Bustorff M, Guerra A, Barros H, Azevedo A (2015) Decreased renal func-tion in overweight and obese prepubertal children. Pediatr Res. doi:
10.1038/pr.2015.130
50. Di Bonito P, Sanguigno E, Forziato C, Di Fraia T, Moio N, Cavuto L, Sibilio G, Iardino MR, Di Carluccio C, Capaldo B (2014) Glomerular filtration rate and cardiometabolic risk in an outpatient pediatric population with high prevalence of obesity. Obesity (Silver Spring) 22:585–589
51. Bostanci BK, Civilibal M, Elevli M, Duru NS (2012) Ambulatory blood pressure monitoring and cardiac hypertrophy in children with metabolic syndrome. Pediatr Nephrol 27:1929–1935
52. Neeland IJ, Gupta S, Ayers CR, Turer AT, Rame JE, Das SR, Berry JD, Khera A, McGuire DK, Vega GL, Grundy SM, de Lemos JA, Drazner MH (2013) Relation of regional fat distribution to left ventricular structure and function. Circ Cardiovasc Imaging 6: 800–807