In silico analysis of mutant p53(R249S) oncogenicity in hepatocellular carcinoma
Tam metin
Şekil
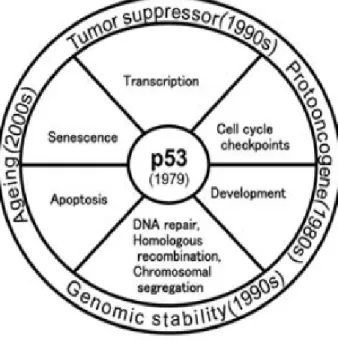
![Figure 1.3: p53: a two-faced cancer gene. (Kastan MB and Berkovich E, 2007) [14]](https://thumb-eu.123doks.com/thumbv2/9libnet/5797797.118075/14.918.169.717.493.1011/figure-faced-cancer-gene-kastan-mb-berkovich-e.webp)
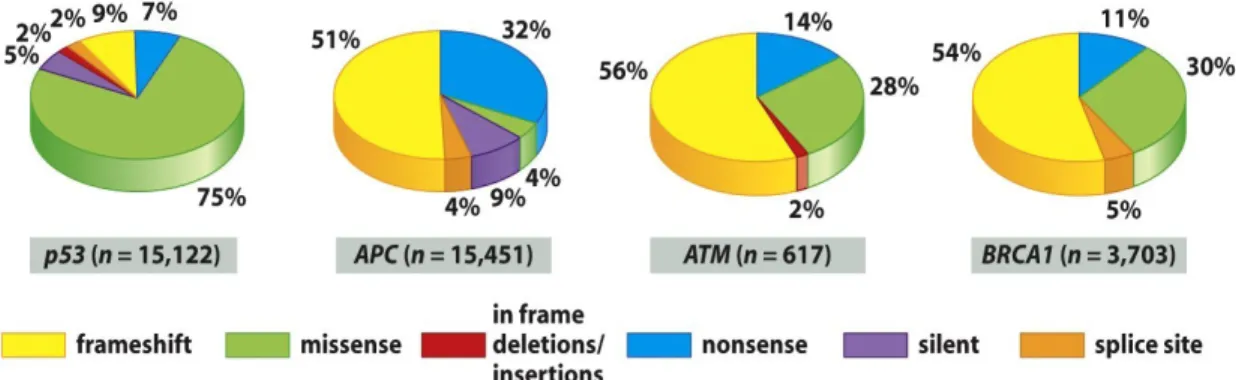
![Figure 1.4: Distribution of p53 mutations. (Weinberg RA, 2006) [11]](https://thumb-eu.123doks.com/thumbv2/9libnet/5797797.118075/15.918.179.755.292.516/figure-distribution-p-mutations-weinberg-ra.webp)
![Figure 1.7: Multistage hepatocarcinogenesis. (Hussain SP et al, 2007) [32]](https://thumb-eu.123doks.com/thumbv2/9libnet/5797797.118075/18.918.153.794.553.995/figure-multistage-hepatocarcinogenesis-hussain-sp-et-al.webp)
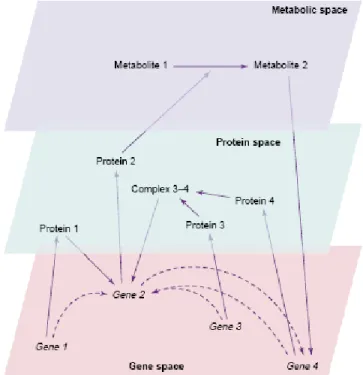
![Fig. 1.9: Overview of integrated analysis of genomic data. (Troyanskaya OG, 2005) [49]](https://thumb-eu.123doks.com/thumbv2/9libnet/5797797.118075/22.918.134.806.504.1002/fig-overview-integrated-analysis-genomic-data-troyanskaya-og.webp)
![Figure 2.1: The workflow of the thesis. (Adopted from Affymetrix web site) [50]](https://thumb-eu.123doks.com/thumbv2/9libnet/5797797.118075/25.918.184.757.180.327/figure-workflow-thesis-adopted-affymetrix-web-site.webp)
Benzer Belgeler
We found that (1) zeta potential of sepiolite suspensions increased with increasing ionic strength, (2) zeta potential values of sepiolite suspensions in different valence
mRNA interaction network of TNBC chemoresistance and identified a hypoxia-regulated novel tumor suppressor miRNA, TSM, or its target IFP as potential targets overcoming
By controlling the cubic Pd nanoparticle size and the thickness of the crystalline ZnO nanolayer deposited onto electrospun PAN nanofibers via atomic layer deposition (ALD),
In our integration method, the sidewalls of III–V devices are completely passivated with a polymer that self-planarizes flush with the device top to an atomic flatness in the
However, a normal-sized transcript without sequence abnormalities verified by single-stranded conformation polymorphism (SSCP) analysis was expressed at robust levels in all the
We recently generated 3 new monoclonal antibodies (mAb) by using cells of HUH7, a HCC cell line, and recombinant SIP1 proteins as immunogen against novel targets in HCC.. To
Temporal lob orijinli kompleks parsiyel nobetleri olan hastalar, cerrahi adaYl hasta grubunun en biiyiik toplulugunu olu~turur. Temporal lobektomi' deyimi farklI merkezlerde
züğürd tesellisi arıyanlar biliyorlar mı ki, Mithat Efendinin 1870 lerde söylediği bu doğru fikirler, esaslı bir dil hareketine konu olabilmek için gene
