miRNA-mRNA INTERACTION NETWORK
REGULATING CHEMOTHERAPY RESISTANCE IN TRIPLE
NEGATIVE BREAST CANCER
A THESIS SUBMITTED TO
THE GRADUATE SCHOOL OF ENGINEERING AND SCIENCE OF BILKENT UNIVERSITY
IN PARTIAL FULFILLMENT OF THE REQUIREMENTS FOR THE DEGREE OF
MASTER OF SCIENCE IN
MOLECULAR BIOLOGY AND GENETICS
By Ridho Assidicky
mil{t\A-mftflA INTE RACTI ON NE TWORI( RE GIILATIN G C HEM OTHE RAPY RESISTANCE IN TRIPLE NEGATIVE BREAST CANCER
By Ridho Assidicky June,2019
We certify that we have read this dissertation and that in our opinion it is fully adequate in scope and in quality, as a thesis for the degree of Master of Science.
Ozgi,ir $ahin (Advisor)
Approved for Graduate School of Engineering and Science
^t"^fN,M
Director of the Graduate School of Engineering and Science
ii
ABSTRACT
miRNA-mRNA INTERACTION NETWORK REGULATING CHEMOTHERAPY RESISTANCE IN TRIPLE NEGATIVE BREAST CANCER
Ridho Assidicky
M.S. in Molecular Biology and Genetics Advisor: Özgür Şahin
June, 2019
Triple negative breast cancer (TNBC) is the most aggressive breast cancer subtype, lacking the expression of the estrogen receptor (ER), progesterone receptor (PR) and human epidermal growth factor receptor-2 (HER2). Compared to other subtypes, which can be treated with targeted therapies, chemotherapy is the major regimen used to treat TNBCs. Moreover, TNBC patients have better response rate to chemotherapy compared to other breast cancer (BC) subtypes. However, patients develop resistance rapidly, which in turn significantly increases the mortality rate. Therefore, there is urgent unmet need for elucidating the mechanisms of chemotherapy resistance in TNBC and identifying novel targets that can overcome resistance or potentiate the efficacy of chemotherapy. In this line, we developed an in vivo chemoresistant TNBC xenograft model, performed whole transcriptome sequencing of these tumors, and built a miRNA-mRNA interaction network regulating TNBC chemoresistance. We identified an ECM glycoprotein (“EG”) as the central chemoresistance driver gene, and a candidate potential tumor suppressor miRNA (“TSM”) sensitizing cells to EG-induced chemoresistance. Mechanistically, TSM was downregulated by hypoxia in chemoresistant tumor microenvironment that, in turn, led to upregulation of an integrin family protein (“IFP”), which encodes a subunit of receptor recognizing EG. We further showed that TSM directly binds the 3’-UTR of IFP, represses its expression, and inhibits FAK/Src signaling, PI3K signaling and
iii
MAPK signaling pathways, which constitute the major pathways in cell survival. Importantly, overexpression of TSM or inhibition of the IFP overcame EG-driven chemotherapy resistance
in vitro and potentiated the efficacy of chemotherapy in vivo. Overall, we built the first
miRNA-mRNA interaction network of TNBC chemoresistance and identified a hypoxia-regulated novel tumor suppressor miRNA, TSM, or its target IFP as potential targets overcoming chemoresistance or potentiating the efficacy of chemotherapy in TNBCs
Keyword: TNBC, chemotherapy, chemoresistance, ECM glycoprotein (EG), tumor suppressor miRNA (TSM), integrin family protein (IFP), hypoxia, integrin signaling, chemosensitization.
iv
ÖZET
ÜÇLÜ NEGATİF MEME KANSERİNDE KEMOTERAPİ DİRENCİNİ DÜZENLEYEN miRNA-mRNA ETKİLEŞİM AĞI
Ridho Assidicky
Moleküler Biyoloji ve Genetik, Yüksek Lisans Tez danışmanı: Özgür Şahin
Haziran, 2019
Triple (üçlü) negatif meme kanseri (TNMK) en agresif meme kanseri alt türü olup östrojen reseptörü (ER), progesteron reseptörü (PR) ve insan epidermal büyüme faktörü reseptörü 2’yi (HER2) ifade etmemektedir. TNMK üzerinde hedefli terapi ajanlarının etkinliğinin kısıtlı olması, konvansiyonel kemoterapiyi yegane tedavi opsiyonu kılmaktadır. Bununla birlikte, TNMK diğer meme kanseri alt türlerine kıyasla başlangıçta kemoterapiye daha yüksek oranda yanıt vermektedir. Ancak hastalar kısa sürede direnç geliştirmekte ve bu, ölüm oranlarının belirgin düzeyde artışına sebebiyet vermektedir. Bu nedenle TNMK’de ilaç direncinin altında yatan mekanizmaların aydınlatılması ve direnci kırabilecek ya da kemoterapinin etkisini güçlendirebilecek yeni hedeflerin belirlenmesi hususunda ivedilikle karşılanmayı bekleyen bir ihtiyaç bulunmaktadır. Bu doğrultuda, bir in vivo kemoterapi dirençli TNMK ksenogreft modeli geliştirdik ve tüm transkriptom ve miRNA-mRNA etkileşim ağı analizlerini yaptık. Bir ekstrasellüler matriks glikoproteinini (“EG”) kemoterapi direncine sebebiyet veren merkezi gen olarak ve EG-güdümlü kemoterapi direncini kırma potansiyeline sahip bir aday tümör baskılayıcı miRNA (“TSM”) belirledik. Mekanizmal açıdan, TSM ifadesi kemoterapi dirençli tümör mikroçevresinde hipoksi tarafından azaltılmakta ve bu, EG reseptörü alt birimi olan bir integrin ailesi proteinin (“IFP”) artışına yol açmaktadır. Devamında, TSM’nin doğrudan IFP’nin 3’-UTR’sine bağlandığını, IFP ifadesini baskıladığını ve başlıca hücre sağkalım
v
yolaklarını teşkil eden FAK/Src, PI3K ve MAPK sinyal yolaklarını engellediğini gösterdik. Daha önemlisi, TSM’nin aşırı ifade edilmesi ya da IFP’nin engellenmesi, EG-güdümlü in vitro kemoterapi direncini kırmış ve in vivo kemoterapi etkinliğini güçlendirmiştir.
Sonuç olarak, TNMK kemoterapi direncinin ilk miRNA-mRNA etkileşim ağını oluşturduk ve hipoksi tarafından düzenlenen yeni bir tümör baskılayıcı miRNA, TSM’yi ya da hedefi IFP’yi kemoterapi direncinin üstesinden gelme ya da kemoterapinin etkinliğini güçlendirmede potansiyel hedefler olarak belirledik.
Anahtar kelimeler: TNMK, kemoterapi, kemoterapi direnci, EG, tümör baskılayıcı miRNA (TSM), integrin ailesi proteini (IFP), hipoksi, integrin yolağı, kemoterapi direncinin kırılması.
vi
To my parents
And
vii
Acknowledgements
I would first like to thank Dr. Özgür Şahin for his kind support and supervision to perform and complete my Master’s study in his lab. My greatest appreciation to him for giving a valuable opportunity and experience to improve myself both academically and personally.
I would like to thank Pelin Gülizar Ersan for her help in performing in vivo experiment. Moreover, I would like to thank Özge Saatci, Ünal Metin Tokat and Özge Akbulut for their thoughtful discussions throughout my Master study. I would like to thank İbrahim Oğuzhan Tarman for his help in drawing the cellular pathway illustration and also for his warm friendship. I would like to thank Suhail A. Ansari for helping me and demonstrating many in
vitro experiments in my first year. I would also like to thank my intern, Didar Kerman for her
friendly help in the last year.
I would like to acknowledge all the former members of Dr. Özgür Şahin’s lab, Rasmi Misra, Nevin Belder, Umar Raza, Erol Eyüpoğlu, Hilal Bal, Selvi Durmuş and Özlem Şener Şahin for their help, support and meaningful friendship.
Additionally, I would like to thank Dr. Tolga Can from Middle East Technical University for performing random-walk based simulation, namely activity flow analysis to our chemoresistance network. Further, I thank Dr. Hasan Ogul from Baskent University for his help with building the initial miRNA-mRNA interaction network.
I would like to thank Scientific and Technological Research Council of Turkey (TÜBITAK) with the grant number 214S104 (OS), Marie Curie Career Integration Grant with the grant number 631149 (OS) and Bilkent University, Department of Molecular Biology and Genetics for providing financial support to me during my study as well as to the accomplished works in this thesis.
Last but not least, I would be thankful to my family for always being patience and supportive of me during my study. My deepest thank to my lovely wife, Risma Yulita Sundawa for always supporting, trusting and being available to listen to me. I promised to pay back the time we missed during this long-distance relationship.
viii
Teşekkürler
Öncelikle tez danışmanım Yrd. Doç Dr. Özgür Şahin’e, Yüksek Lisans çalışmalarımı laboratuvarında yürütebilmem ve tamamlayabilmem için bana sunduğu destek ve rehberlikten dolayı çok teşekkür ederim. Kendimi hem akademik hem de kişisel olarak geliştirebilmem için bana bu değerli fırsatı tanıdığından ötürü sonsuz minnettarlığımı sunarım.
Pelin Gülizar Ersan’a in vivo deneylerinde göstermiş olduğu yardımlar için çok teşekkür ederim. Ayrıca, Özge Saatci, Ünal Metin Tokat ve Özge Akbulut’a çalışmalarım boyunca sağladıkları bilimsel tartışmalar ve fikir alışverişleri için çok teşekkür ederim. İbrahim Oğuzhan Tarman’a şekillerin çizimi ile düzenlenmesi konusundaki yardımları ve cana yakın arkadaşlığı için teşekkürlerimi sunuyorum. Suhail A. Ansari’ye çalışmalarımın ilk yılında bana in vitro deneyler hakkında öğrettikleri ve yardımlarından dolayı teşekkür ediyorum. Son senemde deneyler sırasında göstermiş olduğu yardımlardan dolayı stajyerim Didar Kerman’a teşekkürlerimi sunuyorum.
Cana yakın arkadaşlıklarından ve benden esirgemedikleri yardım ve desteklerden ötürü Yrd. Doç. Dr. Özgür Şahin’in tüm geçmiş laboratuvar üyeleri, Rasmi Misra, Nevin Belder, Umar Raza, Erol Eyüpoğlu, Hilal Bal, Selvi Durmuş ve Özlem Şener Şahin’e çok teşekkür ediyorum, Ayrıca, Orta Doğu Teknik Üniversitesi’nden Dr. Tolga Can’a, rassal yürüyüş temelli simülasyona dayanan aktivite akış analizini kemoterapi direnci ağımıza uyguladığı için teşekkürlerimi sunuyorum. Ayrıca, miRNA-mRNA etkileşim ağının kurulmasında yardımcı olduğu icin Başkent Üniversitesi öğretim üyesi Dr. Hasan Oğul’a teşekkürlerimi sunuyorum. Yüksek lisans eğitimim boyunca beni, sırasıyla 214S104 (ÖŞ) ve 631149 (ÖŞ) numaralı projeler ile finansal olarak destekleyen ve aynı zamanda tez çalışmamın gerçekleşmesini sağlayan Türkiye Bilimsel ve Teknik Araştırma Kurumu'na (TÜBİTAK), Marie Curie Kariyer Entegrasyonu Fonu’na ve sağladıkları burs ile bana destek olan Bilkent Üniversitesi Moleküler Biyoloji ve Genetik Bölümü’ne teşekkür ederim.
Ve son olarak, yüksek lisans çalışmalarım boyunca beni her zaman desteklemiş olan ve sabreden aileme sonsuz minnetlerimi sunarım. Beni her zaman dinleyen, bana hep güvenen ve her zaman arkamda duran canım eşim Risma Yulita Sundawa’ya en derinden teşekkürlerimi sunuyorum. Bu uzun-mesafe ilişkisi sebebiyle kaçırdığımız bütün zamanları telafi edeceğime söz veriyorum.
ix
Contents
ABSTRACT ... ii ÖZET ... iv Acknowledgements ... vii Teşekkürler ... viii Contents ... ixList of Figures ... xii
List of Tables ...xiv
Abbreviations ... xv
Introduction ...1
Breast cancer ...1
1.1.1. Triple negative breast cancer (TNBC) ...3
Chemotherapy ...4
1.2.1. Development of resistance against chemotherapy ...5
Tumor microenvironment and chemotherapy resistance...5
MicroRNAs and their biogenesis ...7
Dysregulation of miRNA in cancer and miRNA as potential therapy ... 10
miRNA-mRNA interaction networks in cancer ... 12
The rationale and the aims of the study ... 14
Materials ... 15
2.1. Buffers ... 15
2.2. Chemicals and reagents ... 15
2.3. Enzymes and enzyme buffers ... 17
2.4. Media and supplements ... 17
2.5. Kits ... 18
2.6. Equipment ... 18
2.7. Consumables ... 19
Methods ... 21
3.1. In vitro experiment ... 21
3.1.1. Culturing human breast cancer cell lines ... 21
3.1.2. Cell seeding on fibronectin-coated well ... 21
3.1.3. Transient transfection using miRNA mimics, siRNAs and reporter constructs ... 21
x
3.1.5. Dual luciferase reporter assay ... 24
3.1.6. Doxorubicin treatment and cell viability assays ... 25
3.1.7. Hypoxia assay ... 25
3.1.8. Quantitative Real-Time Polymerase Chain Reaction (qRT-PCR) ... 26
3.1.8.1. RNA isolation ... 26
3.1.8.2. Reverse Transcription for mRNA ... 26
3.1.8.3. qRT-PCR for mRNA quantification ... 27
3.1.8.4. Reverse transcription for miRNAs ... 29
3.1.8.5. qRT-PCR for miRNA quantification ... 30
3.1.9. Protein Biochemistry ... 31
3.1.9.1. Protein Isolation ... 31
3.1.9.2. Protein Quantification ... 32
3.1.9.3. Sodium dodecyl sulfate polyacrylamide gel electrophoresis (SDS-PAGE) ... 33
3.1.9.4. Western Blotting ... 34
3.1.10. Stable transfection using lentiviral vectors ... 36
3.2. In vivo experiments ... 37
3.2.1. Primary tumor xenografts... 37
3.2.2. In vivo doxorubicin treatment and induction of stable vector ... 37
3.2.3. In vivo imaging system (IVIS) analysis of primary tumors ... 38
3.3. Bioinformatics and statistical analyses ... 38
3.3.1. Whole transcriptome sequencing and data analysis ... 38
3.3.2. miRNA-mRNA interaction network construction ... 39
3.3.3. Generating gene signatures, GSEA and survival analysis ... 39
3.3.4. Network activity flow ... 40
3.3.5. miRNA target prediction and KEGG pathway enrichment analysis ... 41
3.3.6. GEO dataset and statistical analyses ... 41
Results... 42
4.1. Development and characterization of doxorubicin resistant TNBC tumor model ... 42
4.2. Fibronectin (FN1) mediates doxorubicin resistance in TNBC cells ... 49
4.3. miR-326 inhibits fibronectin-mediated doxorubicin resistance in vitro... 52
4.4. miR-326 overcomes FN1-mediated doxorubicin resistance via targeting ITGA5 and repressing integrin-associated signaling pathways ... 56
4.5. Hypoxia regulates miR-326 expression via HIF1A ... 63
4.6. Overexpression of miR-326 sensitizes TNBCs to doxorubicin in vivo ... 66
xi
Discussion ... 75
5.1. miRNA-mRNA interaction network as a tool to identify key regulations in TNBC chemoresistance ... 77
5.2. Fibronectin and chemotherapy resistance ... 78
5.3. Tumor suppressor miR-326 as potential chemo-sensitizer in TNBCs ... 80
5.4. ITGA5 and integrin associated signaling in the context of chemoresistance ... 80
5.5. Hypoxia modulation in chemoresistance ... 82
Conclusion and Future Perspectives ... 85
Bibliography... 88
xii
List of Figures
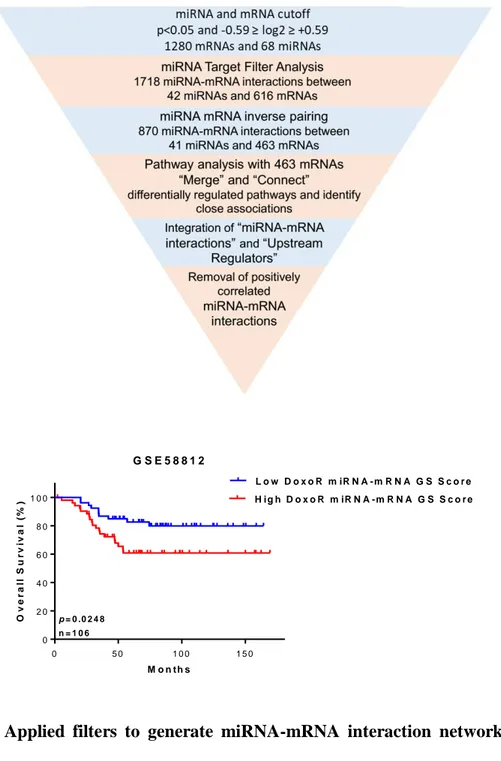
Figure 1. 1. Classification of breast cancer subtypes based on gene expression profiling and survival outcome of these subtype. ...2 Figure 1. 2. miRNA biogenesis pathway. ...9 Figure 4. 1. Development of doxorubicin resistance in female nude mice using MDA-MB-231 TNBC cells. ... 43 Figure 4. 2. Applied filters to generate miRNA-mRNA interaction network of TNBC
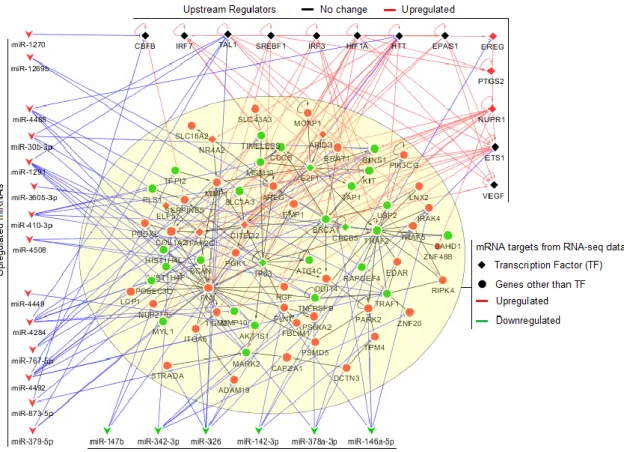
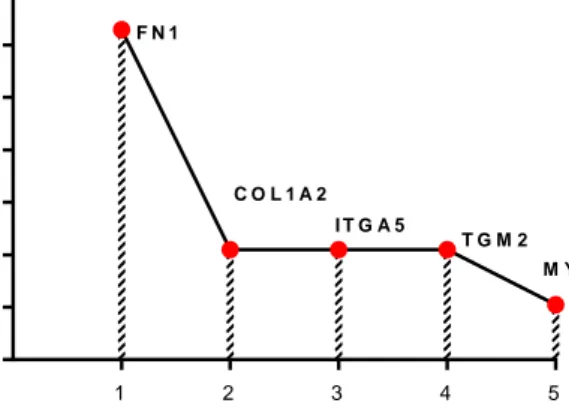
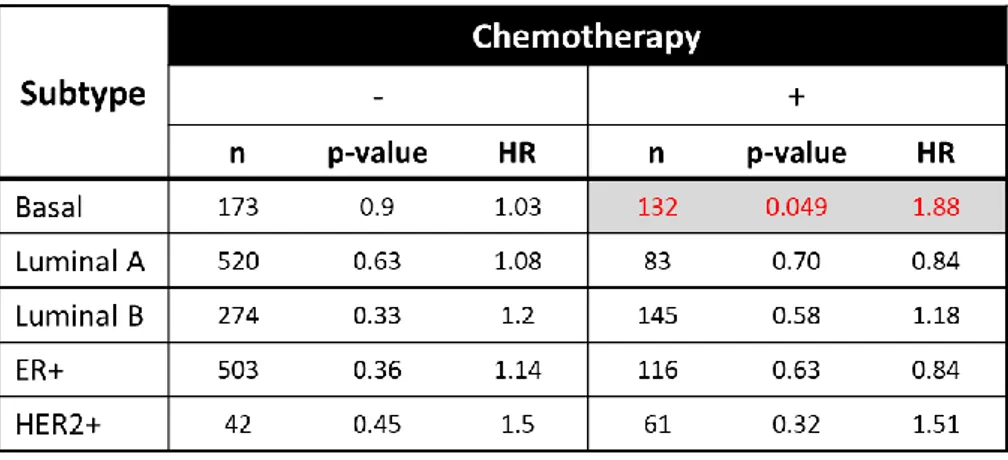
chemoresistance and validation of DoxoR miRNA-mRNA GS score in TNBC patients. ... 44 Figure 4. 3. Doxorubicin resistance associated miRNA-mRNA interaction network. ... 45 Figure 4. 4. Forest plot showing survival analyses of chemotherapy treated TNBC patients. . 47 Figure 4. 5. The refined miRNA-mRNA interaction network underlying TNBC
chemoresistance and activity flow analysis. ... 49 Figure 4. 6. FN1 is associated with poor RFS specifically in chemotherapy-treated TNBCs. . 50 Figure 4. 7. Doxorubicin response of MDA-MB-231 cells seeded on uncoated and FN-coated wells. ... 52 Figure 4. 8. Validation of downregulated miRNA candidates identified in doxorubicin
resistance network. ... 53 Figure 4. 9. Sensitization of fibronectin-mediated doxorubicin resistance using miRNA mimics... 54 Figure 4. 10. Western blots showing cleaved PARP levels of MDA-MB-231 cells. ... 55 Figure 4. 11. Cell viability of MDA-MB-436 cells upon doxorubicin and/or miR-326
treatment on fibronectin-coated plates. ... 56 Figure 4. 12. ITGA5 mRNA and protein levels upon miR-326 mimic transfection in MDA-MB-231 cells. ... 57 Figure 4. 13. Validation of direct binding of miR-326 to ITGA5. ... 58 Figure 4. 14. ITGA5 is correlated with poor RFS in chemotherapy-treated basal patients. .... 59 Figure 4. 15. Cell viability response of MDA-MB-231 cells upon doxorubicin and/or siITGA5 treatment on fibronectin-coated plates. ... 60 Figure 4. 16. KEGG pathway enrichment analysis of miR-326 targets using DAVID 6.8 tool. ... 61 Figure 4. 17. Relative measurement of miR-326 and ITGA5 mRNA expression in 231.Luc2 GFP stable cells using qRT-PCR. ... 62
xiii
Figure 4. 18. Regulation of signaling pathways upon miR-326 overexpression or ITGA5 inhibition. ... 63 Figure 4. 19. GSEA using four different hypoxia-related gene sets in RNA-seq data from doxorubicin sensitive and resistant tumors. ... 64 Figure 4. 20. Expression correlation between HIF1A and miR-326 in patient datasets. ... 65 Figure 4. 21. Negative regulation of miR-326 by hypoxia via HIF1A. ... 66 Figure 4. 22. In vivo validation of doxycycline-induced stable cells overexpressing miR-326. ... 67 Figure 4. 23. Effect of miR-326 overexpression on doxorubicin response and mice body weight. ... 68 Figure 4. 24. End-point measurement of tumors upon treatment with doxorubicin and miR-326 overexpression either alone or in combination... 69 Figure 4. 25. In vivo validation of doxycycline-induced stable cells overexpressing shITGA5. ... 71 Figure 4. 26. Effect of ITGA5 inhibition on doxorubicin response and mice body weight. .... 72 Figure 4. 27. End-point measurement of tumors upon treatment with doxorubicin and ITGA5 inhibition either alone or in combination. ... 73 Figure 5. 1. Schematic illustration of HIF1A/miR-326/ITGA5-FN1 axis mediated doxorubicin resistance in TNBCs and chemosensitization upon miR-326 modulation. ... 77
xiv
List of Tables
Table 3. 1. Primer sequences for 3’-UTR cloning ... 23
Table 3. 2. Double digestion protocol ... 23
Table 3. 3. Ligation reaction Protocol ... 24
Table 3. 4. Protocol for reverse transcription reaction ... 26
Table 3. 5. Thermocycler program for reverse transcription reaction ... 27
Table 3. 6. Master mix composition used for qRT-PCR reaction ... 27
Table 3. 7. Sequences of forward and reverse primers used for qRT-PCR reaction ... 28
Table 3. 8. Thermocycler program used for qRT-PCR ... 28
Table 3. 9. Protocol for Taqman miRNA reverse transcription reaction ... 29
Table 3. 10. Thermocycler program for Taqman miRNA reverse transcription ... 30
Table 3. 11. Taqman miRNA qRT-PCR master mix ... 30
Table 3. 12. Program for Taqman miRNA qRT-PCR amplification ... 31
Table 3. 13. RIPA lysis buffer preparation ... 32
Table 3. 14. Protocol for 4X loading dye preparation ... 33
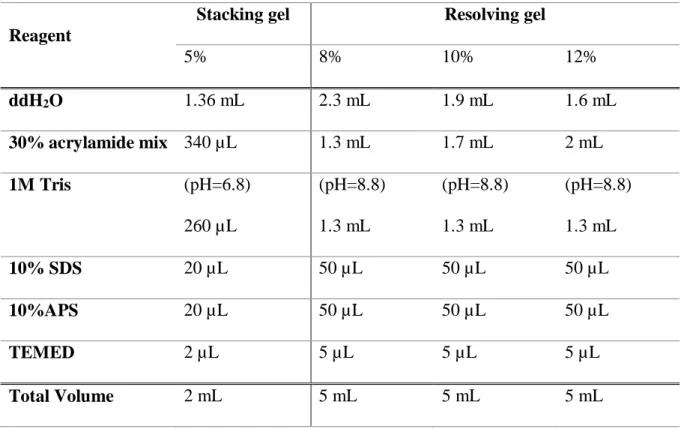
Table 3. 15. Protocol for stacking and resolving gels preparation ... 34
Table 3. 16. List of primary antibodies used for Western blot. ... 35
xv
Abbreviations
AGO Argonaute
AKT serine/threonine-specific protein kinase, also known as protein kinase B ERK Extracellular signal-regulated kinase
APS Ammonium persulfate AR Androgen receptor ECM Extracellular matrix ARRB1 Arrestin Beta 1 BCA Bicinchoninic acid
Bcl-2 B-cell lymphoma 2 protein
B-CLL B-Cell chronic lymphocytic leukemia
BRAF B-Raf Proto-Oncogene, Serine/Threonine Kinase BRCA1 Breast cancer type 1 susceptibility protein
BSA Bovine serum albumin CCND1 Cyclin D1
cDNA Complementary DNA CST Cell Signaling Technologies
DAVID The database for annotation, visualization and integrated discovery DGCR8 DiGeorge syndrome chromosomal region 8
DMEM Dulbecco’s modified eagle medium DNA Deoxyribonucleic acid
dNTP Deoxyribonucleotide triphosphate dsRNA Double stranded RNA
ECL Enhanced chemiluminescence EGFR Epidermal growth factor receptor ELK1 Proto-oncogene, ETS-like gene 1 EMT Epithelial–mesenchymal transition MMP Matrix metalloproteinase
xvi ER Estrogen receptor
ERBB2 Proto-oncogene erb-b2 receptor tyrosine kinase 2, commonly referred as HER2 FAK Focal adhesion kinase
FBS Fetal bovine serum
FDA Food and Drug Administration FN/FN1 Fibronectin
GEO Gene expression omnibus GFP Green fluorescence protein GS score Gene Signature score
GSEA Gene Set Enrichment Analysis
HER2 Human epidermal growth factor receptor 2 HIF Hypoxia-inducible factor
HIF1A Hypoxia-inducible factor alpha subunit HR Hazard ratio
RFS Relapse free survival
IPA Ingenuity Pathway Analysis ITGA5 Integrin subunit alpha 5 ITGB1 Integrin subunit beta 1 IVIS In vivo imaging system
kDa kilo Dalton
KEGG Kyoto encyclopedia of genes and genomes KRAS Proto-oncogene, Kirsten Rat Sarcoma LB Lysogeny broth
MAPK Mitogen-activated protein kinase MFP Mammary fat pad
MFS Metastasis free survival miRNA microRNA
mRNA Messenger RNA
xvii OS Overall survival
P/S Penicillin/Streptomycin
PARP Poly (ADP-ribose) polymerase protein PBS Phosphate buffered saline
PCR Polymerase chain reaction pCR Pathological complete response PDX Patient derived xenograft PI3K Phosphoinositide 3-kinase
PIK3CA Phosphatidylinositol-4,5-bisphosphatase 3-kinase PR Progesterone receptor
Pre-miRNA Precursor miRNA Pri-miRNA Primary miRNA
PTEN Phosphatase and tensin homolog PVDF Polyvinylidene difluoride
qRT-PCR Quantitative Real Time polymerase chain reaction RB1 Retinoblastoma protein 1
RCB Residual cancer burden RFP Red fluorescence protein RFS Relapse-free survival RGD Arg-Gly-Asp motif
RIPA Radioimmunoprecipitation assay RISC RNA-induced silencing complex RNA Ribonucleotide acid
RNAi RNA interference
RPPA Reverse phase protein array rRNA Ribosomal RNA
SDS-PAGE Sodium dodecyl sulfate-gel electrophoresis shRNA Small hairpin RNA
xviii SIRT1 Sirtuin 1
Src Src proto-oncogene, non-receptor tyrosine kinase TAE Tris-acetate EDTA
TBST Tris buffer saline Tween20 TCGA The Cancer Genome Atlas
TEMED Thermo Scientific Pierce Tetramethylethylenediamine TGF-β Transforming growth factor beta
TNBC Triple negative breast cancer TP53 Tumor protein 53
UTR Untranslated region v/v Volume/volume w/v Weight/volume
1
Chapter 1
Introduction
Breast cancer
Breast cancer is the most common cancer and the leading cause of cancer-associated deaths among women worldwide [1]. In 2017, The American Cancer Society reported that more than 250.000 women are expected to be diagnosed with invasive breast carcinoma in the US, and around 40.000 BC patients will die eventually due to the disease (American Cancer Society, 2017). Even though breast cancer is mostly seen in women of age 40-45 or more, there is a clear trend that the incidence age is decreasing in the recent years [2].
Breast cancer is a heterogeneous disease encompassing very different biological entities, and therefore requires distinct clinical treatments. Classification based on the classical immunohistochemistry markers distinguishes breast cancer into 3 subtypes: human epidermal growth factor receptor (HER2+/ERBB2+)-overexpressed, hormone receptor positive (Estrogen Receptor (ER)+/Progesterone Receptor (PR)+), and triple negative breast cancer (TNBC) [3]. According to the gene expression profiling, breast cancer can be classified into five subtypes: Luminal A, Luminal B, HER2-enriched, Basal-like and Normal-like [4] [5]. Luminal A and Luminal B breast cancer possess similarity to hormone receptor positive subtype where they both express estrogen receptor alpha (ERα). Tumors with this characteristic often respond well to endocrine therapies, such as tamoxifen and aromatase inhibitors [6]. HER2-enriched subtype (ERBB2+), as the name suggests, has elevated levels of HER2 protein receptor that is mostly due to gene amplification [7]. HER2-targeted therapies, such as trastuzumab or lapatinib, are common treatment options for this subtype [8]. Lastly, Basal-like subtype mostly resembles TNBC in terms of hormone and HER2 receptor expressions, leaving chemotherapy as the only
2
treatment option for the patients [5]. Approximately, 80% of breast cancer cases fall into one of these five breast cancer molecular subtypes. Therefore, classification of patients by subtype is not only important for the treatment selection, but also useful in predicting the prognostic outcome of breast cancer patients (Figure 1.1) [9].
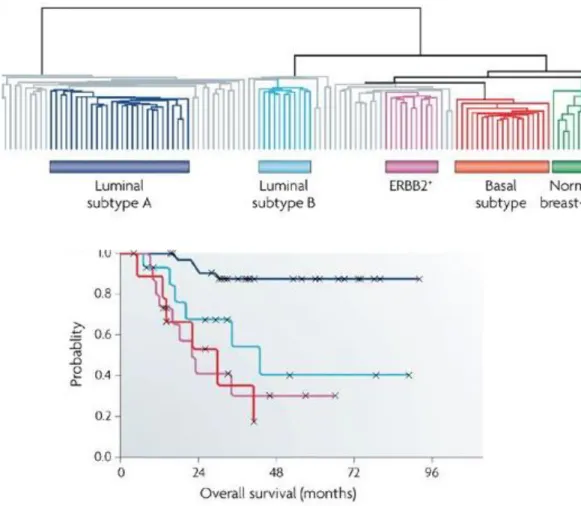
Figure 1. 1. Classification of breast cancer subtypes based on gene expression profiling and survival outcome of these subtype. (A) A dendrogram classifies 115 breast tumors into 5 subtypes as Luminal A, Luminal B, ERBB+ / HER2-enriched, Basal and Normal-like subtypes. Samples in grey do not correspond to any of the subtype. (B) Survival analysis of different breast cancer subtypes which is represented as probability of overall survival. Luminal A subtype shows better prognosis followed by Luminal B and HER2-enriched whereas Basal subtype has the worst overall survival compared to others [9]. See copyright permission in
Appendix Section.
B.
A.
3 1.1.1. Triple negative breast cancer (TNBC)
TNBC tends to be high grade/stage and is the most aggressive subtype of breast cancer, accounting for about 15% of the all breast cancer cases. Gene expression-based subtyping demonstrated that most of the TNBCs are classified as basal subtype with the highest risk of developing distant recurrence and subsequent death within 5 years of diagnosis compared to other subtypes [10, 11]. Despite their common characteristics with respect to the absence of ER, PR, and HER2 expression, TNBCs display heterogeneity with respect to gene expression profiles [12]. Analysis performed by The Cancer Genome Atlas (TCGA) Research Network that combines different platforms including reverse-phase protein arrays (RPPA), DNA copy numbers, and exome sequencing revealed that genetic alterations in TNBCs are mostly occurred in the genes involved in phosphatidylinositol 3-kinase (PI3K) signaling and DNA damage repair mechanisms [13]. Dysregulation of PI3K pathway involves loss-of-function mutations in prominent negative regulator of PI3K pathway; PTEN, or gain-of-function mutations in PI3K catalytic subunit; PIK3CA, as well as in PI3K downstream signaling; mTOR signaling associated genes [10]. TNBCs with highly activated PI3K pathway due to abovementioned mutations respond well to PI3K/mTOR inhibitors, such as NVP-BEZ235 in pre-clinical settings [14]. Meanwhile, aberrant regulation of DNA damage repair mechanism is frequently related with the loss-of-function mutations in RB1, TP53, and BRCA1 genes and therefore, this type of TNBC responds well to DNA-damaging agents, such as cisplatin [14, 15]. Further efforts in subtyping TNBC also identified other biomarkers participating in cell cycle, growth factor signaling, immune cell signaling, cell motility and even hormone-regulated pathways [14, 15]. Taken together, understanding the basis of heterogeneity of TNBCs in terms of gene expression profiles can yield better patient stratification for the most favorable treatment.
4 Chemotherapy
The use of chemical substances to cure cancer in the middle of nineteenth century started the era of chemotherapy that complements previously other major therapies, such as surgery and radiotherapy. Chemotherapy fulfilled the need of systemic cancer treatment that could not be achieved with local therapies [16]. Interestingly, some anti-cancer agents were discovered through screening of natural compounds without clear mechanisms of action [17, 18]. Other chemotherapeutic agents, like cisplatin and Adriamycin (also known as doxorubicin), which were originally known as anti-bacterial substances, were later found to have anti-cancer effects [19, 20]. Nowadays, conventional chemotherapies still constitute an important part of a preferable cancer therapy even though the era of “targeted therapy” had been set out along with our better understanding on molecular and genetics basis of cancer.
In case of TNBC, chemotherapy remains as mainstay treatment regardless of its high toxicity and side effects. Fortunately, TNBC has been shown to respond better to chemotherapy compared to other subtypes of breast cancer [21]. However, the success of chemotherapy is limited by many factors. Its lack of specificity inflicts side effects to patients, such as nausea, bleeding and loss of hair since proliferative normal cells are also affected during the treatment [22]. Moreover, chemotherapy often further increases cellular heterogeneity in cancer cell population, some of which may develop resistance during the course of treatment [23]. Ultimately, conventional chemotherapy often shows poor prognosis in TNBC due to rapid relapse and aggressiveness [23, 24]. The use of chemotherapy as neo-adjuvant treatment increased pathological complete response (pCR) rate of TNBC patients and could prolong their survival [25], yet residual disease after neo-adjuvant treatment leads to worse prognosis in TNBC patients, especially in the first 3 years after treatment [11, 26].
5
1.2.1. Development of resistance against chemotherapy
One of the many challenges for chemotherapy regimens in clinics is the development of resistance, which in most cases is inevitable. Initially, many TNBCs respond well to chemotherapy. However, they can acquire resistance over time through several distinct mechanisms, including genetic and epigenetic alterations [27]. It has been shown that chemotherapy resistance contributes up to 90% of failure in treatment rate of metastatic patients. [28]. The high rate of relapse is linked to small cohorts of cancer cells which gain aberrant pro-survival signals, resulting in more aggressive phenotype after systemic chemotherapy treatment [29]. It is still being debated whether the development of resistance is due to genetic mutations throughout medication or due to pre-existing genetic variation within primary cancer cell population or even due to both [30, 31]. The rationale of chemotherapy resistance is an evolutionary process to partially accomplish hallmarks of cancer: evading apoptosis and limitless replicative potential [32, 33].
Tumor microenvironment and chemotherapy resistance
Tumor cells do not exist as isolated entities in a given organ. Instead, they are engaged with other cellular components comprising non-transformed adjacent cells and complex stromal environments [34]. Notably, stromal tissues consist of many elements including tumor vasculature, fibroblasts, and extracellular matrix (ECM) which, in fact, often represents to the majority of tumor mass. Further, various molecules in ECM, which are secreted by normal neighbor cells as well as fibroblasts, have been shown to be crucial in promoting tumorigenesis [29, 35]. Different cytokines, chemokines, and matrix re-modeling enzymes are also enriched
6
in tumor microenvironment, implying advanced and dynamic interaction between tumor cells, normal tissues, and even immune cells [36].
The ECM consists of assembled structural proteins and other macromolecules that provides three dimensional structure serving as scaffold to tumor cells [37]. Importantly, tumor microenvironment-associated ECM is distinct from ECM of healthy tissues with respect to its composition. The changes in ECM of tumor includes high density of collagen that contributes to the stiffness of malignant tissue. Besides promoting aggressiveness of tumor, this stiffened ECM acts as physical barrier for which chemotherapy agents must pass through, and therefore leads to reduction of therapy efficacy [38, 39]. Interestingly, malignant tumors often acquire the ability to produce their own ECM with different proteomic signatures that might be worth exploited for biomarker of late stage cancer [40]. Some of these well-known differentially expressed ECM proteins comparing low and high grade breast cancer constitute fibronectin (FN1) and collagen type I alpha 2 (COL1A2) [41].
Vascularization is also an important process in tumor microenvironment that is needed for sustainable tumor growth. However, in a progressing and advanced tumor, growth of tumor often outstrips vascular supply which then creates less oxygenated area; a condition called as hypoxia [42]. Hypoxic tumor environment frequently enforces cancer to switch their metabolic pathways that might contribute to cancer aggressiveness [43]. For instance, hypoxia-inducible factor (HIF) that constitutes the major protein executor in hypoxia response was found to promote tumorigenesis [42]. HIF induces cancer cell proliferation and even invasion, partially through some HIF-regulated ECM proteins such as vimentin, fibronectin, matrix metalloproteinase (MMP), and cytokine receptor CXCR4 [44]. Importantly, hypoxia has been associated with the reduced efficacy of many cancer treatments including chemotherapy,
7
radiotherapy, and immunotherapy [45]. A number of anti-cancer agents including some anthracyclines, antimetabolites and alkylating agents have been reported to work less effectively in hypoxic environment [46].
The interaction of cancer cells with their microenvironment can dictate the activity of intracellular signaling. For example, type I collagen (Col-I), a prominent ECM component, triggers dormant breast cancer cells to enter proliferative stage through activation of β1-integrin, Src and extracellular signal-regulated kinase (ERK) [47]. Similarly, interaction of laminin, another component of ECM, with integrins also induces EGFR activation and promotes NF-κB mediated survival along with anti-apoptotic response [48, 49]. More importantly, ECM ligation activates several cell signaling processes that play pivotal role in cell survival and anti-apoptotic mechanisms, including PI3K, MAPK, and FAK-Src pathways [50, 51]. Taken together, ECM contributes to the development of chemotherapy resistance through alteration of tumors’ biophysical properties and modulation of intracellular signaling pathways that favors self-survival and apoptotic escape.
MicroRNAs and their biogenesis
MicroRNAs (miRNAs) are short (18-25 nucleotides) non-coding RNAs that function in regulating the expression of many genes mainly through complementary base pairing to the 3’-untranslated region (3’-UTR) of target mRNAs. According to miRBase (www.mirbase.org), more than 2600 miRNAs are encoded by human genome, and 60% of human genes are predicted to be regulated by miRNAs [52, 53], suggesting the importance of miRNAs in molecular and cellular organizations.
8
A large number of miRNA genes are located in the regions quite distant from other annotated genes, indicating that they represent single transcriptional unit (intergenic miRNA gene) [54]. Around 40% of these intergenic miRNAs are expressed within same primary transcripts, resulting in polycistronic miRNAs [55]. A well-studied example of miRNAs co-expressed in polycistronic precursor is miR-17/92 cluster that produces six different mature miRNAs (miR-17, miR-18a, miR-19a, miR-19b, miR-20a, and miR-92a-1) [56]. There is a hypothesis that miRNAs generated from common polycistronic transcript are homologous and regulate overlapping targets. Some other miRNAs derived from same transcript may have different targets, yet still co-regulate the same biological pathways [57, 58]. A few miRNA genes are located in another gene (intragenic miRNA genes), and have the same transcriptional regulatory sites and orientation as its host gene [54]. The host gene might be either coding or non-coding gene where miRNA genes may reside within intron (intronic miRNA gene) or within exon (exonic miRNA gene) of their host genes.
The biogenesis of miRNAs starts with transcription of miRNA gene by RNA polymerase II into large primary transcript called pri-miRNA, which is equipped with 5’ cap and 3’ poly-A tail structures [59]. Pri-miRNA is a long double stranded RNA (dsRNA), that is later cleaved by Drosha, an RNase III-type enzyme, into shorter (~60 nucleotides) hairpin dsRNA called pre-miRNA [60]. Drosha that forms a protein complex with other proteins, such as Pasha (DGCR8), delivers pre-miRNA into cytoplasm with the help of nuclear transport exportin 5 [61]. Another type of RNase III in cytoplasm called Dicer recognizes pre-miRNAs and excises them into ~22 nucleotides of mature miRNA-miRNA* duplex. This dsRNA structure of mature miRNA is subsequently converted into single stranded mature miRNA after being loaded into Argonaute (AGO) protein by expelling single miRNA* strand [62, 63]. The interaction of miRNA-AGO
9
creates functional RNA-induced silencing complex (RISC) where it regulates gene expression
via direct binding to mRNA targets (Figure 1.2) [64].
Figure 1. 2. miRNA biogenesis pathway. The scheme shows miRNA synthesis process starting from its transcription in the nucleus until being translocated and becoming functional in the cytoplasm [64]. See copyright permission in Appendix Section.
10
The binding of miRNAs to their target mRNAs initiates destabilization of mRNA by inducing mRNA cleavage and later, impeding translation [65]. Particularly in animals, the interaction of miRNA to 3’-UTR of mRNA target occurs in the sequences near 5’ terminus of miRNA called “seed” sequence. This 6-8 nucleotide-long sequence is mostly conserved among different species and determines the range of miRNA targets. The principle of miRNA seed sequence leads to the understanding on how single miRNA is able to regulate various expressions of mRNA targets, and how single mRNA might be controlled by multiple miRNAs [66-68]. Moreover, the existence of seed sequence is useful to classify miRNAs in a family which at the same time, being exploited by many algorithms to predict hundreds of miRNA targets [67, 69].
Dysregulation of miRNA in cancer and miRNA as potential therapy
Considering the significant function of miRNAs in regulating gene expression, it is not surprising that many miRNAs are dysregulated in different types of cancer. The first report on miRNA dysregulation in cancer came from a study by Carlo Croce’s group in 2002. They identified that the deletions of miR-15 and miR-16 genes at 13q14 chromosome region were associated with the development of B-cell chronic lymphocytic leukemia (B-CLL) [70]. Later, miR-15 and miR-16 were shown to act as tumor suppressors by inhibiting the expression of an anti-apoptotic protein, Bcl-2 [71]. Over the following years, studies on tumorigenesis-linked miRNAs have been exponentially increasing thanks to the advanced miRNA profiling and sequencing technologies. miRNAs have been a major focus of cancer research due to their potential to be biomarkers for diagnosis, prognosis, and even as an alternative treatment option for many cancers.
11
Dysregulation of miRNAs in cancer occurs through different mechanisms including abnormalities in transcriptional control, chromosomal and epigenetic changes and failure in the miRNA biogenesis machinery [72]. Transcriptional control abnormalities could arise from the dysregulation of crucial transcription factors themselves, such as p53 or general transcription machinery. For instance, p53 can bind to the promoter of miR-34 family and induce their expression [73]. Interestingly, miR-34 can also induces p53 expression by targeting negative regulator of p53, SIRT1, providing a positive feedback loop [74]. Next, chromosomal and epigenetic changes on the genome including amplification, deletion and translocation of miRNA genes as well as aberration methylation of miRNA promoters could be some other factors dysregulating miRNA expression. Dysregulation of miR-15 and miR-16 in B-CLL as described above is an example of how deletion of miRNA gene alters healthy cells becoming cancerous. Conversely, oncogenic miR-17-92 cluster gene is often amplified in human lung cancer that subsequently promotes cell proliferation [75]. Meanwhile, the defects in the miRNA biogenesis machinery would also affect in the dysregulation of large fraction of miRNAs that might lead to the development of certain tumor. For example, mutations in DGCR8 and Drosha that are important for miRNA maturation has been identified in Wilms tumor and led to the decreased expression of tumor suppressor miRNAs, e.g. Let-7a and miR-200 family [76].
Many studies have explored miRNAs to be harnessed in clinical treatment for cancers due to their promising effect and minimum toxicity. The miRNA therapeutic strategy utilizes either miRNA-resembling oligonucleotides (miRNA mimics) or miRNA-targeting molecules (antimiRs) [77]. miR-16 mimics, for example, has been reported to enter Phase I clinical trials for malignant pleural mesothelioma and advanced non-small cell lung cancer [78, 79]. Another example is antimiR-10b, which was confirmed to decrease tumor growth in an orthotopic glioblastoma model and reduce metastasis in orthotopic breast cancer model [80, 81]. Perhaps,
12
the most advanced miRNA therapeutic strategy is pinned to miR-34 mimics that are delivered using nanoparticle carrier [82]. The liposome-encapsulated miR-34 mimics (MRX34) had been shown to significantly reduce non–small-cell lung cancer (NSCLC) tumor growth without generating immune response upon systemic delivery [83]. Therefore, lipid-based nanoparticle is often applied as delivery system for therapeutic miRNAs or other oligonucleotides due to its flexible modification and reduced potential in eliciting immune-rejection [82]. Importantly, the Food and Drug Administration (FDA) has recently approved liposome-based siRNA therapeutics, and considering the similar physicochemical properties and the requirement for RISC for their intracellular function for siRNAs and miRNAs [84], it may not be surprising to see the first miRNA-based therapeutics in clinics soon. Taken together, miRNA therapeutics with an efficient delivery method could be promising alternative treatments for combating cancer.
miRNA-mRNA interaction networks in cancer
Cancer is a complex disease that occurs due to aberrations in molecular interactions comprising pathway signaling, regulation of gene and cell metabolism [85, 86]. In tumorigenesis, for instance, healthy tissues undergo multiple steps of mutations in both coding and non-coding genome that influences different biological pathways before they display malignant phenotype [87, 88]. The cross-talks and feedback loops that often happen in cancer signaling also increase the complexity of this disease [85]. Importantly, the development of high-throughput sequencing technologies in the last two decades enables us to obtain a comprehensive –omics data from tissue samples [89]. Furthermore, the advancements in algorithm and mathematical modeling bridge the use of large data obtained from sequencing and to perform simulation on their dynamic molecular interactions [85]. As a result, the integrative analysis of biological
13
networks allows us to embrace the complexity of cancer and changes our view to cancer not only as a single gene- or protein-based disease, but also as a system biology-based disease [90]. This will eventually lead us to gather more knowledge in cancer biology and also better predictions for therapeutic strategies.
miRNA-mRNA interactions are essential in human transcriptome control where their dysregulation may result in cancer progression [91, 92]. However, as a single miRNA is predicted to target multiple mRNAs and conversely, single mRNA is predicted to be targeted by many miRNAs [66-68], it is necessary to apply system biology approaches to visualize this complexity and infer useful, testable hypotheses from the identified miRNA-mRNA interaction networks [93]. Such an approach has been utilized in many predictive studies. For example, analysis of miRNA-mRNA network has been useful to map oncogenic cellular pathways following the modulation of human papillomaviruses 16 (HPV16) oncoprotein in human foreskin keratinocytes [94]. Similar network analysis also has been applied to study the effect of metformin, a common drug for type II diabetes patients that also had been examined under Phase III clinical trial for breast cancer. Using miRNA-mRNA interaction network model, metformin was later known to regulate cell survival, cell cycle, and angiogenesis pathways in breast cancer [95].
In line with this, miRNA-mRNA interaction network analysis could be the state-of-art approach to comprehensively elucidate chemoresistance in TNBC whose cancer heterogeneity is high [12]. The result of this in silico analysis has the potential to provide preliminary data and testable hypotheses using in vitro and in vivo experimental models [96]. Finally, miRNA-mRNA network is useful not only to comprehend the biological process, but also to determine the driver genes of chemoresistance and direct the investigation for therapeutic strategy [93].
14 The rationale and the aims of the study
Chemotherapy resistance is a serious clinical problem in cancer, especially for those with limited therapy options e.g. TNBC patients. The development of resistance is molecularly orchestrated through the aberrations in both coding (mRNA) and non-coding genome (miRNAs, circular RNAs, long non-coding RNAs). Therefore, in this thesis, we aimed to elucidate the mechanism/s of chemotherapy resistance in TNBC by using in silico, in vitro, and
in vivo approaches, and target major alterations to overcome chemoresistance in TNBC. Our
study starts with establishing in vivo models representing chemo-sensitive and -resistant TNBC tumors, then to apply tumor-derived transcriptomics data to build a miRNA-mRNA network, and to validate the molecular mechanisms/interactions on the network through cutting-edge in
vitro and in vivo experiments.
Our aims in this thesis are as following:
- To build the first miRNA-mRNA interaction network of chemoresistance in TNBC - To discover novel molecular mechanisms of chemotherapy resistance in TNBCs
involving miRNAs, proteins and their interactions.
- To validate the role of identified miRNAs and their target proteins using in vitro and in
15
Chapter 2
Materials
2.1. Buffers
1x Anode Buffer I 300 mM Tris, 20% (v/v) methanol 1x Anode Buffer II 25 mM Tris, 20% (v/v) methanol
1x Cathode Buffer 40 mM 6-aminocaparoic acid, 20% (v/v) methanol
1x PBS 137 mM NaCl, 2.7 mM KCl, 10 mM Na2HPO4, 2 mM KH2PO4 (pH: 7.4)
1x SDS-PAGE Running Buffer 25 mM Tris, 14.41 g/l glycine, 1% (v/v) SDS
1x TAE 40 mM Tris, 20 mM acetic acid, 1 mM EDTA
1x TBST 20 nM Tris, 8 g/l NaCl 0.2% (v/v) Tween20
RIPA lysis buffer 150 mM NaCl, 1% (v/v) NP-40, 0.5% (v/v) Sodium DOC, 50 mM Tris-HCl (pH:8.0), 50 mM NAF, 1 mM NAVO4, 4% (v/v) Protease inhibitor, 4% (v/v) Phosphatase inhibitor
2.2. Chemicals and reagents
4x Protein Loading Dye 250 mM Tris HCl (pH:6.8), 10% (w/v) SDS, 0.1% (w/v) Bromophenol blue, 50% Glycerol (v/v), 25% (v/v) β-mercaptoethanol
6-aminocaparoic acid Sigma Aldrich, St Louis, MO, USA
6x DNA loading Dye Thermo Fisher Scientific, Waltham, MA, USA
Acetic acid Sigma Aldrich, St Louis, MO, USA
16
Agar Sigma Aldrich, St Louis, MO, USA
Agarose Promega, Madison, WI, USA
Ammonium peroxisulfate Carlo Erba, Cornaredu, Italy Bovine Serum Albumin Santa Cruz, Dallas, TX, USA
Protease inhibitor cocktail Roche Applied Science, Mannheim, Germany D-Luciferin Potassium salt Sigma Aldrich, St Louis, MO, USA
dNTPs Thermo Fisher Scientific, Waltham, MA, USA
ECL Amersham Pharmacia Biotech, Amersham, UK
Ethanol Sigma Aldrich, St Louis, MO, USA
Ethidium Bromide Thermo Fisher Scientific, Waltham, MA, USA Gene Ruler 100bp DNA Ladder New England Biolabs, Ipswich, MA, USA Gene Ruler 1kb DNA Ladder New England Biolabs, Ipswich, MA, USA Isoflurane Piramal Critical Care, Bethlehem, PA, USA
Isopropanol Sigma Aldrich, St Louis, MO, USA
LightCycler 480 SYBR Green I Master Roche Applied Science, Mannheim, Germany Lipofectamine 2000 Invitrogen, Carlsbad, CA, USA
Methanol Sigma Aldrich, St Louis, MO, USA
Milk powder Sigma Aldrich, St Louis, MO, USA
Nuclease free water Applied Biosystems/Ambion, Austin, TX, USA Page Ruler Protein Ladder Thermo Fisher Scientific, Waltham, MA, USA
PhosSTOP Roche Applied Science, Mannheim, Germany
Ponceau S Sigma Aldrich, St Louis, MO, USA
Shandon Immu-mount Thermo Fisher Scientific, Waltham, MA, USA
17
Sodium Dodecyl Sulfate (SDS) Merck, Darmstadt, Germany
TEMED Serva, Heidelberg, Germany
TRIsure Bioline, Luckenwalde, Germany
Triton X-100 Sigma Aldrich, St Louis, MO, USA
Trizma base Sigma Aldrich, St Louis, MO, USA
Trypton Sigma Aldrich, St Louis, MO, USA
Tween-20 VWR, Radnor,PA, USA
Yeast Extract Sigma Aldrich, St Louis, MO, USA
2.3. Enzymes and enzyme buffers
10X Cut Smart Buffer New England Biolabs, Ipswich, MA, USA 10X T4 DNA ligase Buffer Thermo Fisher Scientific, Waltham, MA, USA Not1 Restriction enzyme New England Biolabs, Ipswich, MA, USA Phusion Polymerase New England Biolabs, Ipswich, MA, USA T4 DNA Ligase Thermo Fisher Scientific, Waltham, MA, USA T4 Kinase Thermo Fisher Scientific, Waltham, MA, USA TaqMan ABgene universal mix Thermo Fisher Scientific, Waltham, MA, USA XhoI Restriction enzyme New England Biolabs, Ipswich, MA, USA
2.4. Media and supplements
DMEM (Phenol Red, Low Glucose) Lonza, Basel, Switzerland Fetal bovine serum (FBS) Biowest, Nuaille, France
18
LB Agar 1.5% (w/v) agar, 10 g/l tryptone, 5 g/l yeast extract, 10 g/l NaCl
LB Broth 10 g/l tryptone, 5 g/l yeast extract, 10 g/l NaCl
Matrigel BD, Franklin Lakes, NJ, USA
Non-essential amino acids Lonza, Basel, Switzerland
OptiMEM Invitrogen, Carlsbad, CA, USA
Penicillin/streptomycin Lonza, Basel, Switzerland
2.5. Kits
BCA Protein Assay Kit Pierce, Rockford, IL, USA Cell Titer-Glo cell viability assay kit Promega, Madison, WI, USA MycoAlert detection kit Lonza, Basel, Switzerland
Trans-lentiviral packaging kit Dharmacon, Lafayette, Colorado, USA Dual luciferase reporter kit Promega, Madison, WI, USA
First strand cDNA synthesis kit Thermo Fisher Scientific, Waltham, MA, USA Gel and PCR clean up kit MN, Duren, Germany
Plasmid isolation kit MN, Duren, Germany Plasmid Maxi kit Qiagen, Hilden, Germany
TaqMan miRNA Assays Applied Biosystems, Foster City, CA, USA
2.6. Equipment
AxioVision 4.3 microscopy Carl Zeiss, Munich, Germany
Amersham Imager 600 GE Healthcare, Chicago, Illinois, USA
Centrifuges Thermo Fisher Scientific, Waltham, MA, USA Beckman, Pasadena, CA, USA
19
Cell culture hood Nüve, Ankara, Turkey Cell culture incubator Nüve, Ankara, Turkey
Counting chamber Marienfeld, Königshofen, Germany Freezer (-80) Hettich, Geldermansen, Holland
Freezer (-20) Bosch, Stuttgart, Germany
Fridge Bosch, Stuttgart, Germany
Horizontal Shakers Bellco, Vineland, NJ, USA
Hypoxia Chamber StemCell Technologies, Vancouver, Canada LightCycler 96 Roche Applied Science, Mannheim, Germany Mini-PROTEAN Gel casting module Bio-Rad, Hercules, CA, USA
Mini-PROTEAN Tetra Cell Bio-Rad, Hercules, CA, USA
Multichannel Pipette Thermo Fisher Scientific, Waltham, MA, USA Nanodrop 1000 Thermo Fisher Scientific, Waltham, MA, USA Nikon TS300 Inverted microscope Nikon, Tokyo, Japan
Thermocycler Thermo Fisher Scientific, Waltham, MA, USA Power supplies for electrophoresis Bio-Rad, Hercules, CA, USA
Semidry western blot transfer unit Bio-Rad, Hercules, CA, USA Synergy HT Microplate Reader BioTek, Winooski, VT, USA
UV-Reader Vilber Lourmat, Eberhardzell, Germany
Vortex Isolab, Wertheim, Germany
Water bath Nüve, Ankara, Turkey
X-ray cassette Amersham Pharmacia Biotech, Amersham, UK X-ray hyper processor Amersham Pharmacia Biotech, Amersham, UK
20
100mm dishes Greiner bio-one, Frickenhausen, Germany 145mm dishes Greiner bio-one, Frickenhausen, Germany 96-well plates Greiner bio-one, Frickenhausen, Germany 6-well plates Greiner bio-one, Frickenhausen, Germany Filtered pipette tips (10 µl, 20 µl, 200
µl, 1000 µl) Greiner bio-one, Frickenhausen, Germany Cell scrapers Greiner bio-one, Frickenhausen, Germany
Coverslips Marienfeld, Königshofen, Germany
Cryovials Greiner bio-one, Frickenhausen, Germany
Microscope slides Marienfeld, Königshofen, Germany
Parafilm VWR, Radnor,PA, USA
PCR tubes Axygen, Corning, NY, USA
Plastic pipettes (5 ml, 10 ml, 25 ml) Corning Incorporated, Corning, NY, USA
PVDF Membrane Biorad, Hercules, CA, USA
Reaction tubes (500 µl, 1.5 ml, 2 ml) Axygen, Corning, NY, USA
Storage bottles (250 ml, 500 ml, 1 L) Corning Incorporated, Corning, NY, USA Whatmann paper GE Healthcare, Little Chalfont, UK
X-ray films Kodak, Rochester, NY, USA
Cuvettes VWR, Radnor, PA, USA
qPCR Plates Roche Applied Science, Mannheim, Germany
21
Chapter 3
Methods
3.1. In vitro experiment
3.1.1. Culturing human breast cancer cell lines
Human breast cancer cell line MDA-MB-231 was obtained from ATCC (Manassas, VA, USA) whereas MDA-MB-231.Luc2.GFP (shortly 231.Luc2.GFP), a modified and labeled version of MDA-MB-231, was a kind gift from Dr. Dihua Yu (MD Anderson Cancer Center, Houston, TX, USA). Both cells were cultured in Dulbecco Modified Eagle Medium (DMEM) supplemented with 50 U/ml penicillin/streptomycin, 1% non-essential amino acids and 10% fetal bovine serum (FBS). Mycoplasma contamination test was performed regularly using MycoAlert mycoplasma detection kit (Lonza, Basel, Switzerland).
3.1.2. Cell seeding on fibronectin-coated well
The concentration of fibronectin (Sigma Aldrich, St Louis, MO, USA) was adjusted to 20 µg/mL in PBS and as much as 50 µL or 500 µL were added to 96 or 6-well plates, respectively. Plates were incubated in 4° C overnight and then washed once with PBS. Then, 7000 cells/well of 96-well plate or 200.000 cells/well of 6-well plate were seeded on top of fibronectin-coated well within 80 µL or 1500 µL of 2% bovine serum albumin (BSA) containing DMEM for 96-well or 6-96-well plate, respectively.
3.1.3. Transient transfection using miRNA mimics, siRNAs and reporter constructs Lipofectamine-2000 (Invitrogen, Carlsbad, CA, USA) and OptiMEM were used for transient transfection that is conducted around 12 hours after cell seeding on fibronectin-coated well. For
22
one well of 96-well plate, miRNA mimics and siRNAs were transfected at concentration of 40 nM and 20 nM, respectively, which were diluted in 20 µL OptiMEM to make mix A. Mix B was prepared by adding 0.2 µL of Lipofectamine to 20 µL OptiMEM. Each mixture was vortexed for 10 seconds and incubated at room temperature for 5 minutes, then both vials were mixed in 1:1 (v/v) ratio and vortexed again for 20 seconds followed by incubation for 20 minutes at room temperature. 40 µL of the final mixture was added on top of the seeded cells. The plates were incubated at 37° C, 5% CO2 for further treatments or experiments.
For one well of 6-well plate, mix A was prepared using 40 nM miRNAs or 20 nM siRNAs that were diluted in 250 µL OptiMEM. At the same time, 2 µL lipofectamine was added to 250µL OptiMEM to make mix B. Both vials were vortexed, mixed and incubated similar to that of 96-well format. Finally, 500 µL of transfection mixture were added on top of cells in 6-96-well plate.
Reporter construct carrying 3’ UTR of human ITGA5 was co-transfected with miRNA mimics on top of cells grown in 96-well plate. For one well, 50 ng of reporter construct and 20 nM of miRNA mimics were dissolved in OptiMEM and mixed with lipofectamine similar to of the protocol for single miRNA mimics transfection in 96-well plate format.
3.1.4. Construction of 3’-UTR plasmid
The 3’-UTR sequence of ITGA5 harboring binding sites for miR-326 was amplified from genomic DNA of MDA-MB-231 cells using primers shown in Table 3.1.
23 Table 3. 1. Primer sequences for 3’-UTR cloning
Gene Symbol Gene ID Direction Primer
ITGA5 3678
Forward 5’-ccgctcgagcccaatttcagactcccattcctg-3’ Reverse 5’-atttgcggccgcgttctggtcagtgggggcac-3’
psiCHECKTM-2 plasmid was used for reporter vector, and this plasmid together with 3’-UTR amplicons were double digested with XhoI and NotI restriction enzymes using protocol described in Table 3.2. Double digestion reaction was conducted at 37° C for 1.5 hours followed by inactivating enzyme at 65° C for 10 minutes.
Table 3. 2. Double digestion protocol
Name Concentration/Volume
DNA 2 µg (X µL)
XhoI 1.25 µL
NotI 1.25 µL
Cut Smart Buffer 10 µL Nuclease-free H2O (37.5-X) µL
Ligation of digested vector and insert was performed using protocol shown in Table 3.3 at 22°C for 1 hour. Vector and insert concentration were calculated as follows:
24 Table 3. 3. Ligation reaction Protocol
Name Concentration/Volume
T4 DNA Ligase 1 µL
T4 DNA Ligase Buffer (10X) 2 µL
psiCHECKTM-2 (double digested vector) 50 ng Insert DNA (double digested 3’-UTR
amplicon)
50 ng
Nuclease-free H2O up to 20 µL
Following ligation, 10 µL ligation product was transformed into DH5α bacteria strain through heat shock treatment at 42° C for 45 seconds. 1 mL of LB media was added to transformed bacteria and incubated at 37° C on shaker for 45 minutes. The transformed bacteria were then selectively cultured by spreading onto LB agar plates containing 500 µg/mL Ampicillin and incubated at 37° C overnight. Next day, viable colonies from each transformation were picked and amplified in 5 mL LB media at 37° C shaker overnight. To clarify the construct sequence, restriction digestion reaction was carried out using the same protocol described in Table 3.2. The bacteria were grown to amplify the vectors in 100-200 mL LB culture. Maxi-prep isolation kit was used to isolate vectors which were subsequently sent for sequencing using psiCHECKTM-2 universal sequencing primers. psiCHECKTM-2_Rluc_Forward: 5’-cgtccagatgaaatgggtaag-3’; psiCHECKTM-2_Reverse: 5’-cgaggtccgaagactcattt-3’.
3.1.5. Dual luciferase reporter assay
MDA-MB-231 cells were seeded into 96-well plate with the concentration of 5000 cells/ well and transfected with reporter construct as well as miRNA mimics as described in Section 3.1.3. 60 µL of 1X passive lysis buffer was added to lyse the cells and followed by incubation on
25
shaker at room temperature for 15 minutes to enhance the cell lysis. The lysate from each well was then transferred to 96-well opaque white plates. 40 µL of reagent I was added and measured with Synergy HT microplate reader (Biotek, Winooski, VT, USA) to measure firefly luciferase activity. After addition of reagent II, renilla luciferase activity was measured. The data was normalized by taking the ratio of renilla luciferase activity over firefly luciferase activity.
3.1.6. Doxorubicin treatment and cell viability assays
Doxorubicin treatment was carried out 12 hours after miRNA mimics or siRNA transfection according to the designated doses. In case of experiments without transfection, drug was given 24 hours after cell seeding. Doxorubicin was added on top of cells in 40 µL and 200 µL media into 96-well plate and 6-well plate, respectively. Cell viability assay was performed with Cell Titer-Glo cell viability assay kit (Promega, Madison, WI, USA) at 48 hours post-drug treatment. Before starting the experiments using Cell Titer-Glo, both reagent and cells containing 96-well plate were incubated for 30 minutes at room temperature. Then, 30 µL of Cell Titer-Glo reagent was added to each well of 96-well plate and incubated for 10 minutes on shaker at room temperature. The lysate from each well was transferred to corresponding well of 96-well opaque white plate, and luminescence signal was measured via Synergy HT microplate reader (Biotek, Winooski, VT, USA).
3.1.7. Hypoxia assay
MDA-MB-231 cells were seeded into 6-well plate and incubated at 37° C in normoxic condition overnight. Next day, plates were transferred into Hypoxia Incubator Chamber (StemCell Technologies, Vancouver, Canada) with 1% oxygen, 5% CO2, and 94% nitrogen at 37° C. At certain time points, cells were harvested by trypsinization and proceeded for RNA isolation.
26
3.1.8. Quantitative Real-Time Polymerase Chain Reaction (qRT-PCR) 3.1.8.1. RNA isolation
Cells were seeded in 6-well plates followed by transfection and/or drug treatment as described in Section 3.1.3 and 3.1.6. Then, medium was removed, cells were washed with 1X PBS and collected through trypsinization into 1.5 mL reaction tube. TRIsure (Bioline, Luckenwalde, Germany) reagent was used to perform RNA isolation according to the manufacturer’s protocol. RNA isolation from tumors was performed by putting tumor fragments into 1.5 mL reaction tubes and homogenization in TRIsure. After homogenization, the same protocol was used for tumors as well.
3.1.8.2. Reverse Transcription for mRNA
cDNA was generated from 2 µg of total RNA for each sample using RevertAid RT Reverse Transcription kit (Thermo Fisher Scientific, Waltham, MA, USA) according to the manufacturer’s instructions as summarized in Table 3.4. The reaction was carried out in thermocycler using the program provided in Table 3.5. Then, cDNA samples were diluted to 1:20 and proceeded with qRT-PCR experiments.
Table 3. 4. Protocol for reverse transcription reaction
Reagent Concentration/Volume
RNA 2 µg (X µL)
Oligo-dT 1 µL
RevertAid reaction buffer 4 µL Ribolock Ribonuclease Inhibitor 1 µL
27
dNTPs (10mM) 2 µL
RevertAid H Minus M-MuL V RT 1 µL
Nuclease-free H2O up to 20 µL
Table 3. 5. Thermocycler program for reverse transcription reaction
Temperature Time
37˚ C 5 minutes
42˚ C 60 minutes
70˚ C 10 minutes
4˚ C ∞
3.1.8.3. qRT-PCR for mRNA quantification
qRT-PCR was performed in 96-well plates. Master mix was prepared as described in Table 3.6 using the primer pair for each gene of interest that listed in Table 3.7.
Table 3. 6. Master mix composition used for qRT-PCR reaction
Reagent Volume
SYBR Green 5 µL
Forward Primer (20 µM) 0.25 µL
Reverse Primer (20 µM) 0.25 µL
28
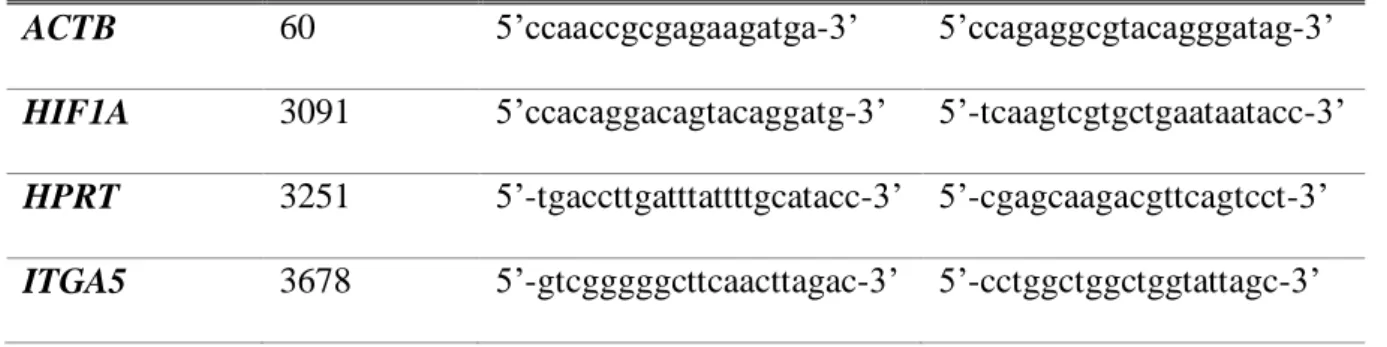
Table 3. 7. Sequences of forward and reverse primers used for qRT-PCR reaction Gene Symbol Gene ID Forward Primer Reverse Primer
ACTB 60 5’ccaaccgcgagaagatga-3’ 5’ccagaggcgtacagggatag-3’
HIF1A 3091 5’ccacaggacagtacaggatg-3’ 5’-tcaagtcgtgctgaataatacc-3’
HPRT 3251 5’-tgaccttgatttattttgcatacc-3’ 5’-cgagcaagacgttcagtcct-3’
ITGA5 3678 5’-gtcgggggcttcaacttagac-3’ 5’-cctggctggctggtattagc-3’
First, 8 µL of the master mix was added to each well, and then 2 µL cDNA (20 ng) (see Section 3.1.8.2) was added on top of the master mix. The plate was sealed, centrifuged at 1000 rpm for 2 minutes, and placed into LightCycler 96 qRT-PCR Thermocycler (Roche Applied Science, Mannheim, Germany). The program details of thermocycler are provided in Table 3.8.
Table 3. 8. Thermocycler program used for qRT-PCR Pre-incubation Target (oC) Acquisition Mode Hold (hh:mm:ss) Ramp Rate (oC) Acquisition (peroC) Sec Target (oC) Step Size (oC) Step Delay (cycles) 95 None 00:05:00 4.4 5 0 0 0 Amplification Target (oC) Acquisition Mode Hold (hh:mm:ss) Ramp Rate (oC) Acquisition (peroC) Sec Target (oC) Step Size (oC) Step Delay (cycles) 95 None 00:00:10 4.4 5 0 0 0 58 Single 00:00:20 2.2 5 0 0 0 72 None 00:00:20 4.4 5 0 0 0
29 Melting Curve Target (oC) Acquisition Mode Hold (hh:mm:ss) Ramp Rate (oC) Acquisition (peroC) Sec Target (oC) Step Size (oC) Step Delay (cycles) 95 None 00:00:05 4.4 5 0 0 0 55 None 00:01:00 2.2 5 0 0 0 95 Continuous 00:00:00 0.11 5 0 0 0 Cooling Target (oC) Acquisition Mode Hold (hh:mm:ss) Ramp Rate (oC) Acquisition (peroC) Sec Target (oC) Step Size (oC) Step Delay (cycles) 40 None 00:00:30 2.2 5 0 0 0
3.1.8.4. Reverse transcription for miRNAs
cDNA synthesis of miRNAs was done using Taqman miRNA Assays (Foster City, CA, USA). Master mix and miRNA reverse transcription reaction were prepared according to the manufacturer’s protocol as described in Table 3.9 and Table 3.10, respectively.
Table 3. 9. Protocol for Taqman miRNA reverse transcription reaction
Reagent Volume
RNA 5 µL (10 ng)
dNTPs (100 nM) 0.15 µL
MultiScribe TM Reverse Transcriptase (50 U/µL) 0.25 µL
30
RNase Inhibitor (20 U/µL) 0.19 µL
5X Taqman RT primer 3 µL
Nuclease-free H2O 4.91 µL
Total 15 µL
Table 3. 10. Thermocycler program for Taqman miRNA reverse transcription
Temperature Time
16oC 30 minutes
42oC 30 minutes
85oC 5 minutes
4oC ∞
3.1.8.5. qRT-PCR for miRNA quantification
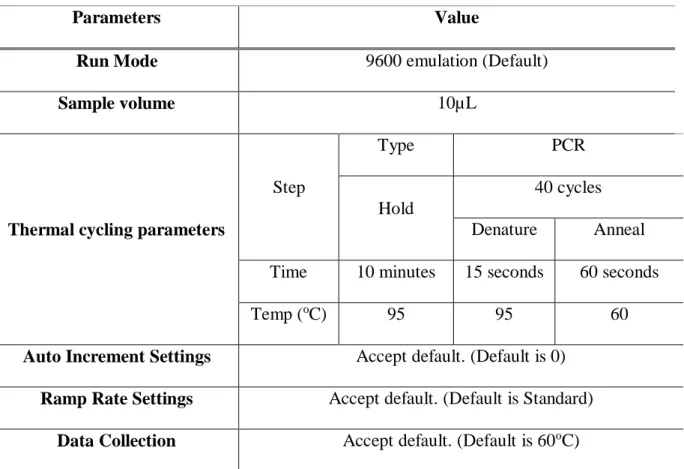
miRNA quantification was done using qRT-PCR with Taqman miRNA assays (Foster City, CA, USA) in 96-well plate. For each well, reaction mix was prepared as described in Table 3.11 and distributed to each well, followed by the addition of 1.33 µL cDNA prepared in Section 3.1.8.4. The plate was sealed and centrifuged at 1000 rpm for 2 minutes. Then, it was placed into LightCycler 96 qRT-PCR Thermocycler (Roche Applied Science, Mannheim, Germany) and run using program described in Table 3.12.
Table 3. 11. Taqman miRNA qRT-PCR master mix
Reagent Volume
31
20X Taqman microRNA assay mix 0.5 µL
Nuclease-free H2O 3.17 µL
Total 8.67 µL
Table 3. 12. Program for Taqman miRNA qRT-PCR amplification
Parameters Value
Run Mode 9600 emulation (Default)
Sample volume 10µL
Thermal cycling parameters
Step
Type PCR
Hold
40 cycles Denature Anneal Time 10 minutes 15 seconds 60 seconds
Temp (oC) 95 95 60
Auto Increment Settings Accept default. (Default is 0) Ramp Rate Settings Accept default. (Default is Standard)
Data Collection Accept default. (Default is 60oC)
3.1.9. Protein Biochemistry 3.1.9.1. Protein Isolation
Cells were seeded in 6-well plates followed by transfection and/or drug treatment as described in Section 3.1.3 and 3.1.6. Then, medium was collected in 1.5 mL Eppendorf and centrifuged at 5000 rpm for 5 minutes to obtain the apoptotic bodies. Cells were then washed with 1X PBS and collected through either scrapping method (for blotting phospho-proteins) or trypsinization
![Figure 1. 2. miRNA biogenesis pathway. The scheme shows miRNA synthesis process starting from its transcription in the nucleus until being translocated and becoming functional in the cytoplasm [64]](https://thumb-eu.123doks.com/thumbv2/9libnet/5880408.121368/28.892.223.671.228.900/figure-biogenesis-synthesis-starting-transcription-translocated-functional-cytoplasm.webp)