IMPACT OF TECHNOLOGY DEVELOPMENT AREAS ON INNOVATION IN TURKEY
A Master’s Thesis by SALİHA TANRIVERDİ
Department of Economics İhsan Doğramacı Bilkent University
Ankara July 2014
IMPACT OF TECHNOLOGY DEVELOPMENT AREAS ON INNOVATION IN TURKEY
Graduate School of Economics and Social Sciences of
İhsan Doğramacı Bilkent University by SALİHA TANRIVERDİ
In Partial Fulfillment of the Requirements for the Degree of MASTER OF ARTS
in
THE DEPARTMENT OF ECONOMICS
İHSAN DOĞRAMACI BİLKENT UNIVERSITY ANKARA
I certify that I have read this thesis and have found that it is fully adequate, in scope and in quality, as a thesis for the degree of Master of Arts in Economics.
-‐-‐-‐-‐-‐-‐-‐-‐-‐-‐-‐-‐-‐-‐-‐-‐-‐-‐-‐-‐-‐-‐-‐-‐-‐-‐-‐-‐-‐-‐-‐-‐-‐ Assoc. Prof. Çağla Ökten Supervisor
I certify that I have read this thesis and have found that it is fully adequate, in scope and in quality, as a thesis for the degree of Master of Arts in Economics.
-‐-‐-‐-‐-‐-‐-‐-‐-‐-‐-‐-‐-‐-‐-‐-‐-‐-‐-‐-‐-‐-‐-‐-‐-‐-‐-‐-‐-‐-‐-‐-‐-‐ Asst. Prof. Banu Demir Pakel Examining Committee Member
I certify that I have read this thesis and have found that it is fully adequate, in scope and in quality, as a thesis for the degree of Master of Arts in Economics.
-‐-‐-‐-‐-‐-‐-‐-‐-‐-‐-‐-‐-‐-‐-‐-‐-‐-‐-‐-‐-‐-‐-‐-‐-‐-‐-‐-‐-‐-‐-‐-‐-‐ Asst. Prof. Nagihan Çömez Examining Committee Member
Approval of the Graduate School of Economics and Social Sciences
-‐-‐-‐-‐-‐-‐-‐-‐-‐-‐-‐-‐-‐-‐-‐-‐-‐-‐-‐-‐-‐-‐-‐-‐-‐-‐-‐-‐-‐-‐-‐-‐-‐ Prof. Dr. Erdal Erel
ABSTRACT
IMPACT OF TECHNOLOGY DEVELOPMENT AREAS ON INNOVATION IN TURKEY
Tanrıverdi, Saliha MA, Department of Economics Supervisor: Assoc. Prof. Çağla Ökten Co-‐ Supervisor: Asst. Prof. Banu Demir Pakel
July 2014
This study focuses on the impact of Technology Development Areas (TDAs) on innovation activity in Turkey. Importance of TDAs arises from their role in promoting innovation through encouraging creation and development of knowledge-‐based businesses. Also, TDA environment helps participating firms by enabling technology and knowledge transfer between firms in TDA and between firms and universities. These are the main reasons why TDAs have been a popular policy regulation for innovation. However, their impact on innovation has been a controversial research area that presents mixed
results. This study sheds more light on this issue by estimating the impact of being located in TDA on the innovation outcomes; completed Research and Development (R&D) projects, sold and developed products and registered patents by the firms. The estimations are based on the Turkish data for TDAs, which are taken from the “2012 Impact Evaluation Survey for Technology Development Areas” that is performed by Turkish Ministry of Science, Industry and Technology. This study is the first academic work that uses this survey. It is found that being in TDA increases the number of completed R&D projects by 0.16-‐0.4 units. TDAs have a negative and insignificant impact on number of sold R&D products and developed R&D products of firms. The analysis shows that being in TDA decreases the number of patents registered, by 0.1 units. TDAs have other incentives for the firms in terms of firm performance. I estimate the impact of being in TDA on firm performance using sales as a performance measure. Entering a TDA is found to decrease sales by 31%.
The first part of the study introduces TDAs and innovation, giving information about the importance of TDAs and innovation, institutional background on TDAs and TDA literature. Second part focuses on the data set used and how it is organized for this study. Third part presents the methodology and econometric framework. Fourth part presents the results. Fifth part is the discussion that lays out some problems with the data and the model, possible solutions and gives insight for further research. Sixth part concludes.
Keywords: Innovation, Research and Development, Technology Development
ÖZET
TÜRKİYEDE TEKNOLOJİ GELİŞTİRME BÖLGELERİNİN İNOVASYON ÜZERİNDEKİ ETKİSİ
Tanrıverdi, Saliha Yüksek Lisans, İktisat Bölümü Tez Yöneticisi: Doç. Dr. Çağla Ökten
Ortak Tez Yöneticisi: Yrd. Doç. Dr. Banu Demir Pakel
Temmuz 2014
Bu çalışma Teknoloji Geliştirme Bölgelerinin (TGB) inovasyon üzerindeki etkisini konu almaktadır. TGB’lerin önemi yaratıcılığı ve bilgi tabanlı işletmeleri desteklemelerinden kaynaklanmaktadır. Ayrıca TGB ortamı katılımcı firmaların kendi aralarında ve üniversitelerle, teknoloji ve bilgi transferinde bulunmalarını sağlar. Bu nedenle TGB’ler inovasyon için gerekli bir politika aracıdır. Fakat TGB’lerin inovasyon üzerindeki etkisi, istatistiksel olarak hem önemli, hem önemsiz, pozitif ve negatif bulgular ortaya koyan
tartışmalı bir araştırma konusu olmuştur. Bu çalışma TGB’de yer almanın inovasyon çıktıları; tamamlanmış Araştırma Geliştirme (ARGE) projeleri, geliştirilen ve satılan ARGE ürünleri ve tescil edilmiş patentler, üzerindeki etkisini hesaplayarak, Türkiye’de TGB’lerin inovasyona etkisi konusuna ışık tutmayı amaçlamaktadır. Hesaplamalar Bilim, Sanayi ve Teknoloji Bakanlığı tarafından yapılan “2012 yılı Teknoloji Geliştirme Bölgeleri Etki Değerlendirme Formu” verilerine dayanmaktadır. Bu çalışma bu veri setini kullanan ilk akademik çalışmadır. Sonuçlar, TGB’de yer almanın tamamlanmış ARGE projesi sayısını 0.16-‐0.4 arttırdığını göstermektedir. TGB’ler satılan ARGE ürünü sayısını ve geliştirilen ARGE ürünü sayısını negatif yönde etkilemiştir. Fakat bu etki istatistiksel olarak önemli değildir. Analiz sonucunda, TGB’lerin tescil edilen patent sayısına negatif etkisi kaydedilmiştir. TGB’ler firmalar üzerinde, firma performansı anlamında farklı faydalara de sahiptir. Çalışmada TGB’de yer almanın firma performansı üzerindeki etkisi firmaların yıllık ciroları üzerinden yapılmıştır. Sonuçlar TGB’de yer almanın firmanın cirosunu 31% azalttığını göstermektedir. Çalışmanın birinci bölümü TGB’ler ve inovasyon konusuna giriş yaparak TGB’lerin önemi, TGB konusunun kurumsal açıklaması ve TGB literatürünü anlatmaktadır. İkinci bölüm veri setini ve bu çalışmada nasıl kullanıldığını açıklar. Üçüncü bölümde metodoloji ve ekonometrik taslak anlatılmaktadır. Dördüncü bölüm hesaplama sonuçlarını gösterir. Beşinci bölümde veri ve modelle ilgili problemler ve olası çözümleri değerlendirilerek, gelecekte bu
alanda yapılabilecek çalışmalar için fikir verilmektedir. Altıncı bölüm sonuç bölümüdür.
Anahtar Kelimeler: İnovasyon, Araştırma ve Geliştirme, Teknoloji Geliştirme Bölgeleri
ACKNOWLEDGEMENTS
I would like to express my gratitude to my advisors Assoc. Prof. Çağla Ökten and Asst. Prof. Banu Demir Pakel for their support of my thesis study and research. Their guidance helped me through completing this thesis.
I thank my family, especially, my mother Güner and my husband Furkan for their support and love, and Ahmet Hamza for being with me all along the
TABLE OF CONTENTS
ABSTRACT………... iii
ÖZET………... vi
ACKNOWLEDGEMENTS……….. ix
TABLE OF CONTENTS……….. x
LIST OF TABLES………... xii
CHAPTER 1: INTRODUCTION………. 1
1.1. Technology Development Areas………. 4
1.2. Technology Development Areas in Turkey………... 4
1.3. Literature Review……… 6
CHAPTER 2: DATA………. 11
CHAPTER 3: METHODOLOGY………. 16
CHAPTER 4: RESULTS ……… 18
4.1. TDAs and Innovation Activity……….. 19
4.2. TDAs and Firm Performance……… 23
CHAPTER 5: DISCUSSION……….. 26
CHAPTER 6: CONCLUSION……… 30
APPENDIX:
ESTIMATIONS FOR FIRMS THAT HAVE AT LEAST 3 OBSERVATIONS… 35
LIST OF TABLES
1. Comparison of Means Before and After Entering TDA………... 15
2. Impact of TDAs on R&D Projects……….. 20
3. Impact of TDAs on Sold Products………. 20
4. Impact of TDAs on Developed Products……….. 21
5. Impact of TDAs on Patents Registered………. 22
6. Impact of TDAs on Patents Registered by Small Firms……….. 23
7. Impact of TDAs on Sales……… 24
8. Impact of TDAs on Sales of Firms with University Collaboration………… 25
A.1. Impact of TDAs on R&D Projects………. 35
A.2. Impact of TDAs on Sold Products……… 36
A.3. Impact of TDAs on Developed Products………. 37
A.4. Impact of TDAs on Patents Registered……… 38
A.5. Impact of TDAs on Patents Registered by Small Firms………. 39
A.6. Impact of TDAs on Sales……… 40
CHAPTER 1
INTRODUCTION
Innovation is one of the most important drivers of domestic and international competitiveness for firms and for a country as a whole. New products create new markets, and product development enables firms to become more competitive in their existing market. In order to keep their place in this competition, to grow bigger and achieve higher profits, firms should adopt a vision for creating new ideas and new products. However, gaining such a vision needs financial and structural support. This is why in many countries governments establish funds and mechanisms to promote innovation and R&D by introducing policies. Governments try to increase their expenditure on supporting R&D activities providing finances and infrastructure for firms to be able to create new products and technologies and develop new or existing projects.
In the last century, scientific and technological developments have taken place mostly in the United States. In 1999, R&D expenditures as a percentage of Gross Domestic Product (GDP) was 2.64% in the United States, and 1.84%
in the European Union (World Bank). The European Union decided to focus more on the importance of R&D and designed new policies to reinforce R&D and innovation under the name “Action Plan for Europe” (Czarnitzki, Hussinger, 2004). By 2009, R&D expenditure in The European Union has reached 2.21% of its GDP, getting closer to The United States’, which was 2.87% of its GDP in 2009 (World Bank). When we focus on Turkey, between years 1999 and 2009 share of R&D expenditure in Turkey’s GDP has almost doubled. It has increased from 0.47% to 0.85% of GDP (World Bank). However, Turkey still falls behind the developed countries in terms of R&D expenditure.
Similar to increasing R&D expenditure; capacity for innovation, quality of research institutions and scientists and procurement of technological products has been increasing. In order to boost R&D and innovation, Turkish government had adopted new policies towards promoting R&D investment through Ministry of Science, Industry and Technology, TUBITAK (Scientific and Technological Research Council of Turkey), Industry Chambers and Development Agencies. These policies were in the form of direct funding, tax incentives and insurance funds. One form of public funding is provided for the R&D centers and technology enterprises (Law 5746, 2008). Research done by industry-‐academia collaboration is funded through Ministry of Science, Technology and Industry, and TUBITAK. Research and innovation projects carried out by private firms (SMEs or larger firms) are also funded by TUBITAK (Law 5593, 2007). The law for Technology Development Areas
provides infrastructure and direct public funding to the manager firm, other participating firms in TDA and to the academic personnel working in TDA (Law 4691, 2001) (Online Reference 1).
These new policies were adaptations of the policies experienced in the world. However, international evaluations of these policies show controversial results. Researchers found both positive and insignificant effects. For the case of Turkey it is known that interest in R&D and innovation has increased in recent years. Turkish entrepreneurs start new R&D firms; firms expand their R&D centers, employ new R&D personnel and R&D investment has been growing (TUBITAK, Research and Development Activities Survey 2012, Online Reference 2). However, little economic evaluation has been done on the R&D and innovation promoting policies of Turkey. These positive results may be a consequence of spillover effects related to international changes in R&D behavior, or change in private sector’s tendencies about R&D. We still do not know how much of the changes in R&D outcomes of Turkey stem from new policies or if these policies had positive or negative results. In addition, impact of R&D policies on R&D and innovation outcomes such as new product creation, product development and patenting behavior of R&D firms is not evaluated econometrically.
1.1. Technology Development Areas
Technology Development Areas have been very popular, after the success of Silicon Valley. Since 1980s, many countries started to build TDAs in order to increase innovation activity, providing financial support, tax incentives and infrastructural mechanism for R&D firms and R&D collaboratios between these firms and universities. TDAs are the source of knowledge spillovers (Jaffe, 1989; Jaffe et al, 1993). They are the organizations that encourage innovation through creation and development of knowledge-‐based businesses and they give management support that promotes technology and knowledge transfer among the firms in TDA. They provide the base for job creation and catalyst for national and regional economic growth (Tamasy, 2007; Goldstein and Luger, 1990, 1992; Shearmur and Doloreux’s, 2000). Lowered costs and resource prices caused by the presence of multiple organizations and geographic closeness also makes TDAs attractive for firms (Henderson, 1986; Krugman, 1991).
1.2. Technology Development Areas in Turkey
Turkey had its first TDA; TUBITAK Marmara Research Center (MAM), developed from Marmara Research Institute, in 1991 by the initiative of UN Funds for Science and Technology and the Turkish Government. The purpose
for establishing TDAs was to let entrepreneurs and researchers develop new and higher technologies, in contact with universities and academicians, thus, to have the R&D products become an economic value for the developing firms and for the country.
Turkey has legislated the law for Technology Development Areas (Law 4691) in 2001 and the law for revising the Technology Development Areas Law (Law 6170) in 2011. These laws regulate the establishment and management of TDAs.
Ministry of Science, Industry and Technology organizes the establishment of TDAs. A TDA’s Founders’ Committee, which needs to have at least one member representing a university, high technology institute or public R&D center inhabiting in the city of TDA, submits an application for TDA establishment to the ministry. An Assessment Committee is formed by delegates from Ministry of Science, Industry and Technology, Ministry of Finance, Ministry of Public Works and Settlement, State Planning Organization (DPT), High Education Board (YÖK), TÜBİTAK, and The Union of Chambers and Exchange Commodities (TOBB). By the approval of the Assessment Committee, Council of Ministers decides for the establishment of the TDA. Application requirements are available through Ministry of Science, Industry and Technology webpage (Online Reference 3). Turkey now has 52 active TDAs.
A TDA is managed by a Manager Firm. Similar to the Founders’ Committee, Manager Firm needs to have at least one member representing a university, high technology institute or public R&D center inhabiting in the city of TDA. The firm is responsible for the planning and management of projects, infrastructure and superstructure services, establishment of incubation center and technology transfer offices. The firm needs to perform all responsibilities according to the laws and regulations for TDAs.
TDAs and inhabiting firms have some advantages in terms of tax exemptions and public support. These advantages make TDAs more attractive for the firms and researchers:
• Ministry of Science, Industry and Technology has some limited budget for each new established TDA in order to support the establishment and management expenditures done by the Manager Firm.
• The Manager Firm and inhabiting firms are exempted from corporate and income taxes over the revenue from the R&D activities and developed products until the end of 2023.
• R&D and support personnel are also exempted from all taxes related to their income from the TDA work until the end of 2023.
1.3. Literature Review
Descriptive studies of survey data provide broad propositions, which were supported or not. Econometric studies of public or survey data provide specific hypotheses, which are tested statistically.
There exist five strands of literature on TDAs (Link and Scott, 2007). Main topics for these studies focus on:
• Factors affecting firm decisions to locate on a TDA (Westhead and Batstone, 1998; Goldstein and Luger, 1992; Hansson et al, 2005; Leyden et al, 2008)
• Formation of a TDA and university performance (Link and Scott, 2003)
• Growth of TDAs (Link and Scott, 2003)
• TDAs and regional economic development (Goldstein and Luger, 1990, 1992; Shearmur and Doloreux’s, 2000)
• Being located on a TDA and firm performance.
This study lies under the topic “location on a TDA and firm performance”. Magnitude of the impact of TDAs on the innovation outcomes is still not known. The questions that are not answered about Technology Development Areas are (Segal, Westhead, Wright, 2003):
• Do firms located on a TDA have higher research productivity than the firms not located on a TDA?
• Do the “returns” to location on a TDA vary according to the type of TDA (e.g., a university, science park)?
• How does activity on a university science park affect other dimensions of university technology transfer (e.g., licensing agreements and other university-‐based start-‐ups)?
I will focus on the impact of Technology Development Areas (TDAs) on innovation activity in Turkey. Location on a TDA is found to have certain results on business survival, job creation, R&D outputs and inputs, research productivity and firms’ performance. However, most of the studies could not reach significant differences between firms located and not located in a TDA. Descriptive studies on location on a TDA use UK data and Swedish data. Studies done by UK data found that sponsored park environments did not significantly increase the probability of business survival or enhance job creation. Also, results show a higher survival rate among science-‐park firms with a university relationship than firms without such a relationship (Westhead and Storey, 1994, 1997; Westhead and Cowling, 1995; Westhead et al, 1995). Westhead (1997) examines differences in outputs and inputs of firms located on TDAs and similar firms located off TDAs. In his study R&D outputs are listed as patents, copyrights, and new products or services. R&D inputs are percentage of scientists and engineers in total employment, the level and intensity of R&D expenditure. He has also reached no significant differences between the park and off-‐park firms.
Descriptive studies that use Swedish Data also found no significant differences between science-‐park and non-‐science-‐park firms. Lindelöf and Löfsten (2003, 2004) found insignificant differences between science-‐park
and non-‐science-‐park firms in terms of patenting and new products using match-‐pairs analysis. They state that science-‐park firms have different strategic motivations to be in a science-‐park such that innovative ability, sales growth, employment growth, market orientation and profitability. Ferguson and Olofsson (2004) have also found no significant differences between park and off-‐park firms in terms of sales or employment.
Econometric studies that focus on location on a TDA generally suffer from endogeneity problems. Siegel et al (2003) found that park firms have slightly higher research productivity than comparable off-‐park firms using UK data. They use negative binomial regression. The model for their analysis proposes that research output is a function of innovation capacity and being located on a science park. Research output is a vector of alternative innovation-‐ and research-‐related output measures such as number of new products and services, number of patents and number of copyrights. Innovation capacity is measured by internal capabilities of the firm such as internal R&D expenditures and number of scientists/R&D personnel. Audretsch & Lehmann (2007) uses German data in order to analyze if closeness to universities, as in the case for TDAs, have any impact on firm performance. Their model proposes that firm performance, which is measured by annual profits drawn from German stock market data, is a function of distance to a university, university qualifications such as rank, number of students, number of graduates, articles and firm qualifications such as age and size. They found that firms closeness to universities and certain qualifications of
universities have no significant effects. However, interaction of closeness and university qualifications show significant effects on firm performance. They
CHAPTER 2
DATA
The data that will be used is from “2012 Impact Evaluation Survey for Technology Development Areas” conducted by Ministry of Science, Industry and Technology. Ministry has conducted the survey in 2013 among 1786 firms who are then located in a TDA. Data for the whole survey is not allowed for studies from outside the Ministry. However, the part of the data related to this research was given upon request. Survey has questions about firm characteristics such as;
• Date firm established • Date entered in TDA
• Firm’s center is located in TDA or not • Firm has a separate R&D center or not
• Nationality: domestic, foreign or foreign partnered • Foreign share
• Number of workers 3 years before entrance and for years 2010, 2011 and 2012 after entrance
• Number of R&D personnel 3 years before entrance and for years 2010, 2011 and 2012 after entrance
• Number of Academicians 3 years before entrance and for years 2010, 2011 and 2012 after entrance
• National and International Sales 3 years before entrance and for years 2010, 2011 and 2012 after entrance
The questions about innovation activity give the answers;
• Number of completed R&D projects 3 years before entrance and for years 2010, 2011 and 2012 after entrance
• Number of completed R&D projects with national or international financial support 3 years before entrance and for years 2010, 2011 and 2012 after entrance
• Number of completed R&D projects performed with university collaboration 3 years before entrance and for years 2010, 2011 and 2012 after entrance
• Number of developed and sold product, prototype or software 3 years before entrance and for years 2010, 2011 and 2012 after entrance
• Number of registered patents 3 years before entrance and for years 2010, 2011 and 2012 after entrance
Most of the questions in the survey ask for 3 years before and after entering TDA. Post-‐TDA part is only answered for the TDA branch of the firm. For a number of firms TDA branch is not the only branch. So, it is not possible to compare before entrance and after entrance data and reach a result for such firms. Therefore, in the analysis, only the firms who do not have branches and entered the TDA as a whole are used. Resulting data consist of a panel for 1009 firms and for 16 years (1997-‐2012).
TDA entrance dates are not identical for firms in the survey. Among these firms, the earliest entrant has entered a TDA in 2000 and the latest has entered in 2013, which is the year survey was conducted. Thus, for a firm who has entered a TDA in 2010, after entrance data are for 2010, 2011 and 2012 and before entrance data are for 2007, 2008, 2009. For a firm who has entered a TDA in 2002, after entrance data are for 2010, 2011 and 2012, as asked in the survey, and before entrance data are for 1999, 2000 and 2001. So, there are a lot of missing data for all the firms because the 6 data points of each firm are scattered over the period 1997-‐2012. In addition to these missing data points caused by the way the survey was asked, there are additional missing data points for some firms, either because the survey was not answered properly or because record keeping is not efficient for these firms. As a result, the panel is not balanced.
Expenditure and sales data were not inflation adjusted. Adjustment is performed by CPI inflation data for Turkey taken from OECD statistics, taking 2012 as base year.
Sales data are total of national and international sales. They were reported separately in the survey. International sales was reported in US Dollars (USD) as national sales was reported in Turkish Liras (TL). International sales is converted from USD to TL using the exchange rate data taken from Turkish Central Bank. The exchange rates used for conversion are December 31st buying rates for each year. Summation of international and national sales was done afterwards.
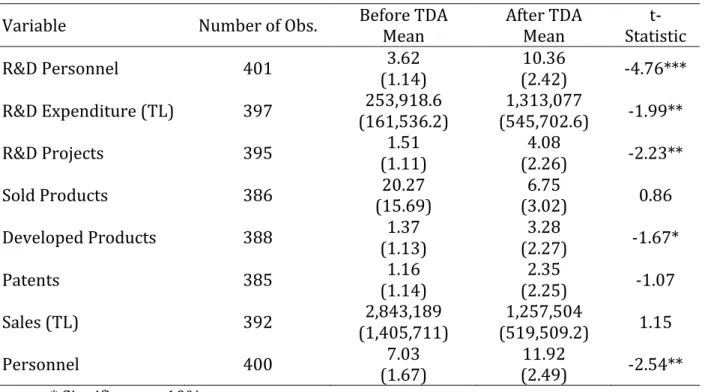
I will estimate the impact of being located in TDA on the innovation outcomes: completed R&D projects, sold and developed products and registered patents by the firms; and on firm performance measured by sales. The statistics given in Table 1 present relevant variables for the purpose of this study. The table shows the t-‐statistics for mean comparison of matched pairs. This is why number of observations drops from 1009 firms in the panel to about 400 firms for each variable, as some firms do not have data points for before entrance and some do not have data for after entrance.
Comparison of before TDA and after TDA means with the paired t-‐test indicate that number of R&D personnel and R&D expenditure; number of projects, developed products and personnel are significantly higher after entering TDA. We can also see an insignificant increase in patents. Number of sold products and sales are found to be decreasing but this decrease is also insignificant.
Table 1: Comparison of Means Before and After Entering TDA
Variable Number of Obs. Before TDA Mean After TDA Mean Statistic t-‐
R&D Personnel 401 (1.14) 3.62 (2.42) 10.36 -‐4.76*** R&D Expenditure (TL) 397 (161,536.2) 253,918.6 (545,702.6) 1,313,077 -‐1.99** R&D Projects 395 (1.11) 1.51 (2.26) 4.08 -‐2.23** Sold Products 386 (15.69) 20.27 (3.02) 6.75 0.86 Developed Products 388 (1.13) 1.37 (2.27) 3.28 -‐1.67* Patents 385 (1.14) 1.16 (2.25) 2.35 -‐1.07 Sales (TL) 392 (1,405,711) 2,843,189 (519,509.2) 1,257,504 1.15 Personnel 400 (1.67) 7.03 (2.49) 11.92 -‐2.54** * Significant at 10%. ** Significant at 5%. *** Significant at 1%.
CHAPTER 3
METHODOLOGY
This study empirically analyzes the impact of entering a TDA on the measures of innovation activity; number of completed R&D projects, number of products sold, number of end-‐user products developed and number of registered patents of the firm. I propose that innovation activity is a function of being in TDA and R&D inputs measured by R&D personnel and R&D expenditure; with firm specific aspects (Löfsten, Lindelöf, 2002; Segal, Westhead, Wright, 2003).
Innovation Activity = f (being in TDA, R&D inputs, firm fixed effects)
In order to see the impact of entering a TDA, OLS estimation techniques will be used.
The proposed model is:
!!" = !!!"# + !!!!"#$%&!"+ !!!
where yit is the innovation outcome of firm i at time t, that measures the
in TDA and 1 if the firm is in TDA, rdinput is the R&D personnel or R&D expenditure of firm i at time t, and ! is a vector of coefficients that measures the impact of firm fixed characteristics which are represented by f.
Sales may be another incentive for firms to be located in TDA (Leyden et al, 2008). In addition to Innovation Activity, I will also estimate a model for Firm Performance using “Total Sales” as a performance indicator. Then, yit will
CHAPTER 4
RESULTS
Comparison of means presented in Table 1 gives an idea about the impact of TDAs on innovation activity and firm performance. We can see positive and significant results for innovation activity. However, results for firm performance are positive but insignificant. This part of the study will present the analysis of the impact of TDAs by using panel data methods with firm and year fixed effects. I will first present the results of the proposed econometric model for Innovation Activity then for Firm Performance.
There is a concern that the impact of TDAs may not be measured, since the impact on firms that enter TDA and firms that have not, cannot actually be compared with the available data set. All the firms in this data set are the firms that enter a TDA. So, there will be selection bias in the estimations. Thus, I develop the analysis with an identification strategy through interaction variables. For the patenting behavior of the firms, literature states that small firms in TDAs will benefit more from knowledge spillovers and will be more successful in patenting (Acs et al, 1992). So, I introduce an
interaction variable for small firms in TDAs, in order to measure the impact of TDAs on innovation. For firm performance, literature states that R&D firms who collaborate with universities have higher sales of innovation products (Broström and Lööf, 2006). So, I introduce an interaction variable for TDA firms who engage in university collaboration, in order to measure the impact of TDAs on firm performance, here measured by sales.
4.1. TDAs and Innovation Activity
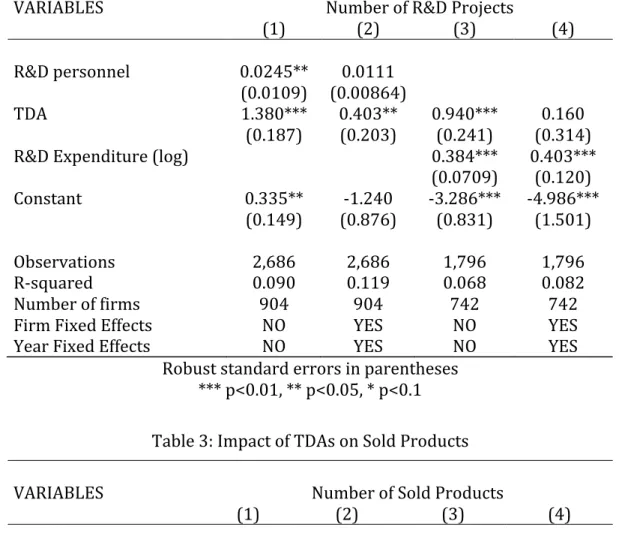
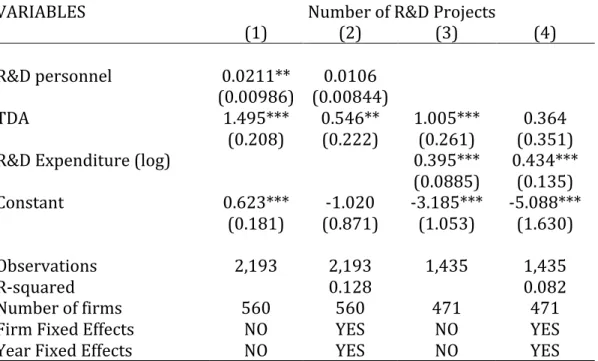
Firm and year specific effects are controlled for, using fixed effects regressions. R&D inputs; R&D personnel and R&D expenditure, are introduced in different models in order to see their effects on R&D outputs separately. This is the case for all the estimations throughout the study. Table 2 presents the regressions for the impact of TDAs on the number of completed R&D projects of firms. The coefficient of interest that measures the impact of TDAs is positive for all the regressions. Before TDA mean for the number of R&D projects is 1.5 and after TDA mean is 4. Here it can be seen that being in TDA increases the number of completed R&D projects by 0.4 in Regression (2) and by 0.16 in Regression (4). However, result for Regression (4) is insignificant. It can be said that being in TDA has a positive impact on R&D attempts of firms.
Table 2: Impact of TDAs on R&D Projects
VARIABLES Number of R&D Projects
(1) (2) (3) (4) R&D personnel 0.0245** 0.0111 (0.0109) (0.00864) TDA 1.380*** 0.403** 0.940*** 0.160 (0.187) (0.203) (0.241) (0.314)
R&D Expenditure (log) 0.384*** 0.403***
(0.0709) (0.120) Constant 0.335** -‐1.240 -‐3.286*** -‐4.986*** (0.149) (0.876) (0.831) (1.501) Observations 2,686 2,686 1,796 1,796 R-‐squared 0.090 0.119 0.068 0.082
Number of firms Firm Fixed Effects Year Fixed Effects
904 NO NO 904 YES YES 742 NO NO 742 YES YES Robust standard errors in parentheses
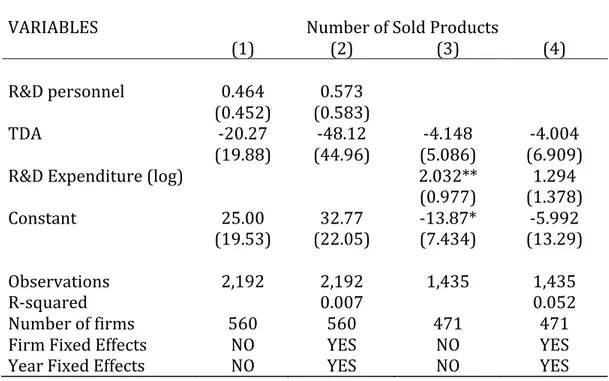
*** p<0.01, ** p<0.05, * p<0.1 Table 3: Impact of TDAs on Sold Products
VARIABLES Number of Sold Products
(1) (2) (3) (4) R&D personnel 0.432 0.566 (0.405) (0.575) TDA -‐20.17 -‐42.67 -‐2.604 -‐3.409 (19.68) (39.76) (4.944) (5.874)
R&D Expenditure (log) 1.569* 1.145
(0.912) (1.252) Constant 23.91 32.58 -‐9.651 -‐5.074 (18.88) (23.47) (7.436) (11.61) Observations 2,684 2,684 1,796 1,796 R-‐squared 0.003 0.006 0.002 0.052
Number of firms Firm Fixed Effects Year Fixed Effects
903 NO NO 903 YES YES 742 NO NO 742 YES YES Robust standard errors in parentheses
Table 2 presents the regressions for the impact of TDAs on the number of completed R&D projects of firms. The coefficient of interest that measures the impact of TDAs is positive for all the regressions. Before TDA mean for the number of R&D projects is 1.5 and after TDA mean is 4. Here it can be seen that being in TDA increases the number of completed R&D projects by 0.4 in Regression (2) and by 0.16 in Regression (4). However, result for Regression (4) is insignificant. It can be said that being in TDA has a positive impact on R&D attempts of firms.
Regressions on Table 3 shows that TDAs have a negative impact on number of sold R&D products of firms. However, this impact is insignificant. Before TDA mean is 20 and after TDA mean is 7 for the number of sold products.
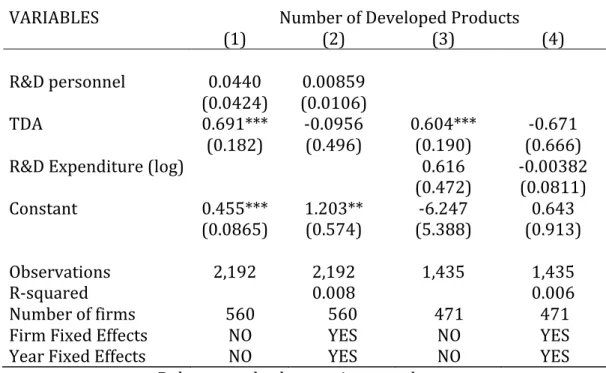
Table 4: Impact of TDAs on Developed Products
VARIABLES Number of Developed Products
(1) (2) (3) (4) R&D personnel 0.0466 0.00808 (0.0445) (0.0105) TDA 0.767*** -‐0.201 0.837*** -‐0.710 (0.158) (0.459) (0.256) (0.629)
R&D Expenditure (log) 0.560 -‐0.00119
(0.412) (0.0888) Constant 0.332*** 1.058* -‐5.771 0.451 (0.0923) (0.557) (4.757) (0.923) Observations 2,684 2,684 1,796 1,796 R-‐squared 0.009 0.007
Number of firms Firm Fixed Effects Year Fixed Effects
903 NO NO 903 YES YES 742 NO NO 742 YES YES Robust standard errors in parentheses
Comparison of means in Table 1 also shows an insignificant difference between before and after TDA means.
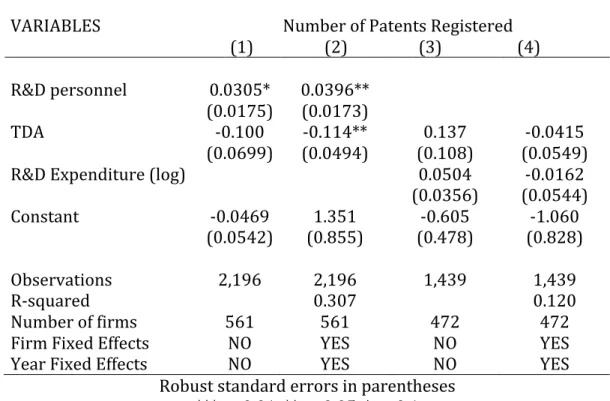
Table 5 presents the regressions for the impact of TDAs on registered patents of the firm. Regression (2) and Regression (4) shows that number of patents decrease by entering a TDA. Regression (4) gives an insignificant result. On Table 6, the results are shown for small firms in TDAs. Here small firms are identified as the firms that have lower than 50 employees1. According to Acs et al, small firms in TDAs will benefit more from knowledge spillovers and will be more successful in patenting (Acs et al, 1992). Results show that the negative impact of being in TDA is higher for large firms.
Table 5: Impact of TDAs on Patents Registered
VARIABLES Number of Patents Registered
(1) (2) (3) (4) R&D personnel 0.0277* 0.0394** (0.0167) (0.0173) TDA -‐0.0607 -‐0.106** 0.0573 -‐0.0410 (0.0514) (0.0445) (0.0406) (0.0473)
R&D Expenditure (log) 0.0551 -‐0.0163
(0.0416) (0.0485) Constant -‐0.0405 1.374 -‐0.592 -‐1.089 (0.0468) (0.863) (0.481) (0.867) Observations 2,689 2,689 1,801 1,801 R-‐squared 0.305 0.119
Number of firms 905 905 744 744
Firm Fixed Effects
Year Fixed Effects NO NO YES YES NO NO YES YES Robust standard errors in parentheses
*** p<0.01, ** p<0.05, * p<0.1
Table 6: Impact of TDAs on Patents Registered by Small Firms
VARIABLES Number of Patents Registered
(1) (2) (3) (4) R&D personnel 0.0344* 0.0409** (0.0196) (0.0173) Small Firm 0.383 -‐0.644 0.0954*** -‐2.341 (0.528) (0.470) (0.0366) (2.306) TDA -‐0.915 -‐1.049** 1.614 -‐0.596 (0.631) (0.515) (1.345) (1.633)
Small Firm × TDA 0.850 0.954* -‐1.595 0.587
(0.599) (0.504) (1.346) (1.643)
R&D Expenditure (log) 0.0243* -‐0.0201
(0.0144) (0.0487) Constant -‐0.439 1.997* -‐0.330* 1.808 (0.561) (1.188) (0.196) (2.117) Observations 2,689 2,689 1,792 1,792 R-‐squared 0.309 0.160
Number of firms 905 905 744 744
Firm Fixed Effects Year Fixed Effects
NO NO YES YES NO NO YES YES Robust standard errors in parentheses
*** p<0.01, ** p<0.05, * p<0.1
4.2. TDAs and Firm Performance
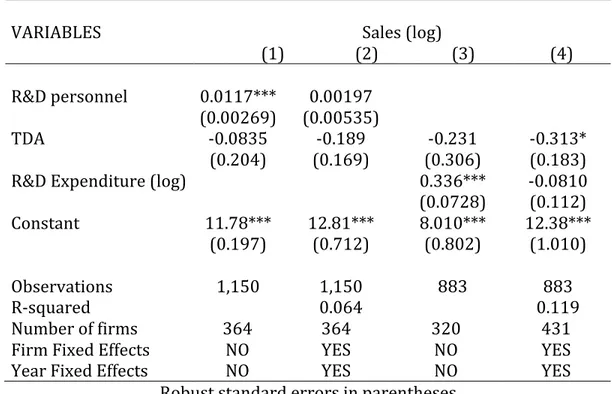
Leyden et al (2008) states that firms want to be in TDAs not only for engaging in innovation but also for some economic opportunities like increasing sales, firm size and profitability. In this part, the results for the impact of being in TDA on firm performance are presented. Firm performance is measured by annual sales. The regressions on Table 7 show that TDAs have a negative impact on sales when the firm and year fixed
effects are considered. Entering a TDA decreases sales by 21% according to Regression (2) and 32% according to Regression (4). Result for Regression (2) is insignificant.
Table 7: Impact of TDAs on Sales
VARIABLES Sales (log)
(1) (2) (3) (4) R&D personnel 0.0133*** 0.00241 (0.00324) (0.00520) TDA -‐0.159 -‐0.212 -‐0.270 -‐0.317* (0.202) (0.166) (0.307) (0.180)
R&D Expenditure (log) 0.346*** -‐0.0403
(0.0715) (0.109) Constant 11.48*** 12.61*** 7.656*** 11.77*** (0.194) (0.704) (0.765) (0.974) Observations 1,298 1,298 1,015 1,015 R-‐squared 0.063 0.115
Number of firms 485 485 431 431
Firm Fixed Effects
Year Fixed Effects NO NO YES YES NO NO YES YES Robust standard errors in parentheses
*** p<0.01, ** p<0.05, * p<0.1
Mansfield (1998) and Baise and Stahl (1999) finds that approximately 5 percent of new product sales could not have been developed without academic research. Lööf and Broström (2006) found that university collaboration positively influences innovation sales. Table 8 shows the regressions for the impact of being in TDAs on sales for the firms who collaborate with universities. Fixed effects regressions (2) and (4) shows contradicting but insignificant result for sales of such firms.
Table 8: Impact of TDAs on Sales of Firms with University Collaboration
VARIABLES Sales (log)
(1) (2) (3) (4) R&D personnel 0.0134*** 0.00239 (0.00330) (0.00514) University -‐0.0167 0.415 (0.381) (0.458) TDA -‐0.134 -‐0.226 -‐0.113 -‐0.284 (0.284) (0.222) (0.405) (0.183) University × TDA -‐0.0748 0.0307 -‐0.522 -‐0.0992 (0.355) (0.321) (0.478) (0.347)
R&D Expenditure (log) 0.345*** -‐0.0392
(0.0718) (0.109) Constant 11.50*** 12.62*** 7.540*** 11.77*** (0.266) (0.697) (0.782) (0.974) Observations 1,296 1,296 1,015 1,015 R-‐squared 0.063 0.115
Number of firms 484 484 431 431
Firm Fixed Effects Year Fixed Effects
NO NO YES YES NO NO YES YES Robust standard errors in parentheses
*** p<0.01, ** p<0.05, * p<0.1
CHAPTER 5
DISCUSSION
I measure the Innovation Activity by Number of Completed R&D Projects, Number of Sold and Developed R&D Products, and Number of Patents Registered. Number of Completed R&D Projects may not be a good measure for firm level innovation since R&D projects may be long-‐term projects. A firm may have started working on an R&D project long before it entered the TDA and completed it just after entering. Thus, it is hard to attribute the success of completing the project to firm’s being located in a TDA. However, data available does not allow for other specification for the number of projects. For instance if the survey has asked for the number of R&D projects initiated, it would have been a better measure for firms’ innovation activity in terms of its projects.
In the proposed model, the coefficient of interest is “!!” that determines the impact of being in TDA. Estimation of this coefficient may suffer from endogeneity bias since there may be selection into TDAs. Entering a TDA may require certain qualifications in terms of innovation activity or some more able firms may choose to enter TDAs. First of all, for the case of Turkish