OPTIMIZATION OF AN EDUCATIONAL
SEARCH ENGINE USING LEARNING TO
RANK ALGORITHMS
a thesis submitted to
the graduate school of engineering and science
of bilkent university
in partial fulfillment of the requirements for
the degree of
master of science
in
computer engineering
By
Arif Usta
September, 2015
Optimization of an Educational Search Engine Using Learning to Rank Algorithms
By Arif Usta September, 2015
We certify that we have read this thesis and that in our opinion it is fully adequate, in scope and in quality, as a thesis for the degree of Master of Science.
Prof. Dr. ¨Ozg¨ur Ulusoy(Advisor)
Prof. Dr. U˘gur G¨ud¨ukbay
Assist. Prof. Dr. ˙Ismail Seng¨or Altıng¨ovde
Approved for the Graduate School of Engineering and Science:
Prof. Dr. Levent Onural Director of the Graduate School
ABSTRACT
OPTIMIZATION OF AN EDUCATIONAL SEARCH
ENGINE USING LEARNING TO RANK ALGORITHMS
Arif Usta
M.S. in Computer Engineering Advisor: Prof. Dr. ¨Ozg¨ur Ulusoy
September, 2015
Web search is one of the most popular internet activities among users. Due to high usage of search engines, there are huge data available about history of user search issues. Using query logs as a source of implicit feedback, researchers can learn useful patterns about general search behaviors. We employ a detailed query log analysis provided by a commercial educational vertical search engine. We compare the results of our query log analysis with the general web search char-acteristics. Due to difference in terms of search behavior between web users and students, we propose an educational ranking model using learning to rank algo-rithms to better reflect the search habits of the students in the educational domain to further enhance the search engine performance. We introduce novel features best suited to the educational domain. We show that our model including edu-cational features outperforms two baseline models which are the original ranking of the commercial educational vertical search engine and the model constructed using the state of the art ranking functions, up to 14% and 11%, respectively. We also employ different learning to rank models for different clusters of queries and the results indicate that having models for each cluster of queries further enhances the performance of our proposed model. Specifically, the course of the query and the grade of the user issuing the query are good sources of feedback to have a better model in the educational domain. We propose a novel Propaga-tion Algorithm to be used for queries having lower frequencies where informaPropaga-tion derived from query logs is not enough to exploit. We report that our model con-structed using the features generated by our proposed algorithm performs better for singleton queries compared to both the educational learning to rank model we introduce and models learned with common features introduced in the literature.
Keywords: Information Retrieval, Web Search, Vertical Search Engine, Learning to Rank Algorithms, Educational Domain.
¨
OZET
SIRALAMA AMAC
¸ LI ¨
O ˘
GRENME ALGOR˙ITMALARI
KULLANARAK E ˘
G˙IT˙IM TABANLI ARAMA MOTORU
OPT˙IM˙IZASYONU
Arif Usta
Bilgisayar M¨uhendisli˘gi, Y¨uksek Lisans Tez Danı¸smanı: Prof. Dr. ¨Ozg¨ur Ulusoy
Eyl¨ul, 2015
˙Internet ¨uzerinden arama yapmak, ˙Internet kullanıcılarının tercih etti˘gi en pop¨uler aktivitelerden birisidir. Arama motorlarının olduk¸ca fazla kullanılması sayesinde, kullanıcıların yapmı¸s oldukları aramaların yer aldı˘gı bilgilerin lanılabilmesi olduk¸ca kolayla¸smı¸stır. Ara¸stırmacılar bu bilgileri kullanarak kul-lanıcıların sahip oldukları arama davranı¸sları ile ilgili faydalı sonu¸clar elde etmi¸slerdir. C¸ alı¸smamızda, ticari olarak kullanılan e˘gitim ama¸clı arama mo-toruna ait sorgu bilgilerini detaylı bir ¸sekilde analiz ettik. Analiz sonrası aldı˘gımız sonu¸cları, ˙Internet kullanıcılarının sahip oldu˘gu arama davranı¸slarıyla kar¸sıla¸stırarak aralarındaki farkları belirledik. Bu farkları da g¨oz ¨on¨unde bu-lundurarak e˘gitim alanına daha iyi uyum sa˘glayacak, sıralama ama¸clı ¨o˘grenme algoritmalarını kullanarak bir model ortaya ¸cıkardık. Sahip oldu˘gumuz sorgu k¨umesi ¨o˘grencilere ait oldu˘gu i¸cin, modeli olu¸stururken e˘gitim alanına has ¨
ozg¨un ¨ozellikler kullandık. Modelin performansını kar¸sıla¸stırmak adına, sahip oldu˘gumuz sorgu k¨ut¨uklerindeki orjinal sıralamayı ve bu alanda sıklıkla kullanılan modern y¨ontemlerle olu¸sturulan modeli referans olarak aldık. Sonu¸clarımıza g¨ore her iki referans modeline kıyasla sırasıyla %14 ve %11’lik bir geli¸sme sa˘gladık. Bunun yanında, yapılan sorgunun t¨urlerine g¨ore ayrılmak kaydı ile, her bir sorgu grubu i¸cin farklı ¨o˘grenme modelleri tanımladık. Elde etti˘gimiz verilere g¨ore, sorgunun ders bilgisinin ve sorguyu soran ¨o˘grencinin sınıf bilgisinin farklı model olu¸stururken olduk¸ca fayda sa˘gladı˘gını ¨o˘grendik. Sorgu k¨ut¨uk k¨umesinde yer alan bazı sorgular (yalnızca bir defaya mahsus sorulan sorgular) i¸cin elimizde yeteri kadar bilgi olmadı˘gından, modelin genel performansını artırmak adına bu sorgular i¸cin ¨ozg¨un bir algoritma geli¸stirdik. Yaptı˘gımız deneylere g¨ore, bu ¨ozel sorgular i¸cin geli¸stirdi˘gimiz algoritma, olu¸sturdu˘gumuz genel modelin performansını da artırmaktadır.
v
Anahtar s¨ozc¨ukler : Bilgi Eri¸simi, Dikey Arama Motorları, Sıralama Ama¸clı ¨
Acknowledgement
First and foremost, I would like to thank my supervisor, Prof. Dr. ¨Ozg¨ur Ulusoy, for his invaluable guidance during my work. His support and dedication helped me to be motivated throughout my academic research.
I am deeply thankful to Prof. Dr. U˘gur G¨ud¨ukbay and Assist. Prof. Dr. ˙Ismail Seng¨or Altıng¨ovde for kindly accepting to read and review this thesis.
I would also express my gratitude to Assist. Prof. Dr. Rıfat ¨Ozcan for his insightful comments during my work.
I would like to acknowledge the scholarship provided by The Scientific and Technological Research Council of Turkey (TUBITAK) throughout my gradu-ate education under B˙IDEB program. I would also acknowledge TUBITAK for supporting me financially for this work with grant number 113E065.
I would like to use this opportunity to thank SEBIT for providing us the data we used throughout this thesis.
Finally, I would like to dedicate this thesis to my family. Thank you for your endless love, understanding and belief in me.
Contents
1 Introduction 1
1.1 Motivation and Scope . . . 1
1.2 Contributions . . . 2
1.3 Thesis Organization . . . 3
2 Related Work 5 2.1 Query Log Analysis . . . 5
2.2 Refinding Analysis . . . 7
2.3 Learning to Rank - LETOR . . . 8
3 Query Log Analysis 13 3.1 Search Characteristics . . . 14
3.1.1 Query Characteristics . . . 15
3.1.2 Session Characteristics . . . 19
CONTENTS viii
3.1.4 Out Click Characteristics . . . 21
3.1.5 Findings . . . 24
3.2 Refinding Analysis . . . 24
4 LETOR - Learning to Rank 31 4.1 Training and Testing . . . 33
4.2 Annotation . . . 37 4.3 Feature Extraction . . . 38 4.3.1 BM25 . . . 39 4.3.2 Page Rank . . . 39 4.4 Learning Approaches . . . 40 4.4.1 Pointwise Approach . . . 40 4.4.2 Pairwise Approach . . . 41 4.4.3 Listwise Approach . . . 41 4.5 Evaluation . . . 42
4.5.1 Normalized Discounted Cumulative Gain - NDCG . . . 42
4.5.2 Expected Reciprocal Rank - ERR . . . 44
5 Proposed Educational LETOR Model 47 5.1 Feature Set . . . 48
CONTENTS ix
5.1.1 Query-Document Text Similarity Features . . . 49
5.1.2 Query Specific Features . . . 49
5.1.3 Document Specific Features . . . 50
5.1.4 Session Based Features . . . 51
5.1.5 Query-Document Click Based Features . . . 53
5.2 Cluster Models . . . 54
5.3 Propagation Algorithm . . . 55
6 Experiments 59 6.1 Dataset and Annotation . . . 59
6.2 Data Preparation and Pre-Processing . . . 63
6.2.1 Training and Test Sets . . . 63
6.2.2 Pre-Processing Data . . . 64
6.3 Baseline and LETOR Model . . . 66
6.3.1 Baseline Performance . . . 66
6.3.2 General LETOR Model . . . 68
6.4 Feature Group Analysis . . . 68
6.5 Cluster Based Analysis . . . 70
6.5.1 Course Cluster Results . . . 70
CONTENTS x
6.5.3 Frequency Cluster Results . . . 73
List of Figures
3.1 Vitamin search GUI for the query carbon dioxide (with annotations
in English) . . . 15
3.2 Distribution of query frequencies. The x-axis represents the rank according to the query frequency in the plot. . . 16
3.3 Distribution of content type filters used in queries. . . 17
3.4 Distribution of grade filters used in queries. . . 18
3.5 Distribution of course filters used in queries. . . 18
3.6 Distribution of session lengths. The x-axis represents the rank according to the session length in query count in the plot. . . 19
3.7 Distribution of number of queries (left plot) and sessions (right plot) over users. The x-axis represents the rank according to the number of queries (sessions) per user in the left (right) plot, re-spectively. . . 20
3.8 Distribution of query submissions over time. Left: Number of query submissions per day in December 2013. Center: Distribution of queries over weekdays. Right: Percentage of queries submitted per hour of the weekdays and weekend days. . . 21
LIST OF FIGURES xii
3.9 Distribution of click counts per query (left plot) and per session
(right). . . 22
3.10 Distribution of result clicks by content type. . . 23
3.11 Distribution of clicks by rank. . . 23
4.1 Learning to Rank for Document Retrieval . . . 33
4.2 Learning to Rank Training Phase . . . 35
4.3 Learning to Rank Test Phase . . . 36
6.1 Relevance Distribution for Clicked Documents . . . 61
6.2 Relevance Distribution for Non-Clicked Documents . . . 62
6.3 Relevance Distribution of Documents for Each Position . . . 62
6.4 Relevance Distribution of Documents for Each Position for Clicked Documents . . . 63
6.5 Relevance Distribution of Documents for Each Position for Non-Clicked Documents . . . 64
List of Tables
3.1 Query characteristics . . . 16
3.2 Top-10 popular queries in terms of the query frequencies and unique users. . . 17
3.3 Session characteristics . . . 19
3.4 User characteristics . . . 21
3.5 Out click characteristics . . . 22
4.1 Summary of Notations . . . 34
4.2 Categorization of Algorithms Used in LETOR . . . 40
6.1 NDCG@K Values for each Baseline . . . 67
6.2 Evaluation of General LETOR Model With Respect to SEBIT and Baseline . . . 68
6.3 The Performances of Each Feature Group . . . 69
6.4 Training and Test Instance Counts for Each Cluster Model . . . . 70
LIST OF TABLES xiv
6.6 Search Engine Performance for Course Cluster in ERR Metric . . 72
6.7 Search Engine Performance for Grade Cluster in NDCG Metric . 73
6.8 Search Engine Performance for Grade Cluster in ERR Metric . . . 73
6.9 Search Engine Peformance for Frequency Cluster in NDCG Metric 74
6.10 Search Engine Peformance for Frequency Cluster in ERR Metric . 74
6.11 The Results of Models Learned Using Only Singleton Queries . . 76
6.12 The Results of Models Learned All Queries With Generated Features 77
6.13 The General Results of Models Learned All Queries with Gener-ated Features . . . 77
Chapter 1
Introduction
1.1
Motivation and Scope
Document retrieval has been one of the hottest research topics in Information Re-trieval. The problem of document retrieval gets more interesting when web search is the activity to retrieve the documents due to characteristics of web users. Web users tend to leave the search engine by only considering documents appearing in the first page while avoiding all documents displayed at latter pages, which makes document retrieval problem more challenging. State of the art document retrieval methods do not take the order of the documents into consideration. Therefore, a new approach is introduced, called learning to rank, which is basically a machine learning approach with the purpose of ranking.
Recently, various works have been performed on the subject of learning to rank algorithms, including different types of machine learning algorithms involving different approaches in terms of preparing the training and test datasets and the annotation methodology to be used. The learning to rank methodology is a supervised machine learning process, therefore it requires an annotation of the instances to be used in the learning phase. Depending on the approach used, generally the learning to rank algorithms are modified versions of either
classification or regression problems. However, the only and the most important difference with the learning to rank algorithms is that they are not interested in the final classified or regressed class value but rather deal with the order of instances classified or regressed.
Since the learning to rank algorithms are basically machine learning algo-rithms, what determines their performance is the choice of features to be used in the learning. In the literature of web search, numerous features are introduced. Yet, the choice of the features highly depends on the environment of the search including the domain of the search, the context of the documents available, the characteristics of the users making searches, etc. Therefore, generating the fea-tures to be used in the learning is the core of learning to rank algorithms and mostly query logs are good sources of implicit feedback about user behavior while figuring out the possible features to be extracted.
In this thesis, we try to exploit a query log provided from a commercial educa-tional vertical search engine. We carry out detailed analysis on the query log to find out user behaviors to further use them as features in the model we propose using the learning to rank algorithms.
1.2
Contributions
Our contributions in the thesis are three fold, which are explained as follows:
• We perform a detailed analysis on a query log provided by an educational vertical search engine. We compare our findings with the general search behaviors web users have. We show that students in the scope of educational domain have different search habits and therefore the problems defined in the information retrieval area should be addressed accordingly. Specifically, we also try to find the Refinding behavior in our query log, that is, we analyze how often students tend to find the documents they once visited while searching for an education material with the goal of learning.
• Using the learning to rank algorithms, we employ learning models to rank the educational materials provided in our query log. Analyzing the query log, we use our findings to further improve the learning model to better cap-ture the search behaviors of students. We introduce novel learning to rank features specifically better suited for the educational domain. We employ a learning model designed for educational domain and show that our model outperforms both the original ranking of the documents and baselines cre-ated using the state of the art ranking functions in the literature in terms of search engine performance. We also employ different models for query types by clustering queries regarding their different properties, which are namely the course of the query, the grade of the user issuing query and the query frequency. We show that using different models considering query types improves the search engine performance compared to the general model we introduce.
• We propose a feature generation algorithm to be used specifically for queries having low frequencies, where query log fails to give useful and adequate feedback to exploit in the learning phase. We also implement a similar idea of generating feature values introduced in [1] to make a comparison. We report that our proposed algorithm outperforms both the referenced model and the general model for queries having a single issue (singleton queries).
1.3
Thesis Organization
The rest of the thesis is organized as follows:
In Chapter 2, we review the early work done on both query log analysis and the web search problems using learning to rank algorithms. For each category, we first consider the general works in the literature and then give examples of more specific works. We put more emphasis on works that are closely related to our work.
categorize our findings into two categories which are Search Characteristics and Refinding Behavior. In the first section, we analyze the search habits of the users and compare our findings with the users in general web search. In the latter section, we try to analyze the Refinding behavior students have and explain our results with their reasoning regarding the educational domain.
In Chapter 4, we explain the learning to rank algorithms. We give their struc-ture to use the algorithms and explain how to obtain the learning setup to employ a better model. We briefly discuss the approaches used in the learning to rank environments. Then, we provide the evaluation metrics that are used in the literature to evaluate proposed models.
In Chapter 5, we provide our proposed educational learning to rank model. We give our constructed features along with their correspondence category and explain how each feature is calculated. We discuss the cluster models generated regarding the different query types we have in our query log. We also provide our Propagation Algorithm to be used for singleton queries to further improve the model we learned.
We report the results of our experiments in Chapter 6. We compare our find-ings with state of the art baselines and show that our proposed models improve search engine performance significantly. We conclude the thesis in Chapter 7.
Chapter 2
Related Work
2.1
Query Log Analysis
Due to immense online information available on the Web, online search is one of the most popular internet activities users prefer. According to statistics available on [2], the web sites providing search engine service are among the top visited sites. Google is at the top of the list while Yahoo and Baidu (the leading search engine provider in China) are among the top five. As a result, there are huge data available to exploit to learn some patterns. Therefore, in recent years there has been a growing interest in analyzing query logs of search engines to find out possible search characteristics that may lead to different research aspects. The idea behind the query log analysis is to figure out how web users deploy a search engine. In other words, it is a tool to find answers for the rel ated research questions such as: What do users search in Web? What are the characteristics of the user using search engines? How do they search? Answering such questions may lead researchers to new research aspects in web search area, where they can use the results from the query log analysis to further exploit potential solutions.
One of the very first large scale query log analysis papers explores search characteristics of the search engine users using query logs gathered from AltaVista
[3]. They did their calculations on a query log consisting of 1 billion queries over a period of six week time. Their findings include that queries mostly consist of 1-3 query terms, the most popular query terms in the query log are generally sexual related terms and most sessions include single query, which means users are unlikely to reformulate their queries as a result of a possible unsatisfied query issue. They also state that users tend look at only the first page, therefore they indicate that traditional information retrieval techniques may fail in the scope of the web search.
Queries are what users use for defining their search intents through search en-gines, therefore they are the answers for what users search in Web. One of the research aspects in search is to determine user intents. Hence, it is important to classify the user intents if possible prior to retrieving the search results to be shown to the user. One of the early works on this problem [4] tries to classify the queries according to their intents, which are mainly informational, navigational and transactional. Informational queries are described as queries that cover broad range of topic for which there may thousands of relevant documents, while nav-igational and transactional queries are defined as queries carrying an intent of finding a particular web site and completing a transaction such as downloading a video, respectively. An exploration of query log data reveals that most queries in a search engine are of informational (40 − 50%), followed by transactional ones (30 − 36%).
Session is another important aspect of the search. The decision of how to choose session highly affects the certain behaviors of the search engine. According to Spink et al. [5], a search session is described as the time interval between the first query issued by the user and the time the user leaves the search engine. Time based search session detection techniques are among the most popular ones. Generally, a cut of value (threshold value) is used to determine whether two consecutive search issues by a particular user belongs to the same session or not. Jansen et al. [6] use 30 minutes as cut off value to determine search sessions in and they state that the cut off value they introduced is better to explore the different query types a user issues in a single search session.
In recent years, there is a growing interest in analyzing the vertical search engines which are used to search for particular type of information. These vertical engines are important to gather results to use them in general ones. One of the early works on vertical search engines is done by Lawrence at al. [7], in which they try to retrieve scientific documents only. Weerkamp at al. [8] try to find search characteristics of a commercial vertical search engine in which users search for people only. We followed the practices they made to compare our findings with theirs and general Web as well.
2.2
Refinding Analysis
One of the problems in web search is the behavior of the users having intent to find out the documents that they once visited, which is called Refinding. There have not been many works on this subject, until it is noted in [9] that, 17% of the web users surveyed reported that “Not being able to find out a page once I visited” is one of the biggest problems to be solved in web search.
Cockburn at al. distill several years of knowledge on the Refinding behavior to improve how people return to their previously visited pages in [10]. Being one of the early extensive studies on Refinding, they state that their results indicate revisitation in Web is one of the most dominant activities, with an average of 4 out of 5 page visits being to previously seen pages. They also introduce three different interfaces to help users to find out their previously visited pages when desired using back and forward buttons. They also strongly suggest that using temporally ordered lists of previously visited pages can significantly improve the revisitation in Web.
People often repeat Web searches whether to find new information for a topic they have already explored or to find what they once found about a particular topic. Queries associated with a repeat behavior may have different texts, yet they lead users into same clicks. Teevan et al. [11] demonstrate that as many as 40 % of all queries lead users into repeat behavior. They describe the intent of
user issuing the search with categorization of different types to be derived using query string and click-through sets.
Sanderson et al. [12] confirmed refinding behavior observed by Teevan et al.[11] and extended their work to include temporal properties of repeat searches and clicks. They indicate that users show seven day and 24 hour periodicities in their search, which is also consistent throughout entire period of time of the query log. Queries issued repeatedly from different users tend to show the information need of users for a particular temporary event or news.
2.3
Learning to Rank - LETOR
In recent years, there has been significant works on learning to rank for infor-mation retrieval. Many powerful algorithms have been developed for learning to rank information retrieval and some of them have been applied to the some particular problems such as web search. One of the indepth papers on this area is published by Qin et al. [13]. They constructed a benchmark dataset called LETOR to be used by the researchers interested in learning to rank in the scope of information retrieval. They introduced the features to be used in learning al-gorithms and they categorized their features into four groups, which are low-level content features (e.g., tf*idf [14]), high-level content features (e.g., BM25 [15] and LMIR [16]), hyperlink features (e.g., PageRank [17]), and hybrid features. In total, they extracted 44 features, which are still mainly used by the researches in the learning to rank setups. Besides, they discussed data partitioning methods to split the data set to be used as training and test separately and they pro-vided with the performance results of the benchmark dataset using precision and NDCG metrics.
There is a book published by Li [18] devoted to the learning to rank for in-formation retrieval area. The algorithms and their corresponding approaches, which are pointwise, pairwise and listwise, are explained in an exhaustive man-ner. Learning to rank can be applied to many problems arising in the area of
information retrieval, specifically web search. Giannopoulos et al. [19] try to find out the user intent using learning to rank algorithms. They state that user intents in web search are subject to change and hard to capture. In order to capture the user intent, they exploit the click-through feedback of users using the learning to rank approaches. They cluster the user intents considering the query log data to learn different ranking models for each cluster. They assert that their cluster models significantly outperform the baseline which is a single model.
Query auto-completion (QAC) is one of most prominent features in modern search engines, which makes it an important research topic in information re-trieval area. In [20], Shokouhi introduces a supervised framework for personalizing auto-completion ranking. He compares existing features including user-specific and demographic features to find out their effectiveness in the scope of person-alization of auto-completion. He concludes that user’s long search history and location information perform best among the features used. Besides, he asserts that his ranking models supported by personalization features outperforms the existing popularity based baselines, in terms of mean reciprocal rank (MRR) by up to 9%.
One of the hot topics in information retrieval related to the learning to rank methodologies are click models. In a learning to rank environment for a model to be learned, an annotation must be done since it is a supervised learning process. Making relevance annotation by judges is of high cost, which leads the researchers to come up with models that try to predict the relevance of the documents auto-matically with high effectiveness.
In one of the early works on click models, Dupret et. al. [21] propose a set of assumptions made on user browsing behavior that allows predicting the relevance of the documents using estimation of the probability that a document is seen. They try to estimate the probability of a result document being clicked as the ratio of the number of times a user clicked on the document to the expected number of times the document is examined, instead of pure click through rate (CTR) values. Apart from the position and the cascade model [22], they give a baseline model, which only depends on the attractiveness of the document (URL,
snippet etc.) They also state that, the cascade model outperforms significantly the other models in explaining the clicks at higher ranks. On the other hand at lower ranks, it is slightly worse than the other models, including the baseline model they proposed.
Click through can provide an important source of user feedback and therefore can be used to determine the relevance labels of the documents using clicks of users rather than editorial judgment. However, due to the position bias, doc-uments appearing at lower ranks are less likely to be clicked, which makes it difficult to capture the relevance information for such documents.
Chapelle at al. [23] propose a Dynamic Bayesian Network to give an unbiased estimation of the relevance from click logs. Their model tries to combine the advantages of both the position model and the cascade model. They claim that their model is similar to the position model in the sense that a click occurs if and only if the user examines the URL and finds it relevant. Similar to the cascade model, their model assumes that user sequentially looks at all the results and clicks based on the perceived relevance. The user keeps examining the next URLs if he is not satisfied with the current URL (based on actual relevance). The difference between their proposed model and the cascade model is that click does not necessarily mean that document is relevant. Also, there is no limit in terms of click numbers in their model. They assert that their experiments show that their proposed model outperforms existing click models in predicting both click-through data and relevance.
Clicks on search results are helpful source determining the user satisfaction in a search session. Yet, click information can be noisy due to position and caption bias and some other factors. A common approach to remove the noisy clicks may have is to use 30 seconds threshold [24] to categorize clicks as satisfied (SAT) or dissatisfied (DSAT) clicks. However, Kim et al. [25] claim that using a single threshold value (e.g., 30 seconds) to determine whether the user is satisfied by the click is not rational due to different page characteristics. They state that topic of the page, its readability level and its length are crucial in determining the amount of dwell time needed to figure out whether any click can be labeled
as satisfied.
To understand whether a user is satisfied with the current search results, im-plicit behavior is a useful data source, with clicks being the best-known imim-plicit signal. Yet, it is possible that a non-clicking user to be satisfied and a clicking user to be dissatisfied. In [26], Hassan et al. used the user behavior among search sessions as the implicit signal to determine whether a click is satisfied or not. Specifically, they focused on reformulation behavior, which is defined as consecutive queries having similarities in textual content and interior time less than a certain threshold. They claim that their query based model with addi-tional query specific features is better to figure out user satisfaction than the click based models.
The click through data has been used in various subjects in web search using the learning to rank algorithms. However, there is a limit to the usage of click logs when there is not enough information about some particular queries in the query log. This problem generally occurs for the queries having low frequencies, called tail queries. In recent years, researchers have started to focus on this is-sues trying to generalize learned models to perform well enough for tail queries as well. Aktolga et al [27] try to boost rarely clicked queries in a system where limited click-through data are available. They proposed a probabilistic approach to re-rank the result list of documents for sparse queries. They utilized the in-formation of co-click queries, which share clicks on the same documents. They try to generate click-through features using the set of queries similar to the given query which has no to little click data available. They categorized similar queries into three groups, which are similar queries that share at least one co-click, syn-onym queries that are lexically related to each other and subset queries where one is included in the other as a subset. They assert that their models using three sets of similar query sets are significantly better than the Lucene based baseline model.
Incorporating click-through features using query logs to the learning to rank algorithms is useful to have better performing model, yet there may be some occa-sions where click-through features cannot be calculated. Gao et al. [1] introduce
clickthrough stream as the set of queries having co-click for a particular document in the query log given a certain document. Their calculation of click-through fea-tures differs from the ones in the literature in the sense that they also consider whether a click is the last click in the search session to give more importance for the documents that are clicked last.
They further try to improve the performance of features by using two smooth-ing techniques, which are Discount method and Random Walk. There are certain queries in the query log whose result lists include documents that have insufficient clickthrough stream that is not big enough to calculate the features effectively. For those queries, they use random walk approach to generate artificial con-nections between the query having a sparse click through stream for associated documents in the result list and other random queries. However, this method is not applicable for queries that have zero click in the query log and therefore zero queries in their click-through streams. For those queries, they simply try to estimate the values of the click through features, initially calculated as zero prior to Discount method, by using the values of the features of the queries having a single query in their clickthrough stream. The motivation behind this idea is to reduce the penalization of the ranker training instances which have zero valued features. They report that using Discount method and Random Walk along with their combination they further improve the model learned by the state of the art ranking functions by up to 4%
Chapter 3
Query Log Analysis
Search is a key web activity among all kinds of users towards a large variety of goals. While the lion’s share of previous works on query analysis focus on general web search, the need for analyzing the search behavior of certain user groups and/or users searching for a certain type of information has emerged as an im-portant research direction. Recent studies show that children and teenagers, who constitute a large and dynamic subset of web users, deserve special attention as their search behavior differ from the adults in several ways while using search engines [29, 30, 31]. Other studies address alternative search tasks that are usu-ally carried out via verticals, and analyze query logs obtained from the systems specialized for digital libraries, audio-visual archives and searching people on the web [8].
In this chapter1, we analyze the query logs of a commercial educational content
developer and service provider for Turkish students at K-12 level. Turkey has the youngest population in Western Europe (by median age) and 42.9% of its total population, which is estimated to be around 77 millions as of December 2013, is young, i.e., under 24 years old. According to national statistics, the number
1This chapter is based on the work [28] published in Proceedings of the 37th International ACM
SIGIR Conference. SIGIR’14, July 6–11, 2014, Gold Coast, Queensland, Australia. http://dx.doi.org/10.1145/2600428.2609532.
of students at primary and secondary schools adds up to 16,156,519 (excluding pre-school and open-education students) [32]. Not surprisingly, there are several governmental and industrial efforts to develop education services and products targeting this young and dynamic population. VitaminTM is a commercial
web-based educational framework that provides interactive content and performance assessment mechanisms for a large variety of courses covered in K-12 curriculum in Turkey. As of December 2013, Vitamin has more than 1.2 million registered users and about 4.3 million site visits per month. These users can utilize the navigational interface to reach to the content they need, or they can perform search over the entire set of educational materials.
3.1
Search Characteristics
Following the practice in [8], we provide the characteristics of search in Vita-min with respect to four major dimensions; namely, queries, sessions, users, and clicked results. We also compare and contrast our findings to those on general web search engines and/or earlier results on children’s search behaviors. Our analysis helps understanding how students search with the purpose of learning in an ed-ucational vertical, and reveals new directions to improve the search performance in the education domain.
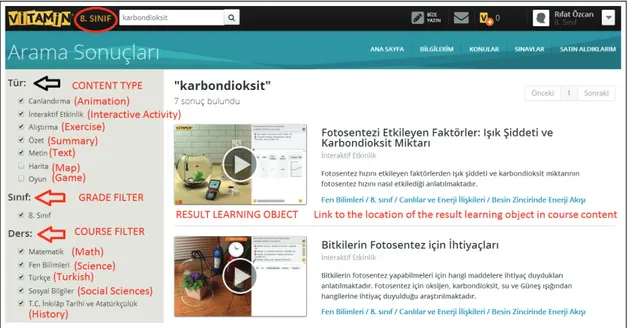
Vitamin search engine allows users to issue a keyword query along with a num-ber of category filters, namely, content type, grade, and course filters. Figure 3.1 shows the GUI of the Vitamin’s search system for the query “carbon dioxide”. Then, users can click and display a particular query result, which is called a learning object and presented in text and/or audio-visual formats; or navigate to certain point in a topic hierarchy where this learning object belongs to. The sys-tem stores the queries and clicked results in the search log, while the navigational type of interaction is recorded separately as a different kind of event. Therefore, our preliminary analysis here involves a query log that includes a sample from the queries submitted to Vitamin’s search system in December 2013 by the logged-in users (i.e., with paying or trial accounts), and followed by at least one click on
Figure 3.1: Vitamin search GUI for the query carbon dioxide (with annotations in English)
the displayed results.
3.1.1
Query Characteristics
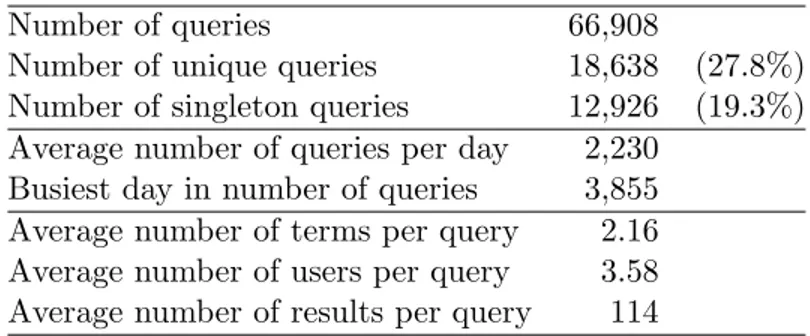
According to Table 3.1, 27.8% of the query volume are unique queries and 69.3% of the latter are singletons, i.e., asked only once. These values differ from the web search trends, where 50% of the queries in a typical search log are unique and 88% of them are singletons [33]; and more similar to the trends obtained for a vertical for searching people [8]. This means that the queries are more likely to be repeated in this educational search engine, which is a good news for the mechanisms that exploit temporal locality, such as caching. On the other hand, distribution of query frequencies shown in Figure 3.2 confirms the power law distribution characteristics as in the case of web search [33].
On the average, a query includes 2.16 terms, which is slightly shorter than typical web queries (around 2.5 terms as reported in [33]) as well as the queries submitted to a major web search engine by the users between 10 and 18 years old
Table 3.1: Query characteristics
Number of queries 66,908
Number of unique queries 18,638 (27.8%)
Number of singleton queries 12,926 (19.3%)
Average number of queries per day 2,230
Busiest day in number of queries 3,855
Average number of terms per query 2.16
Average number of users per query 3.58
Average number of results per query 114
1 10 100 1000 10000 1 5 50 500 5000 Rank Frequency
Figure 3.2: Distribution of query frequencies. The x-axis represents the rank according to the query frequency in the plot.
(around 2.6 terms [29]). This difference might be attributed to the fact that the educational search setup is a more restricted domain than web and even a couple of terms can yield the relevant resources from the available content.
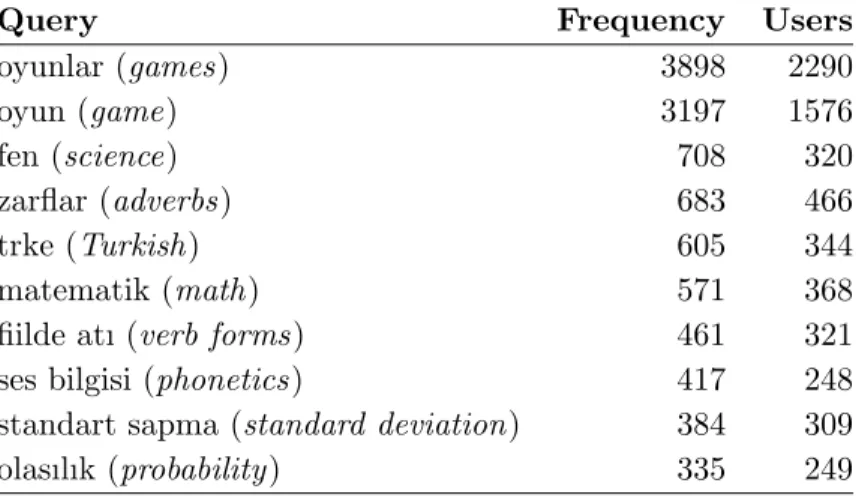
Table 3.2 lists top-10 most frequent queries, which yields interesting findings. First, top-2 queries are “games” and “game”, which means that the students enjoy the educational games provided by this system. Among the remaining 8 queries, 3 of them are simply the course names and too general to be useful (i.e., “science”, “math”, “Turkish”). This implies that the students who want to find a certain course still use the search box, rather than browsing through the list of courses. The other popular queries are related to Turkish and Math courses, and might be related to the topics that are being discussed in these courses at this time of the year.
Table 3.2: Top-10 popular queries in terms of the query frequencies and unique users.
Query Frequency Users
oyunlar (games) 3898 2290 oyun (game) 3197 1576 fen (science) 708 320 zarflar (adverbs) 683 466 trke (Turkish) 605 344 matematik (math) 571 368
fiilde atı (verb forms) 461 321
ses bilgisi (phonetics) 417 248
standart sapma (standard deviation) 384 309
olasılık (probability) 335 249
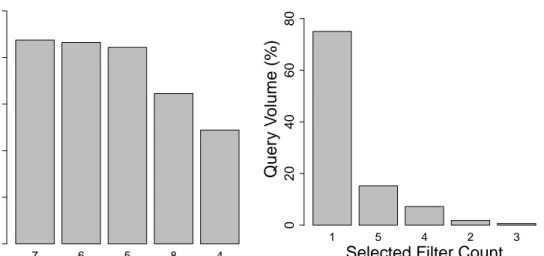
As mentioned before, Vitamin’s search interface allows setting various filters along with a query, which we analyze next. Figure 3.3 shows the distribution of content type filters selected while submitting queries. It is seen that all content types are selected in the majority of the queries, which is the default setting in the GUI. This means that users leave this filter as-is most of the time, probably because they want to see all available content relevant to their query. We observe similar trends for the use of course filter, as shown in Figure 3.5.
Game Animation Activity Object Ex ercise Summar y T e xt Map Solv ed Example Quer y V olume (%) 0 20 40 60 80 100 8 7 1 2 3 4 5 6
Selected Filter Count
Quer y V olume (%) 0 20 40 60 80
7 6 5 8 4 Quer y V olume (%) 0 10 20 30 40 50 1 5 4 2 3
Selected Filter Count
Quer y V olume (%) 0 20 40 60 80
Figure 3.4: Distribution of grade filters used in queries.
T ur kish Mathematics Science Social Studies Histor y Quer y V olume (%) 0 5 10 15 20 25 5 1 2 4 3
Selected Filter Count
Quer y V olume (%) 0 20 40 60 80
Figure 3.5: Distribution of course filters used in queries.
In contrast, the grade filter, at a first look, seems to be used more effectively as the majority (more than 70%) of the searches are restricted to a certain grade level (Figure 3.4); grades 5, 6 and 7 being the most popular ones. However, this difference in the behavior may not necessarily be caused by the students’ awareness of this filter, as the search GUI for the trial accounts, by default, shows only the user’s own grade level as selected. Therefore, for most of the searches, we can still claim that students are reluctant to change the default filter settings. This is an interesting finding that deserves further analysis, as it can provide useful insight for designing a better search interface.
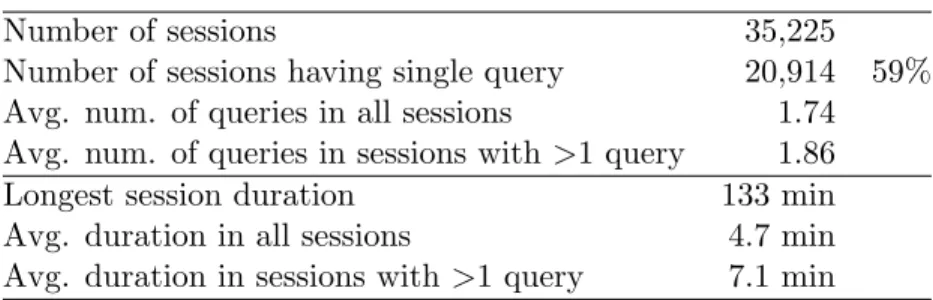
Table 3.3: Session characteristics
Number of sessions 35,225
Number of sessions having single query 20,914 59%
Avg. num. of queries in all sessions 1.74
Avg. num. of queries in sessions with >1 query 1.86
Longest session duration 133 min
Avg. duration in all sessions 4.7 min
Avg. duration in sessions with >1 query 7.1 min
3.1.2
Session Characteristics
As in the previous studies [29], we detect sessions by grouping together a partic-ular user’s successive searches that has a time gap less than a time-out value (30 minutes). Table 3.3 presents several statistics about query sessions. Among the total of 35K sessions, about 59% include only one query.
1 10 100 1000 10000 1 2 5 10 20 Rank Session Length
Figure 3.6: Distribution of session lengths. The x-axis represents the rank ac-cording to the session length in query count in the plot.
This skewed distribution of session length in number of queries can be seen in Figure 3.6. Users submit around two queries in a session on average (computed by macro-averaging over users). The average number of queries submitted to a commercial search engine is 2.4 [34]. The average session duration in our log is 4.7 minutes and this is slightly longer than the session duration for children (between ages 6-18) reported in [29]. However when it is compared to a general user’s query
session in a web search engine (around 7 minutes in [34]), it is shorter. This again indicates that the students can effectively find what they look for in this context of educational search.
3.1.3
User Characteristics
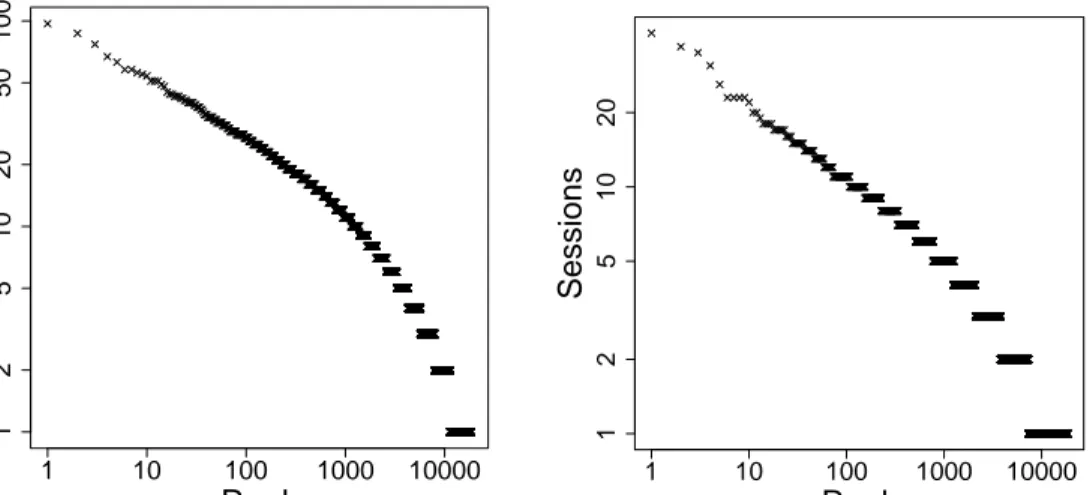
We present the characteristics of users in Table 3.4. Among 18K total users, 40% of them issue only one query during the one month period of our log. This skewed distribution can also be seen in Figure 3.7 (left plot), where a large portion of users asks very few queries but a few users submit large number of queries. The distribution of the number of sessions over users shown in Figure 3.7 (right plot) is even more skewed since 60% of users interact in only one session. On the average, users ask 3.61 queries in 1.92 sessions.
1 10 100 1000 10000 1 2 5 10 20 50 100 Rank Quer ies 1 10 100 1000 10000 1 2 5 10 20 Rank Sessions
Figure 3.7: Distribution of number of queries (left plot) and sessions (right plot) over users. The x-axis represents the rank according to the number of queries (sessions) per user in the left (right) plot, respectively.
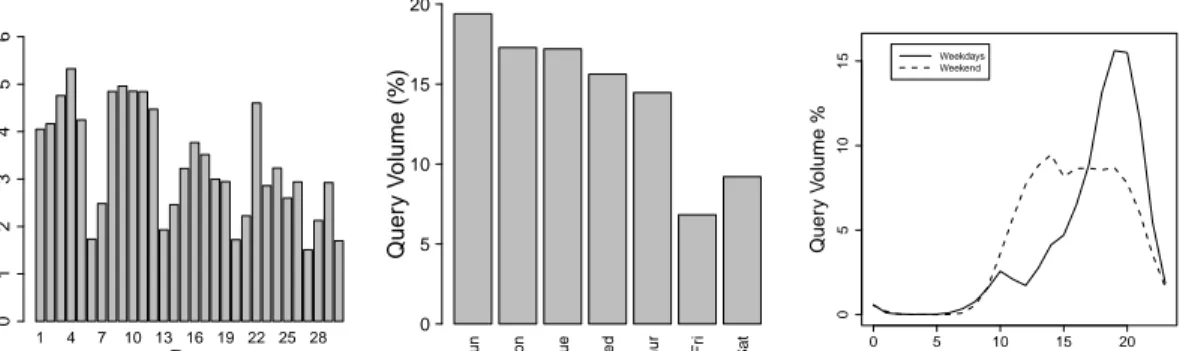
Figure 3.8 shows the distribution of query submissions over time. Monthly analysis (left plot) shows weekly patterns clearly. Students submit the largest number of queries on Sunday and least number of queries on Friday, according to the daily analysis in Figure 3.8 (center). This provides some interesting clues in students’ studying habits: the students heavily search for information on Sunday,
Table 3.4: User characteristics
Number of users 18,534
Number of users with >1 query 11,402 62%
Number of users with >1 session 7,590 40%
Avg. num. of queries per user 3.61
Avg. num. of queries per user with >1 query 5.24
Avg. num. of sessions per user 1.92
Avg. num. of sessions per user with >1 query 3.31
during when they might be doing homeworks for the upcoming week. Then, their activity in the search engine decreases gradually in the weekdays and reach the minimum on Friday, when most of the students seem to enjoy the weekend. Hourly analysis in Figure 3.8 (right) shows the percentage of queries submitted to the system in different hours of a day separately for weekdays and weekends. It is seen that students prefer to use the system mostly between 18:00-21:00 on weekdays (after school) and between 12:00-21:00 on weekends.
1 4 7 10 13 16 19 22 25 28 Quer y V olume (%) 0 1 2 3 4 5 6
Day Sun Mon Tue W
ed Thur Fr i Sat Quer y V olume (%) 0 5 10 15 20 0 5 10 15 20 0 5 10 15 Hour Quer y V olume % Weekdays Weekend
Figure 3.8: Distribution of query submissions over time. Left: Number of query submissions per day in December 2013. Center: Distribution of queries over weekdays. Right: Percentage of queries submitted per hour of the weekdays and weekend days.
3.1.4
Out Click Characteristics
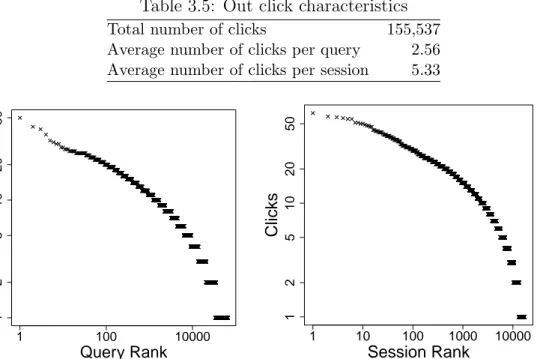
In this part, we analyze the clicks on the query results. Table 3.5 presents basic statistics about clicks. On the average, users click 2.56 results per query and 2.29 clicks are unique. In terms of a session scope, there are 5.33 clicks on the average and 4.80 clicks are unique. The log-log scale plots in Figure 3.9 shows that the
Table 3.5: Out click characteristics
Total number of clicks 155,537
Average number of clicks per query 2.56
Average number of clicks per session 5.33
1 100 10000 1 2 5 10 20 50 Query Rank Clicks 1 10 100 1000 10000 1 2 5 10 20 50 Session Rank Clicks
Figure 3.9: Distribution of click counts per query (left plot) and per session (right).
distribution of number of clicks again follows a power law distribution.
Figure 3.10 shows the percentage of clicks for each type of learning objects. It is seen that users mostly prefer “animation” and “interactive exercise” type of contents. Furthermore, “interactive activity” and “lecture” type of contents are also clicked frequently, while textual resources (“Text”) are less likely to be clicked. These findings reflect the students preference of interactive content over purely textual material, which actually leads most educational content to be presented in the former format in Vitamin.
Animation Inter activ e Ex ercise Inter activ e Activity Lecture Game Ex ercise Summar y T e xt Map Solv ed Example
Click V
olume (%)
0 5 10 15 20 25 30Figure 3.10: Distribution of result clicks by content type.
1 2 3 4 5 6 7 8 9 10 11 12 13 14 15 16 17 18 19 20+
Quer
y V
olume (%)
0 5 10 15 20 25Result Object Rank
Figure 3.11: Distribution of clicks by rank.
Finally, we focus on ranks of clicked results in Figure 3.11. We see that while top-2 results, surprisingly, take the largest share of the clicks, there is a non-negligible fraction of clicks for the results placed at much lower ranks, even after
rank 20. According to a general web search engine log [35], clicks for top-2 results account for 58% of all clicks and only 9% of clicks are below rank 10. However, in our log, top-2 clicks and clicks after rank 10 constitute 36% and 20% of all clicks, respectively. This might either indicate the students’ dissatisfaction of the results, or their preference to see several relevant results while learning a topic.
3.1.5
Findings
In this section, we presented an in-depth analysis of a query log from a popular K-12 educational search system with real user queries. Our analysis revealed that the trends in this context differ from general web search in various aspects, which might be exploited for building educational search engines that are better tailored for students’ needs and behaviors. In particular, the high fraction of repeated queries indicates that system components that rely on the query history (such as caching and query suggestion) can be made more effective. The students’ preferences in using the query filters call for reconsidering the design of the search interface. Finally, our out-click analysis shows that students prefer active content formats (like animations and interactive lectures) over the static content (like text) and can click further lower ranks in the results list other than the first few results. Such findings can help designing better features for the machine-learned ranking algorithms and lead higher user satisfaction.
3.2
Refinding Analysis
In literature, query log analysis has been done on various query logs provided by some commercial search engines or by some vertical search engines. There exist few query log data which are distributed as public data to help researchers to exploit possible works to be done in search problems. One of the issues that arise from search problems is refinding problem. Refinding is the behavior of a user that searches particular document and as a result clicks the same document multiple times from different search sessions. In the work [9], it is noted that 17%
of those surveyed people complained about finding the page once they visited and stated that this is one of the biggest problems in using Web.
Using the query log data provided by SEBIT, we tried to explore refinding be-havior of students who issue searches. The data is comparable to other statistical datasets used in query log analysis, which is already explained in the previous section in detail. Query log data gives helpful feedback about user actions, yet it is not enough to explain the underlying motivation behind user search. Refinding can be considered as one of the motivations users may have during search.
We tried to capture Refinding behavior by first grouping user issues according to their unique userids derived from query log. Then for each user, search issues are sorted considering their timestamp provided in data. We assumed that if a user clicks for a document and later on in a different search session clicks again that particular document, this behavior is labeled as refinding. Note that, to have Refinding behavior, one has to click for a particular document from two different search sessions having different timestamps. Also note that, even if those two search sessions do not have the same query text as an input to the search engine, we considered this as Refinding behavior as well. What is important for us is to find out whether the same document is clicked multiple times for a particular user in order to label as Refinding.
For instance, a user searches for the query “Math functions” and clicks a learning object (page in Web) shown in the result list for that query. Later the same user searches “functions” at a different time and clicks the same document again, which we assumed has underlying motivation to find the same document clicked once before. Therefore we consider it Refinding.
In this section, we show the results of Refinding behavior we observed in our query log data. While doing that, we choose the particular observations stated in [11]. For each analysis we make, we first state the case for general web and provide our results to compare with theirs.
[11]. Refinding query is the query session in which user clicked a document that is clicked before on another search session by again that particular user. Newfinding query is the opposite, having no documents clicked before on any other search session user has. The results along with their comparison to their corresponding results in Web are as follows:
1. In Web, in 40% of all search sessions users have in general web search engines, there is at least a document retrieved in the result list and clicked by the user who clicked that particular document at least one time in any of the past searches. In other words, 40% of users have tendency and motivation to find and therefore click the document they once visited.
⇒ In our findings, the results are significantly different. In our query log data, we have 66908 query issues in total. Of those, we found Refinding behavior in 17218 queries, which is approximately 25%.
The reason could be that in educational search environment, students periodically study different materials related to the subjects listed in cur-riculum. Therefore, they are likely to search for another subject different than what they already searched. Another reason could be that students advertently try to avoid those documents once they already discovered. In terms of learning aspect, it might be rational and wise to choose a doc-ument they have never visited to explore what that particular material can offer for them to learn the subject better.
2. If we are to repeat the previous analysis in terms of document perspective, the results again show differences. In other words, among all documents clicked by all users, 28% of them are clicked multiple times by the same user at different search sessions having different timestamps.
⇒ In our query log data, we have 165,587 learning objects (documents) clicked at least one time by a user in any search session. Of those, only 20,594 documents are clicked multiple times by the same user at a differ-ent time, which roughly corresponds to only 12% of all documdiffer-ents. The reasoning behind this behavior is the same as the previous one, that
is, students are less likely to search the same subject due to having multi-ple subjects listed in their course curriculum and students tend to look for new learning objects to enhance their knowledge about subjects covering different parts mentioned in different documents.
3. Another difference is observed in the number of documents clicked by multiple users in any search sessions. Among all clicked documents, in web only 7% of documents are clicked by multiple users. However, this behavior must be handled regarding the immense number of documents across web.
⇒ The results for our query log indicate completely different story. Among all documents clicked, 99% of them are also clicked by another user in a different search session. This is the reflection of our learning object set, which includes only 3500 different objects to be retrieved in result lists. Hence, students are shown similar document lists even if queries written might be different. However, considering the amount of query sessions (66K) we have in our query log, it is not reasonable to explain this behavior only considering the amount of documents we have. Since students share same documents in terms of click information, which can indicate students are likely to find similar documents relevant compared to general web users.
4. Another statistic is to find out the tendency users have to prefer documents that they have never visited before, specifically in search sessions they explore documents that they visited once. In other words, among all Refinding queries in Web, 14% of them include user clicks on new documents that are not clicked before by that particular user.
⇒ The above analysis given in [11] is one of the behaviors where results show significant difference compared to our results. In our query log, students are more likely to click new documents in search sessions in which they already clicked on a document they once visited. In Refinding query sessions, it is observed that 43% students also click new documents that they never visited before.
students according to our observations. The first one is willing of the stu-dents to explore new learning objects while trying to cover more aspects of a particular subject. Another reason is more general, that is, as men-tioned in previous section, students are more likely to click documents on average compared to general web searches, which essentially results in newly clicked documents.
5. Another aspect of the analysis is to find out the correlation between query texts that resulted in Refinding behavior. In web, within the user issues, users generally prefer the same query text while trying to visit a document that they visited once. Among all query sessions including Refinding behavior, 71% of them come from the same query texts. The calculation is made by simply taking the ratio of unique query texts over all query issues having Refinding click.
⇒ The behavior for this particular statistic is similar for the students as well. In our query log, students generally prefer the same query texts that result in Refinding click, which accounts for 64% of all query issues having Refinding behavior.
6. Similar to the previous analysis, users tend to click documents that they once visited in search sessions where they prefer the same query texts, which account for 87% of all query issues that have the same query text by the same user.
⇒ Unlike the previous analysis, there is a difference between Web and our query log in terms of this particular behavior of users. The probability of a search session in which Refinding happens to have the same query text as the ones where the users clicked the same document before, is considerably high. However, the probability of a student to click on a document that he visited once before in search sessions where he prefers the same query text is only 44 %, which is relatively low compared to Web.
The main reason for this result could be that students have less skills to define their queries in terms of their search needs compared to general web users. They have difficulties to express their intent in clear manner,
which results in different query texts even though they have the same intent.
7. Same query text analysis is done this time for search sessions, namely Newfind-ing Query Sessions, where a document that the searchNewfind-ing user never visited before gets clicked. As suggested in the paper [11], the results are lower than the Refinding Query Sessions, that is, among queries having the same text, 38% of them result in newly clicked documents.
⇒ Naturally considering the previous analysis results, this percentage is much higher than Web. While learning, new documents mean more source to cover for a subject, which results in more query sessions where Newfinding behavior happens. However, it must be noted that this Newfinding behavior occurs even in sessions having the same query texts, meaning the students prefer new learning objects in a consistent manner. Among all queries having the same text, 74% of them result in newly clicked documents.
8. In addition to the previous two analysis, the results for intersection behavior of these two are also calculated. In Web, among query sessions having the same query text, probability of a search session to have both Refinding and Newfinding behavior is 25%.
⇒ The results for this analysis show similarities to those in Web. Yet, the ratio is slightly lower than Web, which is 18%. This difference can be explained by the lack of ability of students expressing their intents clearly. In other words, the ratio clearly shows that even though students type the same query text, those sessions might intend to find both Refinding and Newfinding documents, which is what makes it difficult for the search engine to predict actual user intent to improve search results.
9. Another analysis made on the paper [11]is whether Refinding behavior depends on the number of clicks user made on that particular refinding session. Among all user issues made, 29% of the search sessions which result in single click on a document have Refinding behavior.
⇒ The results for this analysis on our query log data are slightly different than the results with the Web. Students are more likely to click on Refinding document where they prefer to click a single document on a search session, which accounts for 42% of all searches including single click. The difference arises from the search habits students have compared to general Web users.
In web, generally search sessions having single click are considered as failed searches. Yet, this is different for students. Having a failed search session including single click generally leads the user to reformulate his query to perform better search to find the page he is looking for in Web. However, students lack the ability of reformulating queries that they think are unsuccessful. In other words, ratio of single click sessions to all search sessions is less than the ratio we have in general Web case. Therefore, in our query log, we believe that, contrary to the behavior users have in Web, sessions having single clicked document means successful Refinding search rather than an unsuccessful one.
10. The last analysis we performed for comparison is the opposite of the previous analysis, which is to find Refinding behavior in search sessions where multiple clicks occur. In web, among all search sessions including multiple clicks on documents, only 5.3% of them include Refinding behavior, which is expected regarding the previous analysis.
⇒ This is one of the analysis that behave significantly different for our query log data compared to general Web. 57% of search sessions including multiple clicks lead students to click on a document they once visited. The reasons for this behavior we believe are twofold. The first reason is the less number of documents our data have. Hence students tend to click more documents compared to Web, which eventually includes one of the documents they already visited before. The other reason would be that students are less likely to remember the documents they visited before in a successful search, therefore for a Refinding intent, they have to click more documents than general Web users.
Chapter 4
LETOR - Learning to Rank
In information retrieval (IR) and natural language processing (NLP), ranking is the central problem for many tasks. These tasks include document retrieval, question answering, personalized search, collaborative filtering, document sum-marization, and so on.
Ranking problem generally consists of two different types; which are ranking creation [18] and ranking aggregation. Ranking aggregation is to create a list of objects using multiple lists of objects by aggregating them into a single list, while ranking creation is to make a list of objects using feature sets of the objects given another type of the object (query in web search case). Our work in this thesis falls into the latter group.
Document retrieval is one of the main problems in information retrieval for which the ranking problem is the main issue to be solved. In web, although there are limitations for search, to access information available on Web it is by far the most common and practical solution to search for a page. For instance, according to a report by IProspect, 56% of the internet users use web search every day and 88% of the internet users use web search every week [9].
In this scope of document retrieval task, learning to rank refers using machine learning algorithms to rank documents using a trained model given query and
document pairs. The idea of ranking creation is to create a list of documents using extracted features of documents given query so that good and preferable documents will be ranked at top compared to other documents. Learning to rank is therefore concerned with the automatic creation of ranked list of documents using machine learning algorithms.
Learning to rank plays a significant role in document retrieval to rank ments using machine learning techniques to come up with a better list of docu-ments to satisfy user needs and therefore to improve search engine performance. However, this technique can be considered as a new trend following the literature in information retrieval. Before LETOR, traditionally search engines were trying to find a function f (q, d) to score a document d given query q without learning any model using machine learning algorithms.
In [15], BM25 technique is used to derive a conditional probability to construct ranking function f (q, d) where conditional probability is represented as P (l|q, d) in which l denotes the label of the document given query to get either 1 or 0 being relevant or irrelevant respectively to the query.
Another technique used for document retrieval task in literature prior to LETOR is using Language Model for IR (LMIR) [16]. Using LMIR, the rank-ing model is again defined as conditional probability distribution P (q|d) where q represents the query and d denotes a document. In both techniques, ranking is made using probability distributions that is probability of each document given query is calculated and then documents are sorted according to their probability scores to assess final ranking of documents. Since these two techniques use only probability distributions, no model is learned in either of the methods.
Learning to rank method is a new trend arising in information retrieval to be used in document retrieval such as general web search. In learning to rank, the ranking model f (q, d) is learned through past data, which is basically the search issues by users, called query log data. Using query log data, user behaviors for particular queries such as impressions and clicks are recorded to be exploited in the model to train better ranking function. In learning to rank environment,
Figure 4.1: Learning to Rank for Document Retrieval
sets of queries Q and documents D are constructed. Then for each query q in Q, associated documents are chosen. Learning to rank uses supervised machine learning algorithms, that is, each document d in associated set of q is labeled to denote its relevance to query q. Then using these query-document pairs along with their correspondence labels, ranking function f (q, d) is learned to predict scores. Overall structure of working mechanism of general learning to rank environment can be seen in Figure 4.1. The figure is inspired from the work in [18];
4.1
Training and Testing
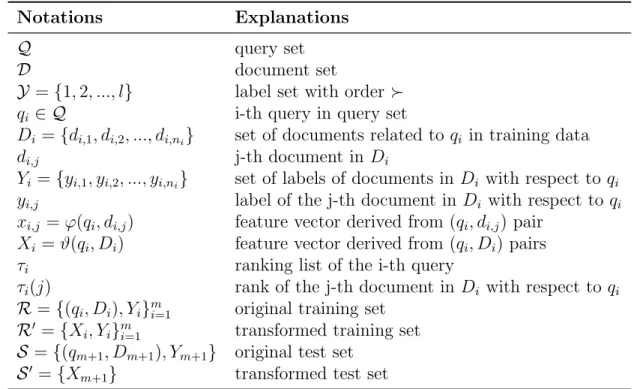
Since learning to rank is a supervised learning process, creation of training and test sets is a must for the setup. In this section, we will be presenting the idea of learning to rank environment setup briefly. As explained in [18], each notation that will be used in the explanation is given with their explanations in Table 4.1.
Using query log data, we first find the unique query issues and unique docu-ments to create query set Q and document set D respectively. In learning to rank environment, feature vectors are derived from query-document pairs. Hence, after
Table 4.1: Summary of Notations Notations Explanations
Q query set
D document set
Y = {1, 2, ..., l} label set with order qi ∈ Q i-th query in query set
Di = {di,1, di,2, ..., di,ni} set of documents related to qi in training data
di,j j-th document in Di
Yi = {yi,1, yi,2, ..., yi,ni} set of labels of documents in Di with respect to qi
yi,j label of the j-th document in Di with respect to qi
xi,j = ϕ(qi, di,j) feature vector derived from (qi, di,j) pair
Xi = ϑ(qi, Di) feature vector derived from (qi, Di) pairs
τi ranking list of the i-th query
τi(j) rank of the j-th document in Di with respect to qi
R = {(qi, Di), Yi}mi=1 original training set
R0 = {X
i, Yi}mi=1 transformed training set
S = {(qm+1, Dm+1), Ym+1} original test set
S0 = {X
m+1} transformed test set
finding overall sets, each query is associated with a number of documents. Along with the association, relevance of documents with respect to associated queries is also given. The relevance information may vary depending on the method to annotate the query-document pairs. In this section, the most common scenario is taken into consideration, that is, relevance labels given as integers starting from 1 to g. The labels are at several grades. Specifically, a higher grade a document has with respect to a query, the more relevant the document is associated with the query.
In this section, we follow the work in [18] by Li to explain basic principles of learning to rank environments. Suppose that Y = {1, 2, ...g} is the label set, where the labels represent grades each document can get with respect to a particular query. There exists a relation between the grades in Y such that, g g − 1 ... 1, where states the order of the relation between grades. Further assume that we have training data consisting of query set {q1, q2, ..., qm}
where m denotes the number of queries that are used in learning. In the set of queries used in learning, i-th query is called as qi. Then Di = {di,1, di,2, ..., di,ni}
Figure 4.2: Learning to Rank Training Phase
is the set of documents associated with qi. Along with documents themselves,
Yi = {yi,1, yi,2, ..., yi,ni} is the set of labels of documents in Di with respect to
qi. Therefore, yi,j represents the label of the j-th document in Di with respect
to i-th query qi. Overall, training set before feature extraction becomes R =
{(qi, Di), Yi}mi=1, where m denotes again the number of queries used in training
set to learn the model.
Further, the feature vector for each query-document pair is extracted from training set R. For i = 1, 2, ..., m and j = 1, 2, ..., ni, the feature vector xi,j =
ϕ(qi, di,j) is constructed using query qi and document di,j where ϕ represents the
functions used to derive the features. In other words, ϕ is the function which gets two inputs from query qi and document di,j and outputs the feature vector
xi,j. Feature extraction process is done for each query-document pair in each
list of documents associated to a particular query, that is, the feature vector Xi = ϑ(qi, Di) for a particular query qi is calculated using Di. Next, transformed
training data R0 = {Xi, Yi}mi=1 is constructed using each Xi along with their
correspondence label set Yi for associated documents.
Suppose that we define the ranking of the result list of documents associated with query qi as τi. Ranking documents is simply nothing but assigning scores