of Air Pollution: The Case of Turkey
KATALIN KOVARI ZAIMDepartment of Computer Technology and Office Management
Bilkent University
06533-Bilkent, Ankara, Turkey
ABSTRACT / Economic growth and performance is moni-tored through the gross domestic product (GDP) of a nation. It has long been recognized that the traditionally computed GDP does not account for gains and losses observed due to the consumption of natural resources and environmental
services. Hence, the objective of this study is to modify the Turkish GDP by taking social cost associated with air pollu-tion into considerapollu-tion. To this end health benefits and eco-nomic costs of air-quality improvement are estimated. The computations are based on the dose–response coefficients reported in several studies. The results indicate that a de-crease in PM10and SO2levels to the WHO guideline would have resulted in a total of 48.3093 1010and 153.383 1010 Turkish lira savings in 1990 and 1993, respectively. These correspond to 0.12% and 0.08% of 1990 and 1993 GDPs, respectively.
Economic production of any commodity uses natural resources as inputs, which are then transformed into human-produced goods and services. Economic activity requires both the use of human capital as well as the support of ecosystems. Human-made capital cannot be created and sustained without natural resources. There will always be a minimum or critical amount of natural capital needed to sustain economic production and human survival. The life-support environment is that part of the earth that provides the biophysical necessi-ties of life, namely food, air, and water (Berkes and Folke 1992). The structure and processes of the ecosys-tem have to be intact and functioning in order to support the continuous production of renewable natu-ral capital. Therefore, any deteriorating effect on the ecosystem should be accounted for in the economic performance measurement.
A national economic accounting system such as gross domestic product (GDP) records monetary flows and transactions within the economy. The GDP figure is used as an indicator of well-being (development) of a nation. Its objective is to record economic activities, but not to measure aggregated well-being. The aggregate well-being includes not only the gains and losses from economic activities but also from natural resources and ecological services.
Environmental damage generates costs that are not currently recorded as part of GDP, but which would be if GDP accounts were modified to reflect comprehen-sive measures of aggregated well-being together with the economic activity. Such an adjustment in the GDP computation is crucial while assessing the well-being of
a nation. The objective of this study is to modify the GDP through estimated health costs associated with air pollution.
Modifying the National Accounts
As Pearce (1993) points out, material and energy flows begin at the point of extraction, harvest or use of natural resources. They end by being waste products, i.e., emissions to ambient environments, discharges to water, and solid waste to land or sea. Logically, then, GDP needs to be modified to account for any deprecia-tion of natural capital stocks and for any damage losses accruing to human well-being from the extraction, processing, and disposal of materials and energy to receiving environments (Pearce 1993). One proposed method of GDP adjustment is as follows (Lutz 1993):
EDP5 GDP 2 Dk2 Dn
where EDP is the ecodomestic product, Dkis the
depre-ciation on man-made capital (machines, roads, build-ings, etc.), and Dnis the depreciation of environmental
assets. The valuation methods of depreciation of environ-mental assets depend on the specific case. In this study the health and economic benefits of reducing particu-late matter (PM10) and SO2levels to the WHO
guide-line in major towns in Turkey in 1990 and 1993 are estimated. The computed values are deducted from the 1990 and 1993 GDPs to account for the social costs.
Urban Air Pollution in the Major Cities of Turkey
According the Turkish State Statistic Department’s report, the most populated cities in 1990 are Ankara,
KEY WORDS: Health costs; Air pollution; Modified GDP
Bursa, Istanbul, and Izmir. These are also the cities where the majority of the manufacturing industries are concentrated (Table 1) (SYT 1994, AMIS 1990). Istan-bul, with about 7 million people, supported 42.35% of the manufacturing industries in 1990. The industries in Istanbul mostly concentrated on metal, equipment, and textile production. Izmir and Bursa supported 10.1% and 5.26% of the total industrial activities, respectively. These activities were characterized by textile, food, beverage, and tobacco production. Erzurum and Sivas, with their respective shares of 1.4% and 0.2% of industrial activities, were minor contributors to indus-trial production.
Air pollution has been monitored in Turkey since 1980. The SO2and particulate matter PM10 levels are
measured daily in the major towns (SYT 1994). In all cities the levels of SO2 and PM10 exceeded the WHO
guidelines in all the years between 1990 and 1993. The WHO ambient air-quality guideline for annual averages are: 70µg/m3 for PM
10 and 50 µg/m3 for SO2. The
annual average air pollution measured in the major cities of Turkey is depicted in Table 2.
On average, the highest level of SO2was measured in
Sivas and Istanbul and PM10 in Sivas and Erzurum
during the 1990–1993 period. In Sivas and Erzurum the population is approximatelly 400,000 and the industrial activities are low (Table 1). The low-quality coal, high-sulfur-content local lignite, petroleum, wood, and dried dung consumption in the households and transporta-tion seem to be responsible for the high PM10and SO2
levels (Table 3). In Istanbul not only the population size but also the industrial activities are the highest, hence both the low-quality coal used in households and the fossil fuel consumed in the industrial sectors contribute to the air pollution (Table 1–3).
The annual average PM10 ambient concentration
depicted a decreasing trend only in Istanbul and Bursa between 1990 and 1993. The PM10and SO2 pollution
increased in Erzurum in the same period of time. Ankara, Izmir, Kayseri, and Sivas experienced a fluctuat-ing pattern in the annual average PM10ambient
concen-tration. A similar fluctuating pattern was observed in the annual average SO2 ambient concentration in
Ankara, Bursa, Istanbul, Kayseri, and Sivas between 1990 and 1993 (Table 2).
High concentrations of air pollutants in many devel-oping countries lead to increased illness, particularly among individuals suffering from respiratory problems, Table 1. Population and number of industries in major cities of Turkey
Total population (3106) Employed age 12 and above (3106) Child age 0–12 (3106)
1990 industries (%) 1990 1993 1990 1993 1990 1993 Ankara 2.84 3.25 1.10 1.22 0.56 0.65 4.30 Bursa 1.16 1.21 0.66 0.76 0.34 0.39 5.26 Erzurum 0.40 0.45 0.17 0.19 0.21 0.24 1.40 Istanbul 6.75 7.77 2.54 2.90 1.01 1.17 42.35 Izmir 2.13 2.46 1.08 1.24 0.45 0.52 10.10 Kayseri 0.60 0.70 0.34 0.40 0.21 0.24 1.28 Sivas 0.38 0.46 0.16 0.18 0.19 0.23 0.20 Others 42.31 43.27 — — — — 35.11 Total 56.57 59.87 — — — — 100 Source: SYT (1994).
Table 2. Annual average SO2and PM10ambient concentrations (µg/m3)
1990 1991 1992 1993 SO2 PM10 SO2 PM10 SO2 PM10 SO2 PM10 Ankara 170 103 125 83 163 100 72 80 Bursa 185 89 224 101 181 78 133 47 Erzurum 145 87 176 98 189 129 276 159 Istanbul 241 118 284 131 247 92 204 87 Izmir 96 77 92 81 162 148 141 100 Kayseri 161 79 141 74 149 66 182 139 Sivas 260 144 193 169 197 145 269 156 WHO guideline 50 70 50 70 50 70 50 70
and cause premature death among the elderly (Ostro 1994). The air pollutants of greatest concern are carbon monoxide, hydrocarbons, sulfur oxides, nitrogen ox-ides, suspended particulate matter, lead, and secondary pollutants such as ozone. Since only PM10 and SO2
are monitored systematically in Turkey, the health effects associated with these are assessed in the next section.
Health Benefit Estimation
Epidemologic studies provide dose–response relation-ships between ambient levels of PM10 and SO2 and
health outcomes, including premature mortality (PreM), respiratory hospital admissions (RHA), emergency room visits (ERV), restricted activity days (RAD) for adults, lower respiratory illness (LRI) for children, asthma attacks, and chronic diseases. The studies, which have found statistically significant relationships between mea-sures of PM10 and SO2 and these health effects have
been conducted in several different cities and seasons and thus incorporated a wide range of climates and populations.
Studies linking PM10to mortality indicated that a 10
µg/m3change in PM
10resulted in an increased PreM of
0.31%–1.49%, with a mean value of 0.96% (Ostro 1992, 1993; Schwartz 1991; Pope 1992). Plagiannakos and Parker (1988) found a statistically significant relation-ship between the incidence of hospital admissions due to respiratory diseases (RHA) and ambient sulfate levels. Samet and others (1981) analyzed the relation-ship between ERV and air pollution levels. A regression analysis was performed and daily ERV were regressed on maximum temperature and each of the pollutants in separate runs. The study results indicated that the PM10
and SO2 coefficients were statistically significant and
highly correlated to the daily ERV. Restricted activity
days (RAD) include days spent in bed, days missed from work, and other days when activities are significantly restricted due to illness. Ostro (1983) identified a statistically significant relationship between PM10level
and RAD. The study of Dockery and others (1989) related PM10 and SO2 levels to chronic cough and
bronchitis in children.
Furthermore, studies indicated that SO2, acting alone
or as a surrogate for other sulfur-related species, is associated with increased risk of mortality (Derriennic 1989, Chinn 1989, Krzyzanowski 1982, Hatzakis 1986). Studies that provide evidence of the SO2effect on the
respiratory system include Charpin and others (1988), Bates and Sizto (1983), Ponka (1990), Dodge (1985), and Schwartz and others (1988).
Ostro (1994) used these studies to generate dose– response information and formulated the health im-pact of a pollutant as follows:
dHi5 bip POPip dA
where dHiis the change in population risk of health
effect i; biis the slope from the dose–response curve;
POPiis the population at risk of health effect i; dA is the
change in air pollution under consideration; and i is the health effect, i.e., PM, RHA, ERV, RAD, and LRI.
Here, as in other studies, the same dose–response coefficients are adopted to assess the health impacts of SO2and PM10for the Turkish urban population. This
study, like other similar studies on other countries, does not take individual defensive actions into account (i.e., immunization) and does not consider market losses associated with sickness such as pain and suffering.
Health and Economic Costs—Results
The health effects associated with the PM10and SO2
abatement are computed based on the medium dose– Table 3. Municipalities by type of fuel for heating and the 56–100% utilization ratio of fuel, 1990 and 1993
Total municipality Local lignite Imp. lignite Coke NG Gas Fuel oil Wood Dried dung
1990 1993 1990 1993 1990 1993 1990 1993 1990 1993 1990 1993 1990 1993 1990 1993 1990 1993 Ankara 50 59 31 27 9 11 0 — 0 2 0 — 0 — 2 2 1 5 Bursa 46 53 13 19 1 3 0 — 0 2 0 — 0 — 18 16 0 — Erzurum 32 39 9 5 0 4 2 1 0 — 0 — 1 — 4 7 7 3 Istanbul 48 78 32 38 0 2 0 2 0 3 0 — 0 1 8 6 0 — Izmir 68 84 47 55 0 3 1 1 0 — 0 — 0 — 23 11 1 1 Kayseri 59 62 14 7 0 8 2 6 0 — 0 — 0 — 4 4 6 11 Sivas 37 37 17 19 0 — 0 — 0 — 0 — 0 — 1 3 0 2
Imp., imported; NG, natural gas.
response coefficients (bi) depicted in Table 4. The
population at risk (POPi) is reported in Table 1. The
abatement levels (dA) that are needed to reach WHO guidelines are shown in Table 5.
The values of Table 5 are computed based on Table 2. For example, the ambient concentration of SO2
in Ankara in 1990 needed to be reduced by 120 µg/m3
(dA5 170-50) according to the WHO guideline. The levels of PreM, RHA, ERV, RAD, LRI, and respira-tory symptoms (RS) are computed. The estimates of health effects achieved from reaching WHO guide-lines for PM10and SO2levels are provided in Tables 6
and 7.
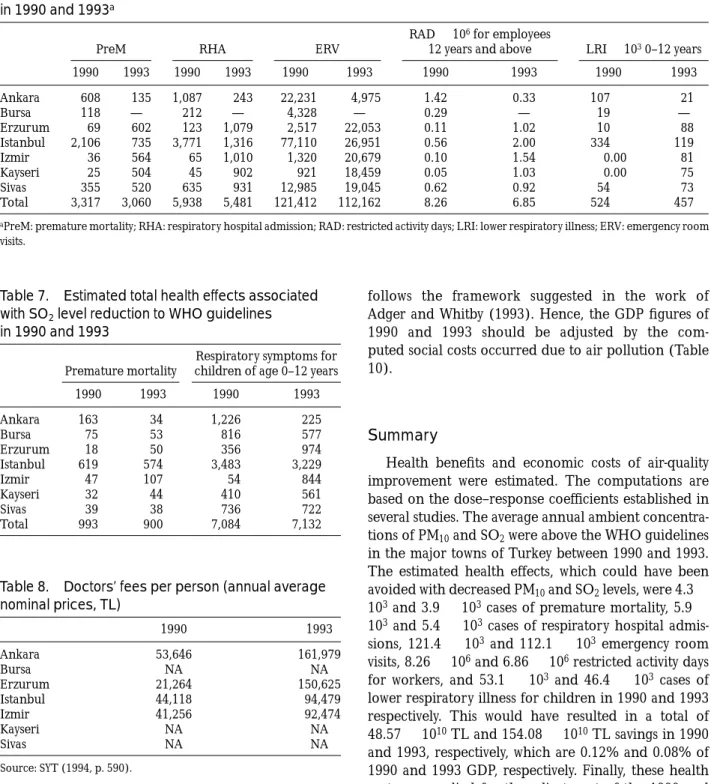
The results indicate that if annual PM10 were
re-duced to the WHO guideline (70 µg/m3) this could
have reduced premature mortalities by 3317 and 3060 in 1990 and 1993, respectively. Furthermore, it could have reduced RHA by 5938 and 5481 and ERV by 121,412 and 112,162 in 1990 and 1993, respectively. While assessing RAD for employees 12 years old and above, the results show that the required abatement could have avoided 8.26 and 6.85 million working days loss. The LRI for children 0–12 years old could have been decreased by 524,000 and 457,000 in 1990 and 1993, respectively.
Table 7 depicts the estimated health effects
associ-ated with SO2levels measured in 1990 and 1993. If the
SO2 levels were reduced to the WHO guideline (50
µg/m3), this could have brought a reduction of 993 and
900 cases of premature mortality and 7080 and 7130 respiratory symptoms among children age 0–12 years in 1990 and 1993, respectively.
Economic Evaluation and GDP Adjustment
The direct annual loss of output caused by absentee-ism arising from air pollution is computed by multi-plying estimates of days lost in 1990 and 1993 due to sickness by the average daily wages. These average daily wages were 28,585 and 130,063 Turkish lira (TL) in urban areas for 1990 and 1993, respectively (SYT 1994). To attach an economic value to RHA, the annual average prices of doctors’ fees were used (Table 8). The ERV fees were based on those of private hospitals, which were 167,640 TL/visit/person and 480,000 TL/visit/person in 1990 and 1993, respec-tively.
Information on doctors’ fees in Bursa, Kayseri, and Sivas, were unavailable, so we used the closest city’s prices: the Istanbul price was used for Bursa, and the Erzurum price was used for Kayseri and Sivas.
The results indicate that a decrease in PM10and SO2
levels to WHO guidelines would have resulted in a total of 48.303 3 1010TL and 153.383 1010 TL savings in
1990 and 1993, respectively (Table 9). The health cost is estimated to be 0.12% and 0.08% of 1990 and 1993 GDP, respectively. This is rather low when compared to the health costs estimated for the UK (1% of GNP) in 1993 (Pearce 1996). However, these study results were based not only on morbidity costs but also on mortality cost. Therefore, the results are not fully comparable.
In the early 1990s, the United Nations Statistical Office (UNSTAT) developed a framework for preparing Table 4. Estimated increment in annual health effects associated with unit change in PM10
and SO2levels (bivalues)a
PM10(µg/m3) SO2(µg/m3)
PreM/100,000 RHA/100,000 ERV/100,000 RAD/person LRI/child PreM/100,000 RS/1,000 children
Low 0.45 0.66 12.83 0.040 0.0008 0.02 0.010
Medium 0.67 1.2 23.54 0.058 0.0016 0.05 0.018
High 0.91 1.56 34.25 0.090 0.0024 0.12 0.026
Source: Ostro (1994).
aPreM: premature mortality; RHA: respiratory hospital admission; RAD: restricted activity days; LRI: lower respiratory illness; ERV: emergency room
visits; RS: respiratory symptoms.
Table 5. Abatement levels of SO2and PM10needed
to reach WHO guidelines (µg/m3)
1990 (dA) 1993 (dA) SO2 PM10 SO2 PM10 Ankara 120 33 22 10 Bursa 135 19 83 — Erzurum 95 17 226 89 Istanbul 191 48 154 17 Izmir 46 7 91 30 Kayseri 111 9 132 69 Sivas 210 74 219 86
a system of integrated environmental and economic accounts (SEEA). A preliminary version of the frame-work was tested in Mexico and Papua New Guinea (Lutz 1993). Depreciation of man-made, natural, social, and human capital was also covered in several other studies (Anielski 1992, Grobecker and Weber 1993, Repetto and others 1989, de Haan 1993). This study
follows the framework suggested in the work of Adger and Whitby (1993). Hence, the GDP figures of 1990 and 1993 should be adjusted by the com-puted social costs occurred due to air pollution (Table 10).
Summary
Health benefits and economic costs of air-quality improvement were estimated. The computations are based on the dose–response coefficients established in several studies. The average annual ambient concentra-tions of PM10and SO2were above the WHO guidelines
in the major towns of Turkey between 1990 and 1993. The estimated health effects, which could have been avoided with decreased PM10and SO2levels, were 4.33
103and 3.93 103cases of premature mortality, 5.93
103and 5.4 3 103cases of respiratory hospital
admis-sions, 121.4 3 103 and 112.13 103 emergency room
visits, 8.263 106and 6.863 106restricted activity days
for workers, and 53.1 3 103 and 46.4 3 103 cases of
lower respiratory illness for children in 1990 and 1993 respectively. This would have resulted in a total of 48.573 1010TL and 154.083 1010TL savings in 1990
and 1993, respectively, which are 0.12% and 0.08% of 1990 and 1993 GDP, respectively. Finally, these health costs are applied for the adjustment of the 1990 and 1993 GDPs. These estimated costs are lower compared with the UK study, in which both the morbidity and mortality costs are estimated. The complete GDP adjust-ment will still require estimation of the total economic value of the natural resources and environmental ser-vices existing in Turkey that support the economic activity of the country. Hence, besides the health Table 6. Estimated total health effects associated with PM10level reduction to WHO guidelines
in 1990 and 1993a
PreM RHA ERV
RAD3 106for employees
12 years and above LRI3 1030–12 years
1990 1993 1990 1993 1990 1993 1990 1993 1990 1993 Ankara 608 135 1,087 243 22,231 4,975 1.42 0.33 107 21 Bursa 118 — 212 — 4,328 — 0.29 — 19 — Erzurum 69 602 123 1,079 2,517 22,053 0.11 1.02 10 88 Istanbul 2,106 735 3,771 1,316 77,110 26,951 0.56 2.00 334 119 Izmir 36 564 65 1,010 1,320 20,679 0.10 1.54 0.00 81 Kayseri 25 504 45 902 921 18,459 0.05 1.03 0.00 75 Sivas 355 520 635 931 12,985 19,045 0.62 0.92 54 73 Total 3,317 3,060 5,938 5,481 121,412 112,162 8.26 6.85 524 457
aPreM: premature mortality; RHA: respiratory hospital admission; RAD: restricted activity days; LRI: lower respiratory illness; ERV: emergency room
visits.
Table 7. Estimated total health effects associated with SO2level reduction to WHO guidelines
in 1990 and 1993
Premature mortality
Respiratory symptoms for children of age 0–12 years
1990 1993 1990 1993 Ankara 163 34 1,226 225 Bursa 75 53 816 577 Erzurum 18 50 356 974 Istanbul 619 574 3,483 3,229 Izmir 47 107 54 844 Kayseri 32 44 410 561 Sivas 39 38 736 722 Total 993 900 7,084 7,132
Table 8. Doctors’ fees per person (annual average nominal prices, TL) 1990 1993 Ankara 53,646 161,979 Bursa NA NA Erzurum 21,264 150,625 Istanbul 44,118 94,479 Izmir 41,256 92,474 Kayseri NA NA Sivas NA NA Source: SYT (1994, p. 590).
costs, pollution abatement and other damage costs should be accounted for together with the economic value of environmental services supporting the Turkish economy.
Literature Cited
Adger, W. N., and M. Whitby. 1993. National resource account-ing in the land-use sector: Theory and practice in Europe.
Review of Agricultural Economics 20:77–97.
Anielski, M. 1992. Resource accounting: Indicators of the sustainability of Alberta’s forest resources. Paper presented to the International Society of Ecological Economics Confer-ence, Stockholm.
AMIS (Annual Manufacturing Industry Statistics). 1990. State Institute of Statistics, Prime Ministry, Republic of Turkey, Ankara.
Bates, D. V., and R. Sizto. 1983. Air pollution and hospital admissions in southern Ontario: The acid haze effect.
Environmental Resources 43:317–331.
Berkes, F., and C. Folke. 1992. A system perspective on the interrelations between natural, human-made and cultural capital. Ecological Economics 5:1–8.
Charpin, D., J. P. Kleisbauer, J. Fondarai, P. Graland, A. Viala, and F. Gouezo. 1988. Respiratory symptoms and air pollu-tion changes in children: The Gardanne coal-basin study.
Archives of Environmental Health 43:22–27.
Chinn, S. V., I. Florey, G. Baldwin, and M. Gorgol. 1989. The relation of mortality in England and Wales 1969–73 to measurements of air pollution. Journal of Epidemiology
Commu-nity Health 35:174–179.
de Haan, M., S. J. Keunin, and P. Bosch. 1993. Integrating indicators in a national accounting matrix including environ-mental accounts (NAMEA). NA 060. Central Bureau of Statistics, Voorburg.
Derriennic, F., S. Richardson, A. Mollie, and J. Lellouch. 1989. Short-term effects of sulfur dioxide pollution on mortality in two French cities. International Journal of Epidemiology 18:186– 280.
Dockery, D. W., F. E. Speizer, and D. O. Stram. 1989. Effects of inhalable particles on respiratory health of children.
Ameri-can Review of Respiratory Diseases 139:587–597.
Dodge, R., P. Solomon, J. Moyers, and C. Hayes. 1985. A longitudinal study of children exposed to sulfur oxides.
American Journal of Epidemiology 121:720–736.
Hatzakis, A., K. Katsouyanni, A. Kalandidi, N. Day, and D. Trichopoulos. 1986. Short-term effects of air pollution on mortality in Athens. International Journal of Epidemiology 15:73–81.
Krzyzanowski, M., and B. Wojtyniak. 1982. Ten-year mortality in sample of an adult population in relation to air pollution.
Journal of Epidemiology and Community Health 36:262–268.
Grobecker, C., and J.-L. Weber. 1993. La place de la compati-bilite´ du patrimoine naturel dans les travaux de l’institut franc¸ais de l’environnement, cinqueie`me colloque de com-patibilite´ nationale de l’Association de Compatiblite´ Nation-ale, Paris, 13–15 Decembre.
Lutz, E. (ed). 1993. Toward improved accounting for the environment. The World Bank, Washington, DC.
Ostro, B. 1983. The effects of air pollution on work loss and morbidity. Journal of Environmental Economics and
Manage-ment 10:371–382.
Ostro, B. 1992. Environmental pollution and health. Lancet 340:1220–1221.
Table 9. Estimated economic cost associated with PM10and SO2level reduction to WHO guidelines
in 1990 and 1993
RAD (31010TL) RHA and ERV (3106TL)
Respiratory symptoms for children of age 0–12 years (3106TL) 1990 1993 1990 1993 1990 1993 Ankara 1.20 1.01 3,321.1 2,244.5 65.77 36.44 Bursa 1.48 — 379.2 — 43.77 93.46 Erzurum 0.37 13.50 200.1 5,302.5 7.57 146.71 Istanbul 40.57 60.07 12,136.96 12,801.6 153.66 305.07 Izmir 0.57 36.05 178.75 8,452.9 2.22 78.04 Kayseri 0.26 22.05 100.6 6,093.3 8.71 84.50 Sivas 2.12 13.15 1,097.9 39,746.2 15.65 108.75 Total 46.54 145.83 17,414.63 74,640.9 297.35 852.95
Table 10. Modified national accounts at 1990 prices (billion TL)
1990 1993
Agriculture 65,717 66,890
Industry 83,333 114,690
Services 210,099 242,378
Social costs due to
RAD 20.46 20.36
RHA and ERV 20.17 20.02
RS 20.003 20.0002
GDP (at factor cost) 359,149 423,958
Modified GDP (at factor cost) 359,148.3 423,957.6
Source: Main Economic Indicators, 1995. General Directorate of Economic Research and Assessment, Ankara—Turkey.
Ostro, B. 1993. The association of air pollution with mortality: Examining the case for inference. Archives of Environmental
Health 48:336–342.
Ostro, B. 1994. Estimating the health effects of air pollutants: A method with an application to Jakarta. Policy research working paper 1301. The World Bank, Washington, DC. Pearce, D. W. 1993. Economic values and the natural world.
MIT Press, Cambridge, Massachusetts.
Pearce, D. W. 1996. Economic valuation and health damage from air pollution in the developing world. Energy Policy 24(7):627–630.
Plagiannakos, T., and J. Parker. 1988. An assessment of air pollution effects on human health in Ontario. Ontario
Hydrology March.
Ponka, A. 1990. Absenteeism and respiratory disease among children and adults in Helsinki in relation to low-level air pollution and temperature. Environmental Resources 52: 34–46.
Pope, C. A., J. Schwartz, and M. Ransom. 1992. Daily Mortality and PM10 pollution in Utah Valley. Archives of Environmental
Health 42:211–217.
Repetto, R., W. Magrath, M. Wells, C. Beer, and F. Rossini. 1989. Wasting assets: Natural resources in the national accounts. World Resources Institute, Washington, DC. Samet, J. M., Y. Bishop, F. E. Speizer, J. D. Spengler, and B. G.
Ferris. 1981. The relationship between air pollution and emergency room visits in an industrial community. Journal of
the Air Pollution Control Association 31:236–240.
Schwartz, J. 1991. Particulate air pollution and daily mortality in Detroit. Environmental Resources 56:204–213.
Schwartz, J., V. Hasselblad, and H. Pitcher. 1988. Air pollution and morbidity: A further analysis of the Los Angeles student nurses data. Journal of the Air Pollution Control Association 38:158–162.
SYT (Statistic Yearbook of Turkey). 1994. State Institute of Statistics, Prime Ministry, Republic of Turkey, Ankara.