Department of Electrical Engineering, Koc University, 34450 Istanbul, Turkey
*
S Supporting InformationABSTRACT: Nanoelectromechanical systems (NEMS) have emerged as a promising technology for performing the mass spectrometry of large biomolecules and nanoparticles. As nanoscale objects land on NEMS sensors one by one, they induce resolvable shifts in the resonance frequency of the sensor proportional to their weight. The operational regime of NEMS sensors is often limited by the onset of nonlinearity, beyond which the highly sensitive schemes based on frequency tracking by phase-locked loops cannot be readily used. Here, we develop a measurement architecture with which to operate at the nonlinear regime and measure frequency shifts induced by analytes in a rapid and sensitive manner. We used this architecture to individually characterize the mass of gold nanoparticles and verified the results by
performing independent measurements of the same nanoparticles based on linear mass sensing. Once the feasibility of the technique is established, we have obtained the mass spectrum of a 20 nm gold nanoparticle sample by individually recording about 500 single-particle events using two modes working sequentially in the nonlinear regime. The technique obtained here can be used for thin nanomechanical structures that possess a limited dynamic range.
KEYWORDS: NEMS, nonlinear sensing, gold nanoparticles, mass spectrometry, nanoparticle detection, nanomechanical sensors
N
anoelectromechanical systems (NEMS) offer important advantages for mass-sensing applications. In the past decade, the detection of single proteins,1mass resolution at the atomic2−4and near single-Dalton level,5mass spectrometry at the single-protein level,6 and mass measurements of neutral species7have all been demonstrated. It was further shown that the information about the spatial distribution of analytes can be obtained by using multiple modes.8,9 More recently, the efficient transportation and characterization of virus capsids by NEMS sensors10have been reported. These advances suggest that NEMS-based mass spectrometry offers a competitive alternative to conventional mass spectrometry especially for analytes with molecular weight above the mega-Dalton range. A pair of aspects of NEMS devices are critical for high mass sensitivity: device miniaturization and the precise detection of the resonance frequency of the sensing structure. The former provides a strong scaling for the responsivity of the sensor,11 while the latter enables very small perturbations to be detected. However, certain limits are faced when optimizing both aspects. For example, if the device thickness is decreased to increase sensitivity, such as ultrathin NEMS12,13and graphene/carbon nanotube devices,5,14−17the linear regime of operation shrinks for out-of-plane modes.18 To preserve a large linear range, the length of the device may be scaled down as well; however, this approach comes with severe downsides, such as a decrease in the capture cross-section of analytes and transduction efficiency as well as an increase in resonance frequencies, which increases the parasitic background effects. For certain geometries and systems,18,19 even thermal fluctuations are sufficient to drive the resonator into the nonlinear regime. This decrease in the dynamic range prohibits the use of such device architectures because the common practice in thefield has been to keep the devices on resonance at the linear regime. To alleviate this limitation, many studies have sought to increase the linear dynamic range by suppressing nonlinearity.17,20−22 On the frequency detection aspect, the trend in the field has been to increase the drive power to decrease frequency noise and thereby increase the
Received: February 6, 2019 Revised: May 8, 2019 Published: May 22, 2019
mass resolution. Although amplitude noise gets converted to phase noise in the nonlinear regime and environmental-induced frequency fluctuations increase with the increasing drive levels,23 sensing in the nonlinear regime provides additional handles on the system. For instance, byfine-tuning the feedback parameters, reducing the total phase noise of the sensor (with respect to the oscillator with linear resonator case) is still possible.24,25 Moreover, as smaller sensors generate smaller signals generally, the ability to operate beyond the linear regime becomes critical to obtain a decent signal-to-noise ratio (SNR). For these reasons, operation at the nonlinear regime holds great promise for sensing applications. While the autonomous oscillator architecture offers excellent controllability,25−27 it is not always possible to build an oscillator circuit with nanomechanical devices because the signal-to-background ratio is usually small especially for smaller devices, making it difficult to satisfy Barkhausen conditions only at the mechanical resonance frequency. However, a nanomechanical resonator can be readily driven by a frequency generator; indeed, this architecture is employed commonly in the form of open-loop frequency sweep or closed-loop frequency tracking systems such as phase-locked loops (PLLs). Many of the work in the past used the open-loop response of nonlinear resonators,28−31 including a recent technique for accurate characterization of frequency fluctua-tions in the nonlinear regime.32 However, continuously sweeping the frequency in the open-loop cannot be applied effectively to the sensing of abrupt changes induced by single analytes for two reasons. First, open-loop technique requires judicious resetting of the sweep parameters every time after a particle adsorption. Second, each frequency sweep needs to be
composed of many data points for sufficient precision, which implies long sweep times; as such, the effective frequency noise increases due to long-term drift effects. Another sweep-based technique31has utilized an extended frequency span and fast sweep parameters to calculate the particle-induced frequency shifts from the change in the amplitude response; however, because this technique is not adaptive, the accumulation of analytes would eventually shift the device parameters outside the sweep region. At the MEMS scale, the bifurcation sweep techniques near the amplitude jumps are reported,33,34and the detection sensitivity in the nonlinear regime is shown to be advantageous over the linear regime for mass detection of gas molecules.35Essentially, the techniques developed so far have not been designed to track the frequency at the nonlinear bifurcation point in an adaptive, closed-loop manner and have not been used in single-entity (nanoparticle or molecule) sensing.
The main ineffectiveness for the frequency tracking in the nonlinear regime comes from the lack of a powerful and robust method such as PLL that is used for linear resonators (Figure 1a,b). Although PLLs can conveniently track resonance frequency in the linear regime, the sharp phase transition and bistable response of nonlinear resonators (Figure 1c,d) prevent locking to a single phase at the resonance. Therefore, the nonlinear regime is generally avoided for mass sensing applications, especially because performing a PLL does not look feasible in this regime.
Apart from the aforementioned issues in the closed-loop implementations, the sensing applications of nonlinear resonators have so far focused on chemical sensing in the gas phase.30,35−37Here, we have performed mass and position
Figure 1.Linear and nonlinear responses of the NEMS resonator. (a, b) In the linear regime, a sharp phase transition is observed with the quality factor of 12 000. A 0° crossing in phase can be used as a reference target for PLL. The inset shows the SEM image of a typical doubly clamped beam resonator used in the experiments. The scale bar is 3μm. (c, d) The resonator acts as an ideal Duffing resonator with a positive Duffing term when it is driven with larger excitations. Nonlinear phase jumps are observed depending on the sweep direction (blue and orange data points for the sweep from left to right and from right to left, respectively). fupand fdownfrequencies are defined at the boundaries of the hysteresis window. In the colored area, the resonator shows a bistable response. The 0° phase cannot be locked with the PLL because it is in the unstable region of the nonlinear response.
sensing of single nanoparticles with the first two resonance modes by developing a robust technique to track the resonance frequencies in the nonlinear regime. We have achieved 10−6 Allan deviations at about 1 s response time and collected about 500 single-nanoparticle events and obtained the mass spectra of a 20 nm gold nanoparticle sample.
The device we used in the experiments is a 20μm long, 320 nm wide, and 100 nm thick stoichiometric SiN device (with a film stress of ∼800 MPa) reported earlier.38
In its linear regime, the phase response shows a sharp yet smooth transition (Figure 1b), which can be used as the reference target of a PLL circuit. When it is driven to the nonlinear regime though, it behaves as a Duffing resonator with stiffening nonlinearity,39 and hysteresis emerges as two different branches are observed depending on the sweep direction. More importantly, two sharp transitions (with theoretically infinite slope) in the amplitude (Figure 1c) and phase (Figure 1d) are observed. The transition at the higher frequency is denoted as fupwhen sweeping from left to right, and the one at
the lower frequency is denoted as fdown when sweeping from right to left. As shown before,32these transition frequencies are related to the resonance frequency and effective mass of the structure. Therefore, continuously tracking either of these frequencies can be used to detect single particles landing on the structure. However, an architecture based on sweeping the frequency with an open loop configuration results in a slow response time, and the corresponding Allan deviation degrades due to long-term drift effects. Alternatively, building a feedback loop is very challenging due to the infinite slope at these transition frequencies.
To overcome this problem, we aimed to keep the sensor trapped inside the hysteresis window of the phase response (Figure 1d) rather than locking to a single phase. Boundaries of the hysteresis window are defined as the points where the
sharp frequency jumps ( fup and fdown) occur. At the upper boundary, phase jumps from point C to D on the curve in
Figure 1d, and that at the lower boundary phase jumps from point A to B. Therefore, any controller that tries to lock to a target phase at the sensitive jump frequencies cannot succeed because noise would push the PLL out of the operation point. However, the jump frequencies can be used for keeping the system circulating inside the hysteresis window.
To understand the method, we consider the nonlinear resonator with the phase response given in Figure 1d. We assume that there is a feedback controller with the target phase at 0°; none of the stable branches shown inFigure 1d contains this point, and indeed, this point lies only on the unstable branch of the resonator (not shown inFigure 1c,d). Hence, it is not accessible within this measurement architecture. The controller cannot keep the system locked at 0°; however, a different dynamic emerges under these conditions. Whenever the phase has a positive value, the controller will increase the driving frequency, and whenever the phase has a negative value, the controller will decrease the driving frequency. For this reason, starting from a random point, the controller will first push the system to the boundary of the window (i.e., until when the drive frequency is either fupor fdown, depending on the initial condition). After passing through either of the jump frequencies ( fupor fdown), the sign of the phaseflips; therefore,
the controller action reverses automatically, and the system now starts traversing the other branch in the opposite direction. In effect, the system continuously circulates within the hysteresis window (Figure 1d), automatically tracing the boundary defined by the two jump frequencies. Although the control system is similar to the PLL, no phase is locked in this system; therefore, we cite the proposed method as a trajectory-locked loop (TLL) for the convenience.
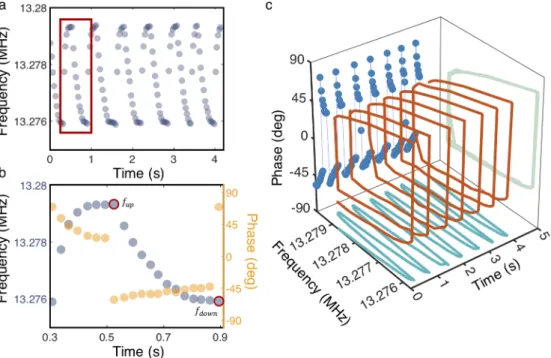
Figure 2.Trajectory locked loop (TLL). (a) The controller is adjusted for highly sensitive measurements of bifurcation frequencies. Circle data points show the frequency sweep steps, which becomes denser while getting closer to the boundaries. (b) The one full cycle indicated with a red rectangle in panel a is maximized and plotted with the corresponding phase response. It is possible to extract fupand fdownat the points where the phase jumps with a near infinite slope as they are indicated with red circles. For the given case, notice that one cycle approximately takes 0.6 s, which is comparable with many of the PLLs used in thisfield. (c) The projection of the TLL over time is displayed. It can be clearly seen that the TLL holds the nonlinear resonator inside the hysteresis window.
TLL can be used to analyze frequency fluctuations of the nonlinear bifurcation points. During one cycle of TLL, it is possible to extract the values of both fupand fdownby looking at the sign of the derivative of the frequency with respect to time (Figure 2a,b). As demonstrated in Figure 2b, fup can be
identified as the point where the derivative changes sign from positive to negative and vice versa for fdown. Figure 2c shows
TLL operation in both phase and frequency domains. The phase response of the nonlinear resonator passes through a similar trajectory over time and keeps the system inside the hysteresis window, as can be seen at the projection of the frequency-phase plane. Projection of the data onto the phase-time plane clearly illustrates the phase jumps at the boundaries of the bi-stable regime.
The speed and precision to estimate the frequencies at bifurcation points in one TLL cycle depend on the controller architecture. The feedback controller has the same nominal set point for TLL and PLL. However, the dynamics on which they operate are different: thus, the phase error in TLL systems will always oscillate between high positive and negative values due to phase jumps. Therefore, extra cautions should be taken for the design of TLL controllers. For example, the integration controller over phase error to determine the frequency step, which will be added to former drive frequency is used to prevent offset in PLLs, causes overshoots for capturing bifurcation points for TLLs. If we consider the lower bound of one TLL cycle where the phase is negative and the controller steers the frequency from right to left, the error will accumulate with the integration controller action (with respect to phase error), and just as the bifurcation point is passed, the accumulated error will still try to keep the same controller direction (whereas the direction should change). The same situation holds for the upper bound; consequently, we found that the integrative controller, an essential part of PLLs, causes overshoots on the frequency measurements for TLLs. To increase the precision of the controller while detecting the bifurcation frequencies, we used the threshold phase values at the boundaries of the unstable regime (points C and A in
Figure 1b) for the error calculation. The controller is designed to adjust the frequency steps proportional to its distance from the boundaries of the hysteresis window, as is evident inFigure 2b. In other words, when the phase of the resonator comes
closer to one of the bifurcation thresholds, frequency steps between each sweep are decreased to reduce the offset error. Moreover, a larger step size while the resonator is away from the jump points increases the speed of the operation. In this way, accurate and fast measurements for fup and fdown are
achieved. InFigure 2a, these 2 frequencies are measured with an average time of 600 ms, which is sufficiently short to avoid drift effects. The speed of the TLL can be adjusted for smaller integration times, and we demonstrate TLLs with∼35 ms loop time in section 2 of the Supporting Information; we also provide more details on TLL operation.
After showing that the TLL can track the bifurcation frequencies, we further used it to characterize the frequency fluctuations of the first two modes by calculating Allan deviations in the nonlinear regime. The ability to operate in nonlinear regime provides a wide range of drive powers to be applied for the actuation of the resonator. Therefore, we calculated Allan deviations of thefirst two modes at different power levels tofind the appropriate drive for the mass-position sensing of 20 nm gold nanoparticles (section 3 of the Supporting Information and Figures S4−S6). The Allan deviations at the chosen level of the nonlinear drive for the lower bifurcation frequencies ( fdown) of thefirst two modes are determined as 1.5× 10⁻⁶and 1.45× 10⁻⁶, respectively, for the chosen TLL response time of 2 s, which corresponds to a mass resolution of∼1.5 MDa (for a particle that lands at the optimal sensing position, i.e., the antinode of the corresponding mode). When we use doubly-clamped beams for single nanoparticle detection, we need to measure the analyte-induced frequency shifts of thefirst two modes.6,40,41However, exciting the two modes simultaneously poses a challenge because intermodal coupling,38,42−45 which may interfere with analyte-induced frequency changes, becomes more pronounced as the mode amplitudes reach nonlinear regime. Thus, extra care is needed for two-mode sensing with nonlinear resonators. To minimize the interference of coupling effects between the modes, we use TLL sequentially as it is demonstrated in Figure 3a. In this method, as one full cycle is completed inside the hysteresis window for the first mode (meaning that f1
upand f1down are
detected), another cycle starts for the second mode (so that
f2
upand f2down are detected next). We note that, to avoid time
Figure 3.Gold nanoparticle (GNP) sensing with sequential TLL. (a) First and second resonance modes are tracked by TLL sequentially to minimize coupling between two nonlinear modes. After one mode completes the one full cycle inside the hysteresis window, the other mode is driven by TLL. (b) The frequency shifts due to individual GNP deposition. Each GNP adsorption causes frequency shifts in both modes, which emerge as sudden shifts in the trajectories (inset).
delays due to power switching between modes during the sequential TLL operation, the inactive mode continues to be driven at the constant frequency, which is close to the end frequency of its previous TLL cycle. As the cyclefinishes at the lower bound, the inactive mode stays on the low-amplitude branch while the active mode circulates inside its TLL cycle. Thus, the effect of the intermodal coupling on the measure-ments is minimized.
The frequency shift caused by an analyte is expected to be larger in the nonlinear regime than its counterpart in the linear regime.32,46However, the normalized frequency shift (absolute frequency shift over the resonance frequency) due to an analyte is expected to be the same in both cases. To verify this equality, we have built a measurement system to sequentially switch between the linear and nonlinear operations; therefore, the frequency shifts from the same nanoparticle can be directly compared with each other. As expected from the theory, the fractional frequency shifts measured by both techniques had resulted in essentially the same values within the measurement uncertainty (section 4 of the Supporting Information and
Figure S5). Once the feasibility of the technique is thus established, we have used our sensor to characterize a commercially available 20 nm gold nanoparticle solution (Sigma-Aldrich product no. 741965). Mass spectrometry of the individual gold nanoparticles is performed by using the matrix-assisted laser desorption ionization (MALDI) method.6
Figure 3b demonstrates the snapshot of the two-mode sequential TLL data during the MALDI deposition of gold nanoparticles. Although it looks very similar to the PLL data at first glance, the inset discloses the curved TLL data traces.
For the validation of the proposed method for mass sensing, we used normalized frequency shift of the lower bifurcation point ( fdown) because it has a smaller noise level (as expected
from ref 32 and also shown in the Supporting Information). Because the normalized frequency shifts in nonlinear regime are shown to be same with the linear sensing, the earlier formulation for converting two-mode frequency shifts to the mass and position values6,40may directly be reused in this case. In Figure 4, we present the mass spectra for 500 gold nanoparticles with a nominal diameter of 20 nm (12% dispersion in size) obtained by projecting the individual mass
distributions onto the mass and diameter planes. For the mass measurements, the peak with maximum probability density is found at 57.25 MDa, which corresponds to a diameter of 20.84 nm. The mean value of the gold nanoparticle sample is measured as 26.14 nm with a standard deviation of 5.73 nm. As is evident from the mass spectrum, as well as the SEM image shown inFigure S11, a small portion of the nanoparticles have coalesced either in the solution or on the MALDI plate. For this reason, the mass distribution shows a fat tail with a few outliers on the high end of the spectrum with a combined effect of shifting the statistical average of the mass distribution to a value higher than the nominal value. The mass spectrum of the same GNP sample was also obtained with NEMS working in the linear regime under PLL. Both techniques resulted in very similar mass spectrum graphs. The sample mean and standard deviation in each case were very similar (section 5 of the Supporting Information).
We also note that another advantage of using nonlinear resonators for mass sensing is to increase the maximum measurable frequency shifts compared to PLL. In PLL, frequency shifts larger than half the bandwidth of the resonator induces a phase response outside the resonance feature and causes the controller to lose the phase-locking and frequency traction. In earlier experiments, e.g., with carbon nanotubes, such occurrences were observed.5 For the TLL, however, the acquisition range for the controller is augmented by the width of the hysteresis window. Therefore, the maximum measurable mass increases as the sensor is operated deeper inside the nonlinear regime. Although the noise floor also increases in this regime, the dynamic range for mass detection (maximum and minimum detectable masses) keeps increasing. Actually, the largest events in the mass spectra would not have been measurable with a PLL because the induced frequency shifts were larger than the linear bandwidth of the sensor (section 5 of the Supporting Information).
In this work, we present a rapid and accurate method with a feedback controller for trapping the nonlinear resonator alongside the regime of bistability (TLL). With this technique, we can conveniently and precisely track the bifurcation frequencies. Later, we use TLL to characterize the frequency instabilities at these bifurcation points for different averaging
Figure 4.(a) Mass spectrometry of 20 nm gold nanoparticles. (b) Diameter is calculated with the bulk density of gold, ρAu = 19.3 g
cm3. Orange-shaded regions illustrate the detection criterion due to frequencyfluctuations of the nonlinear resonator used in the experiments (by assuming the responsivity of thefirst mode and considering a particle landing at the very center).
absent in the nonlinear region until now. We demonstrated that a feedback controller similar to PLL, but circulating between two points rather than locking onto a point, can be used for reliable frequency tracking in nonlinear response.
NEMS resonators have been shrinking in size, a trend that will result in a reduced, and even nonexistent, linear dynamic range. The performance of inherently nonlinear resonators for single-particle and single-molecule detection is still unknown due to the lack of robust techniques for enabling nonlinear frequency tracking. Our method can be deployed on such systems rather effortlessly and help us further analyze the potential of nonlinearity in NEMS sensors. Moreover, the applicability of the method is not limited to the mechanical resonators because it can be adjusted to any Duffing resonator.
■
ASSOCIATED CONTENT*
S Supporting InformationThe Supporting Information is available free of charge on the
ACS Publications website at DOI: 10.1021/acs.nano-lett.9b00546.
Additional details on the experimental setup, TLL operation, measured frequencyfluctuations for the two modes used for sensing, analysis on particle induced frequency shifts in nonlinear regime, the extension of mass dynamic range, and Matlab code;figures showing SEM images, an actuation and detection scheme, phase responses, controller design, TLL operation, jump frequencies, time traces, frequency instabilities and shifts, PLL results, and mass spectra; tables showing fractional frequency shifts, and results from linear and nonlinear mass spectra (PDF)
■
AUTHOR INFORMATION Corresponding Author *E-mail:[email protected]. ORCID Alper Demir:0000-0002-1927-3960 M. Selim Hanay:0000-0002-1928-044X Present Address⊥Department of Mechanical Engineering, Boston University,
233 Bay State Road, Boston, MA 02215, United States
Author Contributions
The manuscript was written through contributions of all authors. All authors have given approval to thefinal version of the manuscript. M.Y. conceived of the idea. M.Y., M.S.H., and
Karakurt for their help in TLL measurements. We thank Murat Yagci (METU MEMS) for help with wire bonding.
■
REFERENCES(1) Naik, A. K.; Hanay, M. S.; Hiebert, W. K.; Feng, X. L.; Roukes, M. L. Nat. Nanotechnol. 2009, 4 (7), 445−450.
(2) Jensen, K.; Kim, K.; Zettl, A. Nat. Nanotechnol. 2008, 3 (9), 533. (3) Chiu, H.-Y.; Hung, P.; Postma, H. W. C.; Bockrath, M. Nano Lett. 2008, 8 (12), 4342−4346.
(4) Lassagne, B.; Garcia-Sanchez, D.; Aguasca, A.; Bachtold, A. Nano Lett. 2008, 8 (11), 3735−3738.
(5) Chaste, J.; Eichler, A.; Moser, J.; Ceballos, G.; Rurali, R.; Bachtold, A. Nat. Nanotechnol. 2012, 7 (5), 301.
(6) Hanay, M. S.; Kelber, S.; Naik, A. K.; Chi, D.; Hentz, S.; Bullard, E. C.; Colinet, E.; Duraffourg, L.; Roukes, M. L. Nat. Nanotechnol. 2012, 7 (9), 602−608.
(7) Sage, E.; Brenac, A.; Alava, T.; Morel, R.; Dupré, C.; Hanay, M. S.; Roukes, M. L.; Duraffourg, L.; Masselon, C.; Hentz, S. Nat. Commun. 2015, 6, 6482DOI: 10.1038/ncomms7482.
(8) Hanay, M. S.; Kelber, S. I.; O’Connell, C. D.; Mulvaney, P.; Sader, J. E.; Roukes, M. L. Nat. Nanotechnol. 2015, 10 (4), 339−344. (9) Sader, J. E.; Hanay, M. S.; Neumann, A. P.; Roukes, M. L. Nano Lett. 2018, 18 (3), 1608−1614.
(10) Dominguez-Medina, S.; Fostner, S.; Defoort, M.; Sansa, M.; Stark, A.-K.; Halim, M. A.; Vernhes, E.; Gely, M.; Jourdan, G.; Alava, T.; Boulanger, P.; Masselon, C.; Hentz, S. Science 2018, 362 (6417), 918−922.
(11) Li, M.; Tang, H. X.; Roukes, M. L. Nat. Nanotechnol. 2007, 2 (2), 114−120.
(12) Zaghloul, U.; Piazza, G. In 10−25 nm Piezoelectric Nano-Actuators and NEMS Switches for Millivolt Computational Logic; 26th IEEE International Conference for Micro Electro Mechanical Systems; IEEE: Piscataway, NJ, 2013; pp 233−236.
(13) Ivaldi, P.; Abergel, J.; Matheny, M.; Villanueva, L.; Karabalin, R.; Roukes, M.; Andreucci, P.; Hentz, S.; Defaÿ, E. J. Micromech. Microeng. 2011, 21 (8), 085023.
(14) Bunch, J. S.; Van Der Zande, A. M.; Verbridge, S. S.; Frank, I. W.; Tanenbaum, D. M.; Parpia, J. M.; Craighead, H. G.; McEuen, P. L. Science 2007, 315 (5811), 490−493.
(15) Chen, C.; Rosenblatt, S.; Bolotin, K. I.; Kalb, W.; Kim, P.; Kymissis, I.; Stormer, H. L.; Heinz, T. F.; Hone, J. Nat. Nanotechnol. 2009, 4 (12), 861.
(16) Eichler, A.; Moser, J.; Chaste, J.; Zdrojek, M.; Wilson-Rae, I.; Bachtold, A. Nat. Nanotechnol. 2011, 6 (6), 339.
(17) Samanta, C.; Arora, N.; Naik, A. Appl. Phys. Lett. 2018, 113 (11), 113101.
(18) Postma, H. C.; Kozinsky, I.; Husain, A.; Roukes, M. Appl. Phys. Lett. 2005, 86 (22), 223105.
(19) Gieseler, J.; Novotny, L.; Quidant, R. Nat. Phys. 2013, 9 (12), 806.
(20) Kacem, N.; Arcamone, J.; Perez-Murano, F.; Hentz, S. J. Micromech. Microeng. 2010, 20 (4), 045023.
Chiu, G. T.-C.; Rhoads, J. F. Appl. Phys. Lett. 2011, 98 (15), 153510. (29) Harne, R.; Wang, K. Appl. Phys. Lett. 2013, 102 (20), 203506. (30) Venstra, W. J.; Capener, M. J.; Elliott, S. R. Nanotechnology 2014, 25 (42), 425501.
(31) Sansa, M.; Nguyen, V. N.; Baguet, S.; Lamarque, C.-H.; Dufour, R.; Hentz, S. In Real Time Sensing in the Non Linear Regime of NEMS Resonators; 29th IEEE International Conference for Micro Electro Mechanical Systems; IEEE: Piscataway, NJ, 2016.
(32) Maillet, O.; Zhou, X.; Gazizulin, R. R.; Ilic, R.; Parpia, J. M.; Bourgeois, O.; Fefferman, A. D.; Collin, E. ACS Nano 2018, 12, 5753. (33) Requa, M. V.; Turner, K. L. Appl. Phys. Lett. 2007, 90 (17), 173508.
(34) Burgner, C.; Miller, N.; Shaw, S.; Turner, K. In Parameter Sweep Strategies for Sensing Using Bifurcations in MEMS; Solid-State Sensor, Actuator, and Microsystems Workshop, Hilton Head Workshop: Hilton Head Island, SC, 2010.
(35) Yie, Z.; Zielke, M. A.; Burgner, C. B.; Turner, K. L. J. Micromech. Microeng. 2011, 21 (2), 025027.
(36) Rhoads, J. F.; Shaw, S. W.; Turner, K. L. J. Dyn. Syst., Meas., Control 2010, 132 (3), 034001.
(37) Bouchaala, A.; Jaber, N.; Yassine, O.; Shekhah, O.; Chernikova, V.; Eddaoudi, M.; Younis, M. Sensors 2016, 16 (6), 758.
(38) Arı, A. B.; Karakan, M. Ç.; Yanık, C.; Kaya, İ. İ.; Hanay, M. S. Phys. Rev. Appl. 2018, 9 (3), 034024.
(39) Lifshitz, R.; Cross, M. Review of nonlinear dynamics and complexity 2008, 1, 1−52.
(40) Dohn, S.; Svendsen, W.; Boisen, A.; Hansen, O. Rev. Sci. Instrum. 2007, 78 (10), 103303.
(41) Schmid, S.; Dohn, S.; Boisen, A. Sensors 2010, 10 (9), 8092− 8100.
(42) Matheny, M.; Villanueva, L.; Karabalin, R.; Sader, J. E.; Roukes, M. Nano Lett. 2013, 13 (4), 1622−1626.
(43) Westra, H.; Poot, M.; Van Der Zant, H.; Venstra, W. Phys. Rev. Lett. 2010, 105 (11), 117205.
(44) Eichler, A.; del Álamo Ruiz, M.; Plaza, J.; Bachtold, A. Phys. Rev. Lett. 2012, 109 (2), 025503.
(45) Truitt, P.; Hertzberg, J.; Altunkaya, E.; Schwab, K. J. Appl. Phys. 2013, 114 (11), 114307.
(46) Dai, M. D.; Eom, K.; Kim, C.-W. Appl. Phys. Lett. 2009, 95 (20), 203104.