Journal of Physics: Condensed Matter
PAPER
The compressibility of high purity Y bB
2
To cite this article: B Kalkan et al 2012 J. Phys.: Condens. Matter 24 345401
View the article online for updates and enhancements.
Related content
Structural study of alpha-Bi2O3 under pressure
A L J Pereira, D Errandonea, A Beltrán et al.
-Structural phase transitions in EuFe2As2 superconductor at low temperatures and high pressures
Walter O Uhoya, Georgiy M Tsoi, Yogesh K Vohra et al.
-High-pressure phase transition of Bi2Fe4O9
Alexandra Friedrich, Jasmin Biehler, Wolfgang Morgenroth et al.
J. Phys.: Condens. Matter 24 (2012) 345401 (6pp) doi:10.1088/0953-8984/24/34/345401
The compressibility of high purity YbB
2
B Kalkan
1, S Suzer
2and E Ozdas
31Advanced Light Source, Lawrence Berkeley Laboratory, Berkeley, CA 20015, USA 2Department of Chemistry, Bilkent University, Ankara 06800, Turkey
3Department of Physics Engineering, Hacettepe University, Beytepe, Ankara 06800, Turkey
E-mail:[email protected]
Received 19 March 2012, in final form 11 July 2012 Published 31 July 2012
Online atstacks.iop.org/JPhysCM/24/345401
Abstract
The compressibility and phase stability of YbB2are investigated under high pressure using
high-resolution synchrotron x-ray diffraction in a diamond anvil cell. The bulk modules of high purity YbB2is obtained as ∼182 GPa using the Birch–Murnaghan equation of state. The
patterns measured up to 20 GPa and the pressure dependence of normalized lattice parameters, a/a0and c/c0, reveal that the compressibility of YbB2is low and fairly isotropic, and this
material can be classified as a hard material. X-ray photoemission studies demonstrate that Yb in YbB2has a mostly trivalent valence state at room temperature. Moreover, sample
preparation details provide a new insight into the high purity synthesis of YbB2at ambient
pressure and moderate temperatures. The presented structural and compressibility results are in agreement with the available theoretical and experimental data on binary rare-earth borides and can serve as a reliable reference for future studies.
(Some figures may appear in colour only in the online journal)
1. Introduction
Durable coatings are used industrially to improve the life and performance of mechanical components and cutting tools [1]. Diamond is the material traditionally used in these applications due to its high hardness, high melting point and low plastic deformation [2, 3] but it is not suitable for a number of applications such as cutting steel. This need for improved performance has led to an experimental and theoretical search for alternative materials. There have been two basic approaches used to guide this search. One was to look for materials like diamond that have very low bond polarization, such as boron nitride [4, 5], and the other was to look for materials with very high densities, such as uranium [6]. An alternative approach is to make hybrid materials by combining transition metals with a layered boron or carbon network [7]. Recent examples include OsB2 and ReB2 which were shown to have bulk
moduli of 365–395 GPa [8] and 360 GPa [9], respectively, approaching that of diamond. Recently published theoretical studies suggest that rare-earth diborides(REB2) might rival
these materials. Density functional calculations showed the bulk modulus of LuBx to be 166.9, 183.5 and 218.3 GPa
for x = 2, 4 and 12 [10]. Applying similar techniques, the calculated large bulk modulus (in the 140–200 GPa range)
and high hardness ( 15–20 GPa) [11] of REB2(RE: Tb, Dy,
Ho, Er, Tm and Yb) revealed that these are incompressible and hard materials. So far there has been no experimental determination of the bulk modulus or hardness in this system. Here we report the synthesis of high purity YbB2 and its
characterization using powder diffraction and photoemission. We also investigated the phase stability as a function of pressure and report the bulk modulus. The main objectives of this study were to investigate the phase stability under pressure of YbB2, and to help to fill the gap in the literature
regarding the values of the bulk modulus(B0) and alternative
synthesis routine for the REB2.
2. Experimental details
Samples were prepared by solid-state reaction. The starting boron was in the amorphous powder form (Alfa Aesar, 99.99%) while Yb was in ingot form (Ames Laboratory, 99.95%). Small Yb pieces were scraped from the ingot surface in order to increase the reaction surface of the metal. Appropriate amounts of Yb and B were weighed in a glove box with an oxygen and moisture level below 1 ppm. Several reaction cells which were designed in different geometries and dimensions were used for the heating processes. In line with the results of various preliminary synthesis attempts [12], a
J. Phys.: Condens. Matter 24 (2012) 345401 B Kalkan et al
sealed Ta tube was used to realize the heat treatments. Oxides and similar on the Ta tube surface were removed by an etching process in HF: HNO3:H2O (1:1:3) solution before each heat
treatment. The starting mixture was subjected to heating in a tubular furnace in a flowing Ar atmosphere at designated duration and temperature. Then, the samples were pressed into pellet form under 2200 psi after an intermediate grinding. The pellets were wrapped with Ta foils and sintered at moderate temperatures. In order to investigate the effect of heating temperatures and periods and the starting compositions on the isolation of the YbB2 phase, four different groups of
samples were prepared. The starting composition of the first two groups was in the stoichiometric ratio and the samples were heated at elevated temperatures of 850 and 950◦C for different periods described in the text. The third group of samples was heat treated for 96 h at 650, 750, 850 and 950◦C, respectively. The last sample group with a small excess of Yb metal, YbxB2 (x = 1.0, 1.1 and 1.2), in the starting
composition was sintered at 850◦C.
Structural characterization and phase analysis studies with the sintered samples were realized by x-ray powder diffraction using a HUBER-Guinier Imaging Plate Camera G670 with a RU-200 Cu rotating anode. An asymmetrically ground curved Ge(111) monochromator was aligned to obtain only the Cu Kα1 radiation (λ = 1.5406 ˚A), which was calculated by a Si standard. Intensity data were collected over a 2θ range from 5 to 100◦at a step width of 0.005◦for about 30 min per sample contained in a 0.5 mm Pyrex capillary tube. An extended data acquisition time was preferred to reduce the noise level and realize phase analysis with more accuracy.
High pressure measurements at ambient temperature were made using a standard symmetric diamond anvil cell with 300µm culet diamonds and tungsten carbide and boron nitride backing plates. Rhenium gaskets were indented to a thickness of about 30µm. For diffraction measurements, a 150µm hole was drilled in the center of the indentation and was loaded with the sample, 4:1 methanol:ethanol mixture (MEM) as the pressure transmitting fluid and small spheres of ruby as a pressure marker. Regarding the pressure calibration in these measurements, the ruby fluorescence spectra showed a sharp doublet throughout our measurements, with no measurable broadening of the peaks. A number of small ruby spheres were placed around the sample chamber. Pressure was measured from each of these spheres, and differences in the measured pressure between these spheres were found to be within the experimental accuracy of the pressure scale used. These results lead us to conclude that sample is under hydrostatic pressure in our measurements.
High pressure x-ray diffraction experiments were performed at the high pressure beamline (BL12.2.2) of the Advanced Light Source at Lawrence Berkeley National Laboratory [13]. Angle-dispersive diffraction data were collected at an energy of 30 keV selected using a two-bounce Si(111) double-crystal monochromator. The beam was focused to a 10µm×10 µm spot which is necessary for these measurements to avoid any contamination of sample patterns by scattering from the gasket or ruby. The sample–detector distance can be as small as 200 mm to allow the detector
to match the opening angle of the diamond anvil cell. A MAR345 image plate detector was used to collect diffraction images. The sample–detector distance and the detector tilt angles were measured using powder diffraction from a LaB6
standard. The x-ray beam was 99% horizontally polarized and all geometric and polarization corrections were made during the angular integration using the program FIT2D [14]. The Celref program [15] was used to determine unit cell parameters and volumes.
The crystal structure of YbB2 at ambient conditions
was refined with the Rietveld method using the DBWS program [16]. The background in the raw x-ray diffraction (XRD) pattern was modeled automatically by the Sonneveld method [17]. A full background curve was linearly interpolated from the background points and the interpolated background curve was subtracted from the pattern.
X-ray photoelectron spectroscopy (XPS) measurements and qualitative analysis were carried out on some YbB2
polycrystalline samples at room temperature to determine the valence state of Yb in YbB2. This was compared with
the spectrum of a partially surface oxidized Yb metal. XPS data were collected using a Kratos ES300 model electron spectrometer with a Mg Kα (1253.4 eV) x-ray radiation. XPS data were analyzed using the XPSPEAK 4.1 software [18].
3. Results and discussions
XRD patterns of the sample group heat treated at 650, 750, 850, and 950◦C for 96 h are presented in figure 1. The insets in figure1show the 27–37.5◦region which is enlarged to identify major impurity phases—YbB4 and Yb2O3. The
results pointed out that there is no other binary boride phase of Yb, such as YbB6, and unreacted Yb in the XRD patterns.
It should also be noted that unreacted Yb may have been condensed on the inner surfaces of the Ta tube during the cooling process. The presence of a minor amount of the Yb2O3 phase indicates that either the reaction cell or the
starting Yb metal is partially oxidized during the synthesis routes. As seen in figure 1, samples heated at 650 and 750◦C show poor crystallinity. With increasing temperature, the diffraction peaks become sharper, narrower and more intensive which indicates enhancement of the crystallinity. However, the presence of a significant amount of impurity phases in the XRD pattern of the sample heated at 950◦C leads us to keep the heat treatment temperature in the range of 750–850◦C which is low enough to eliminate the formation of the higher amount of YbB4due to the Yb loss, and high
enough to obtain a good crystallinity.
Next the sample group was heated at 850◦C for 3, 24, 96 and 192 h to optimize the time period of the synthesis route. Analysis of the XRD patterns of samples not presented here clearly showed that YbB2 phase peaks become sharper and
narrower as the annealing period increases. The intensities of impurity reflections decrease with the annealing period up to 96 h, reach a minimum at this period and then increase for the 192 h heating period. These results reveal that the optimum heating temperature and period to synthesize the YbB2 phase using our preparation routes is in the range of 2
Figure 1. X-ray powder diffraction patterns of YbB2samples heat
treated at different temperatures for 96 h. Insets: the 27–37.5◦
region enlarged to identify major impurity phases; YbB4and Yb2O3.
750–850◦C and 96 h, respectively. However, optimization of the heat treatment conditions is not enough to control sample quality sensitively due to the fact that possible loss of Yb metal vapor pressure still allows formation of a YbB4impurity
phase, as can be seen in figure1. Therefore, a final series of samples with a composition of YbxB2 (1.0 ≤ x ≤ 1.3) were
heat treated at 850◦C for 96 h to study the influence of the
excess Yb in the starting composition on phase formation. Figure2, where XRD patterns of YbxB2samples are plotted
in an enlarged range between 27 and 37.5◦, shows that the
YbB4phase disappears and the amount of the Yb2O3phase
decreases to 0.5 ± 0.4% (w/w) by introducing 20% excess Yb. These results show that it is possible to isolate 99% and 99.5% pure YbB2phase with 10% and 20% excess Yb
reinforcement, respectively. Moreover, we can conclude that the synthesis details presented here serve as alternative route for the synthesis of YbB2phase which is more likely to be
obtained in high purity form at the thermodynamic conditions reported here.
YbB2has a simple hexagonal (hex) AlB2type (P6/mmm,
191) crystal structure and contains graphene like boron layers separated by hexagonal close-packed Yb layers, similar to MgB2[19]. Yb atoms occupy the center of boron hexagons and face both directly above and below each Yb in the metal layers. The hexagonal framework of Yb in 2a (0, 0, 0) and B in 2d (1/3, 2/3, 1/2) Wyckoff positions is shown in the
Figure 2. The 27–37.5◦
range in the XRD patterns of the samples synthesized with different starting compositions; YbxB2(x = 1, 1.1
and 1.2). Impurity peaks are labeled with their chemical formulae.
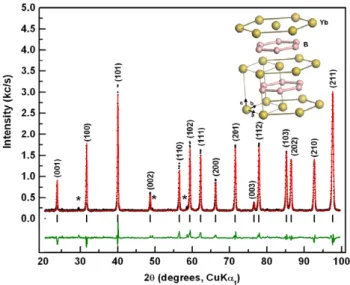
Figure 3. Observed XRD pattern of Yb1.1B2prepared at 850◦C for
96 h (dots) and the calculated pattern of the modeled structure of YbB2(red line). The difference between the two patterns is plotted
in the lower part of figure as a solid trace (green line). The vertical bars refer to the calculated allowed Bragg reflections. No region was excluded from the refinement. Impurity peaks are labeled with asterisks. The inset is the molecular structure of YbB2.
inset of figure 3, and is used as the structural model for Rietveld refinement applied to the XRD pattern of a YbB2
sample synthesized at 850◦C for 96 h. In the initial steps of refinement, the scale factor and background coefficients were refined, and other parameters were then included. Coefficients of the sixth-order polynomial function were refined with a few iteration cycles to fit the background of the measured XRD data. In the following process, zero offset and lattice parameters were refined to the optimize peak positions of the calculated pattern and volume of the model structure. After a few iteration cycles, zero offset was converged to a minimal negligible value. Analytical profile fitting was realized with the refinement of mixing and parameters U, V, W using the pseudo-Voigt peak function. During refinement cycles, special Wyckoff positions of Yb and B atoms were fixed. Towards the end of refinement, atomic temperature factors of Yb and B atoms were allowed to refine systematically. Iterations were cycled many times until Rp, Rwp, RBragg (Bragg R-factor)
J. Phys.: Condens. Matter 24 (2012) 345401 B Kalkan et al Table 1. Crystallographic data and some parameters for the
structural refinement of YbB2.
Formula YbB2
Crystal system Hexagonal Space group P6/mmm (191) a( ˚A) 3.2522(2) b( ˚A) =a c( ˚A) 3.7297(4) Cell volume( ˚A3) 34.162(8) Calculated density
(g cm−3)
9.465(3) Z(formula units
per unit cell)
1 Data points 3925 Reflections 15 Rp, Rwp 0.0679, 0.0892 RBragg, S(χ2) 0.0510, 1.24 Atomic parameters: Yb 2a (0, 0, 0), B ( ˚A2) = 0.39(3), N = 1 B 2d (1/3, 2/3, 1/2), B ( ˚A2) = 1.83(2), N = 1
and S (χ2, goodness of fit), which were the figures of merit for refinement, converged to their minimal values as 0.0679, 0.0892, 0.0510 and 1.24, respectively (see table 1). The refined pattern of model structure was presented in figure3. In total, 15 reflections were refined by 17 parameters. The refined lattice parameters, a = b = 3.2522(2) ˚A and c = 3.7297(4) ˚A, of the YbB2 phase are found to be slightly smaller than the
values reported by Avila et al [12]. As expected, the refined temperature factors of the B atoms are significantly larger than those for Yb, which is much more massive than B. It should also be noted that our XRD patterns and structural refinements reveal(003) reflection at 77◦2θ that could not be observed in any previous study and it is the only reflection out of those observed that cannot be explained as a reflection of hex-YbB2
phase.
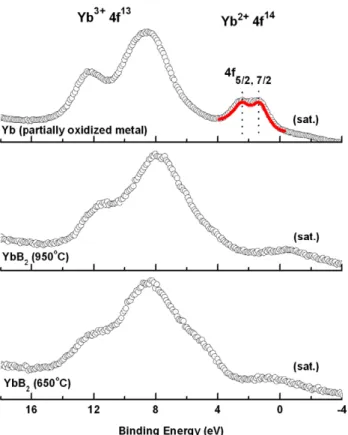
The valence state of Yb in the obtained YbB2phase was
investigated with XPS measurements. The spectral analysis is presented in figure4. The 4f band spectra collected from YbB2samples synthesized at 650◦C and 950◦C are displayed
in the same binding energy range with the valence band spectrum of the partially oxidized Yb metal sheet to identify both of the valence states of Yb. XPS data of the surface oxidized Yb metal clearly reveal four peak structures at 1.3, 2.5, 8.6, and 12.3 eV below the Fermi energy. The two peaks located at 1.3 and 2.5 eV below the Fermi level correspond to the 4f7/2and 4f5/2spin–orbit doublet of the divalent Yb2+
(4f14) pure metal, respectively [20]. The positions and relative intensities of these peaks are very well known [21] and are in good agreement with the previous published data [22]. The red line in the same spectrum also indicates a fit obtained using the XPSPEAK program. The peaks located at 8.6 and 12.3 eV belong to the 4f complex multiplet structure of the Yb2O3phase where the Yb metal is in the form of a trivalent
Yb3+ (4f13) valence state [23,24]. In the 4f spectra of the samples synthesized at 650 and 950◦C, it can be seen that the pronounced multiplet in the 8–13 eV energy range becomes prominent, and the spin–orbit doublet of Yb2+ part is not
Figure 4. . Valence band x-ray photoemission spectra of Yb for three different samples. The peaks designated as (sat.) refer to Kα3,4
satellites of the x-ray source.
observed. The small shift of the characteristic lines towards lower binding energy in the spectrum of the YbB2 samples
compared with the partially oxidized Yb metal is related to the different chemical environment of the Yb atom in diboride structures and Yb2O3 compounds. Relative intensities of
the 4f13 doublets do not change significantly, although the peaks are broadened, due most probably to structural and/or chemical inhomogeneities. Based on these results, it can be summarized that XPS measurements on high purity samples, clearly exhibit the valence state of the Yb atom in the YbB2
compound as mostly 3+ as indicated in a previous study where the calculation of effective magnetic moment from the susceptibility measurements using the Curie–Weiss law was done [12].
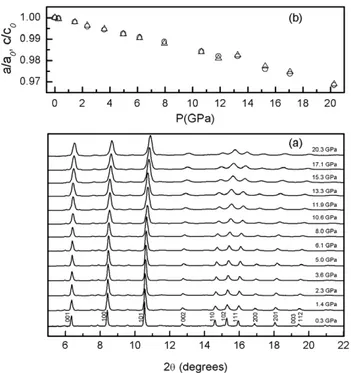
Room temperature XRD patterns of YbB2 crystal
collected under compression are shown in figure 5. The compression cycle results in a simple shift of diffraction Bragg peaks to higher angles, indicating a decrease in the unit cell dimensions. The results clearly reveal that YbB2
does not show a significant structural change and remains stable up to 20.2 GPa, the highest measured pressure in this study. The normalized lattice parameters, a/a0 and c/c0, as
a function of pressure are illustrated in figure 5. Refined lattice parameters decrease very slowly with increases in pressure, consistent with the high hardness property for this material. Moreover, both a/a0and c/c0 exhibit very similar
pressure dependence, indicating that the compressibility along a and c axes is fairly isotropic even though the structure is classified as a layer structure. This result is inconsistent
Figure 5. (a) XRD patterns collected upon compression.
(b) Pressure dependence of the normalized lattice parameters, a/a0
(circles) and c/c0(triangles).
with the chemical bonding characteristics reported by Spear et al [25] that respective bond distances and Yb–Yb/Yb–B bond strengths are comparable. Also, B and Yb layers seem therefore to be tightly bound together by Yb–B bonding [25]. Surprisingly, the compressions along the a and c axes display an abrupt kink in the 12–14 GPa pressure range, while there is no significant change in XRD patterns presented in figure5. We believe that the change in slope of a/a0and c/c0
could be due to the solidification of the MEM instead of a possible phase transition in this pressure range. The unit cell volume at each measured pressure was calculated using the respective lattice parameters. The pressure dependence of the normalized unit cell volume of the YbB2can be described by
the second order (assuming that K00 =4) Birch–Murnaghan equation of state (EOS) [26] that yields the bulk modulus (K0) 182.2 ± 5.3 GPa for YbB2 (the continuous curve in
figure 6). The calculated K0 value in this study is slightly
larger than the values ranging between 147 and 163 GPa [11] predicted with ab initio calculations for YbB2. Moreover, the
Birch–Murnaghan EOS fit gives V0=34.3 ± 0.1 ˚A 3
that is very close to the experimental ambient unit cell volume of V0=34.21 ± 0.04 ˚A
3
determined with Rietveld refinement in figure 3. It should also be noted that the hydrostatic conditions were estimated at this relatively low pressure range in a MEM based on a previous report and our pressure measurements. Therefore, we can conclude that there is no overestimated trend on the value of K0. To better understand
the compressibility of YbB2 the experimental volume
compression as a function of pressure is plotted in figure6
with the results for diamond [27], c-BN [28], ReB2 [29],
OsB2 [30], LuB2 [11] and GdB2 [11] determined via
experimental data and first-principles calculations. Compared
Figure 6. Volume compression of YbB2as a function of pressure
with a Birch–Murnaghan second EOS fit. The calculated and experimental compressibility curves of some other hard and super-hard materials are also depicted for comparison.
to predicted hard materials such as GdB2 and LuB2, YbB2
is less and slightly more compressible, respectively while its compressibility is higher than that of diamond, c-BN, ReB2
and OsB2, known as super-hard materials. It can be concluded
that the compressibility of the lanthanides is correlated with the size of the lanthanide atom.
4. Conclusions
The crystal structure of YbB2 up to 21 GPa has been
investigated using high-resolution x-ray diffraction at ambient temperature. YbB2is found to be stable throughout the whole
pressure range and does not show a structural phase transition. The bulk modulus of YbB2derived from P–V measurement
was determined to be 182.2 ± 5.3 GPa, which is, to date, the only and most accurate experimental value available. The high value of the bulk modulus indicates that YbB2has low
compressibility and may be classified as a hard material. The compressibility along the c axis is close to that along the a axis, indicating that the compressibility of YbB2 is fairly
isotropic in the studied 0–21 GPa pressure range. Besides the high pressure structural properties, we developed a process for the synthesis of YbB2 phase with a purity of 99.5% at
relatively low temperatures. Single phase Rietveld refinement confirms the hexagonal structure in P6/mmm space group with the lattice parameters of a = b = 3.2522(2) ˚A and c =3.7297(4) ˚A. The valence band in XPS measurements is presented in the 0–20 eV energy range, which is dominated by the complex 4f13 multiplet of Yb. Based on these results, it is concluded that Yb ions are in the trivalent form in the YbB2 compound and this valence state does not depend on
the annealing history of the samples.
Acknowledgments
The authors are grateful to Dr S M Clark for fruitful discussions and critical reading. This work was financially
J. Phys.: Condens. Matter 24 (2012) 345401 B Kalkan et al
supported by the State Planning Organization under the contract 03K120570-05-6 and the Hacettepe University Research Council under contract 01G011 and 04D11602001. The Advanced Light Source is supported by the Director, Office of Science, Office of Basic Energy Sciences, of the US Department of Energy under contract no. DEAC02-05CH11231.
References
[1] Reich S, Ferrari A C, Arenal R, Loiseau A, Bello I and Robertson J 2005 Phys. Rev. B71 205201
[2] Occelli F, Loubeyre P and Toullec R L 2003 Nature Mater.
2 151
[3] Brazhkin V V, Lyapin A G and Hemley R J 2002 Phil. Mag. A
82 231
[4] Zheng J C, Huan C H A, Wee A T S, Wang R Z and Zheng Y M 1999 J. Phys.: Condens. Matter11 927
[5] Zheng J C 2005 Phys. Rev. B72 052105
[6] Akella J, Smith G S, Grover R, Wu Y and Martin S 1990 High Press. Res.2 295
[7] Zhou W, Wu H and Yildirim T 2007 Phys. Rev. B76 184113
[8] Cumberland R W, Weinberger M B, Gilman J J, Clark S M, Tolbert S H and Kaner R B 2005 J. Am. Chem. Soc.
127 7264
[9] Chung H Y, Weinberger M B, Levine J B, Kavner A, Yang J M, Tolbert S H and Kaner R B 2007 Science
316 436
[10] Deligoz E, Ozisik H, Colakoglu K, Surucu G and Ciftci Y O 2011 J. Alloys Compounds509 1711
[11] Zazoua F, Kacimi S, Djermouni M and Zaoui A 2011 J. Appl. Phys.110 014908
[12] Avila M A, Bud’ko S L, Petrovic C, Ribeiro R A, Canfield P C, Tsvyashchenko A V and
Fomicheva L N 2003 J. Alloys Compounds358 56
[13] Kunz M et al 2005 J. Synchrotron Radiat.12 650
[14] Hammersley A P, Svensson S O, Hanfland M, Fitch A N and Hausermann D 1996 High Press. Res.14 235
[15] Laugier J and Bochu B 2002 celref version 3 Cell parameter refinement program from powder diffraction diagram, Laboratoire des Mat´eriaux et du G´enie Physique, Ecole Nationale Sup´erieure de Physique de Grenoble (INPG), France
[16] Young R A and Wiles D B 1982 J. Appl. Crystallogr.15 430
[17] Sonneveld E J and Visser J W 1975 J. Appl. Crystallogr.8 1
[18] www.phy.cuhk.edu.hk/∼surface/XPSPEAK
[19] Jones M E and Marsh R E 1954 J. Am. Chem. Soc.76 1434
[20] Szytula A, Konyk M, Penc B and Winiarski A 2008 Acta Phys. Pol.A 113 1205
[21] Szytula A, Jezierski A, Penc B, Winiarski A, Jasper A L and Kaczorowski D 2003 J. Alloys Compounds360 41
[22] Schnellb¨ugel A, Selle B and Anton R 1997 Mikrochim. Acta
125 239
[23] Egelhoff W E and Tibbetts G G 1980 Phys. Rev. Lett.44 482
[24] Padalia B D, Lang W C, Norris P R, Watson L M and Fabian D J 1977 Proc. R. Soc. A354 269
[25] Spear K E 1976 J. Less-Common Met.47 195
[26] Birch F 1947 Phys. Rev.71 809
[27] Fast L, Wills J M, Johansson B and Eriksson O 1995 Phys. Rev.B51 17431
[28] Jona F and Marcus P M 2002 Phys. Rev. B66 094104
[29] Panda K B and Chandran K S R 2006 Comput. Mater. Sci.
35 134
[30] Li Y, Zeng Z and Lin H 2010 Chem. Phys. Lett.492 246