COSTUMERS’ EMOTIONAL AND BEHAVIORAL RESPONSES UNDER DIFFERENT ACCENT LIGHTING CONDITIONS IN A REAL RETAIL STORE
A Master’s Thesis
by BÜŞRA GÜMÜŞAY
Department of
Interior Architecture and Environmental Design İhsan Doğramacı Bilkent University
Ankara November 2018
COSTUMERS’ EMOTIONAL AND BEHAVIORAL RESPONSES UNDER DIFFERENT ACCENT LIGHTING CONDITIONS IN A REAL RETAIL STORE
The Graduate School of Economics and Social Sciences of
İhsan Doğramacı Bilkent University
by
BÜŞRA GÜMÜŞAY
In Partial Fulfillment of the Requirements for the Degree of MASTER OF FINE ARTS
THE DEPARTMENT OF
INTERIOR ARCHITECTURE AND ENVIRONMENTAL DESIGN İHSAN DOĞRAMACI BİLKENT UNIVERSITY
iii
ABSTRACT
COSTUMERS’ EMOTIONAL AND BEHAVIORAL RESPONSES UNDER DIFFERENT ACCENT LIGHTING CONDITIONS IN A REAL RETAIL STORE
Gümüşay, Büşra
MFA, Department of Interior Architecture and Environmental Design Advisor: Assist. Prof. Dr. Semiha Yılmazer
November, 2018
The aim of the study is to understand the influence of lighting color temperature on costumers’ emotional and behavioral responses in a real retail store. In the experiment three different color temperatures were used on LED track spot lights that illuminates a living room furniture set. This study was conducted with 90 participants who were customers and accepted participant acceptance protocol. Thirty customers participated for each lighting condition (2700K as Warm White (WW), 5000K as Artificial
Daylight (DL), 6500K as Cool White (CW)). Observation method was used to
conduct behavioral analysis. Behavior mapping was used to analyze understanding of the custumers’ behavioral responses. Mehrabian and Rusell’s M-R model was used to analyze emotional responses. PAD (Pleasure, Arousal, Dominance) model was preferred to conduct a questionnaire in order to measure customers’ emotional
responses. Results showed that color temperature influenced on costumers’ emotional and behavioral responses. Under warm white (WW) color temperature, people feel
iv
more pleasure than cool white color temperature. Under WW color temperature people spent more time in front of the illuminated furniture set. Contrast color temperatures (WW and CW) increased the levels of pleasure and arousal scales of emotional responses.
Keywords: Accent Lighting, Color Temperature, Consumers’ Behavior, Emotional Responses Retail Store,
v
ÖZET
GERÇEK BİR MAĞAZADAKİ FARKLI IŞIK KOŞULLARI ALTINDA MÜŞTERİLERİN DUYGU DURUMLARI VE DAVRANIŞLARININ ANALİZİ
Gümüşay, Büşra
MFA, İç Mimarlık ve Çevre Tasarımı Bölümü Tez Danışmanı: Dr. Öğr. Üyesi Semiha Yılmazer
Kasım, 2018
Bu çalışmanın amacı, gerçek bir mobilya mağazasında, ışığın farklı renk sıcaklıklarının kullanıcıların duygu durumları ve davranış biçimleri üzerindeki etkilerini araştırmaktır. Deneyde üç farklı renk sıcaklığındaki LED spot aydınlatma elemanları ile belirlenen bir oturma grubunu aydınlatılmıştır. Çalışma, katılım protokolünü kabul eden 90 katılımcı ile gerçekleştirilmiştir. Her aydınlatma koşulu (2700K Sıcak Beyaz, 5000K Yapay Günışığı, 6500K Soğuk Beyaz renk sıcaklığı) altında 30’ar farklı katılımcı ile değerlendirilmiştir. Gözlem yöntemi, davranış haritalarını oluşturmak için kullanılmıştır. Mehrabian ve Russel tarafından
tanımlanan M-R modeli ile katılımcıların duygu durumları ölçülmüştür. M-R modeli içerisinde uygulanan, Memnuniyet, Harekete Geçme ve Baskınlık başlıkları altında duygu durumları için sıfat çiftlerinden oluşan anket soruları uygulanmıştır. Sonuç olarak, ışığın renk sıcaklığının duygu durumları ve davranış biçimleri üzerinde ciddi etkileri olduğu ortaya konmuştur. Kullanıcılar Sıcak Beyaz renk sıcaklığı altında daha fazla memnuniyet hissetmişlerdir. Kontrast renk sıcaklığı olarak algılanan sıcak beyaz
vi
ve soğuk beyaz renk sıcaklıklarının memnuniyet ve harekete geçme duyguları üzerinde pozitif etkiye sahip olduğu saptanmıştır.
Anahtar Kelimeler: Duygu Durumları, Mağaza Aydınlatması, Müşteri Davranış Biçimleri, Renk Sıcaklığı,
vii
ACKNOWLEDGEMENTS
I would like to thank my advisor Assist. Prof. Dr. Semiha Yılmazer for her valuable support, endless patience and encouragement, whenever I needed, she gave me her precious advices and she showed me the right direction. It is a privilege for me to be one of her students.
I would like to thank my jury members, Assist. Prof. Çağrı İmamoğlu and Assist. Prof. Saadet Akbay Yenigül for their detailed contributions and suggestions. I would like to express my appreciation to staff of the Ladin brand furniture store where I conducted my experiment, without their help, it was really difficult to make an experiment in a real store setting.
I would like to express my indebtedness to my precious family; to my father İdris Gümüşay who has always helped and supported me, also worked with me throughout my experiment for this thesis; to my mother Gülay Gümüşay for her patience, help and endless support in my whole life and to my brother Yusuf Mert Gümüşay for his support and kindness. Lastly, I would like to thank my husband Dorukan Özbek for his endless support and love. I dedicate this thesis to my precious family.
viii
TABLE OF CONTENT
ABSTRACT ... iii
ÖZET ... v
ACKNOWLEDGEMENTS ... vii
TABLE OF CONTENT ... viii
LIST OF TABLES ... x
LIST OF FIGURES ... xi
CHAPTER I: INTRODUCTION ... 1
1.1. Aim of the Study ... 3
1.2. Structure of Thesis ... 3
CHAPTER II: LIGHTING IN RETAIL STORE ENVIRONMENT ... 5
2.1. Lighting as an Atmospheric Tool ... 5
2.1.1. Lighting Sources in Stores ... 7
2.1.2. Contrast ... 10
2.2. Psychological Aspects of Lighting in Retail Stores ... 13
CHAPTER III: EMOTIONAL AND BEHAVIORAL RESPONSES OF COSTUMERS ... 17
3.1. Emotional Analysis of Customers ... 17
ix
CHAPTER IV: EXPERIMENTAL STUDY ... 26
4.1.1. Research Questions and Hypotheses ... 27
4.2. Method of the Study... 28
4.2.2. Retail Store Settings ... 29
4.2.3. Procedure ... 34
4.3. Results ... 42
4.3.1. Effects of Color Temperature on Emotional Responses ... 42
4.3.2. Effects of Color Temperature on Behavioral Responses ... 45
4.3.3. Effects of Color Temperature on Behavior Mapping ... 48
4.3.4. Correlations Between Emotional and Behavioral Responses ... 49
4.3.5 Effects of Gender on Emotional Responses... 57
4.4. Discussion ... 61
CHAPTER V: CONCLUSION ... 72
5.1. Limitations and Recommendations for Further Studies ... 76
REFERENCES ... 77
APPENDICES ... 85
Appendix A. Physical Activity Coding and Circulation Pattern ... 85
Appendix B. Behavior Maps Under Three Different Lighting Conditions ... 91
Appendix C. PAD Questionnaire Turkish Version... 94
x
LIST OF TABLES
Table 1: Activity Coding Table Example ... 25
Table 2: Frequency Distribution of Participants ... 28
Table 3: Technical Data of LED Track Spots ... 33
Table 4: PAD Adjective Pairs ... 41
Table 5: Mean Values for Adjective Under Three Different Lighting Conditions ... 43
Table 6: Semantic Ratings Under 2700K (Red), 5000K (Yellow) and 6500K (Blue)44 Table 7: Pearson Correlation Results Between Pleasure, Arousal, Dominance Scale Adjective Pairs And Activity Coding ... 51
Table 8: Significant correlations Between Adjective Pairs And Activity Coding Under 5000K ... 52
Table 9: Pearson Correlation Results Between PAD Scale Adjective Pairs and Time Spent ... 54
Table 10: Significant Correlations Between Adjective Pairs and Time Spent Under 5000K ... 56
Table 11: Comparisons of the Emotional Responses and Time Spent as a Summary ... 75
xi
LIST OF FIGURES
Figure 1: The Kurithoff Curve ... 7
Figure 2: Jang & Namkung's Extended Emotion and Behavior Model ... 15
Figure 3: Stimulus-Organism-Response Taxonomy ... 18
Figure 4: Three Dimensional Model as Tripartite View of Experience According to Bakker et al. (2014: 416). ... 20
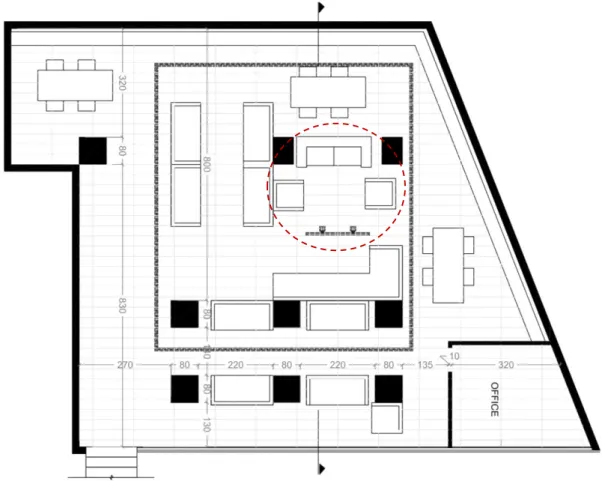
Figure 5: Plan of the Store (not to scale) ... 30
Figure 6: Section of the Store (not to scale) ... 30
Figure 7: Axonometric Drawing of the Store ... 31
Figure 8: The Angle of Spot Lights ... 32
Figure 9 a, b, c : The Furniture Set Under 2700K (left), 5000K (middle), 6500K (right) Color Temperature ... 34
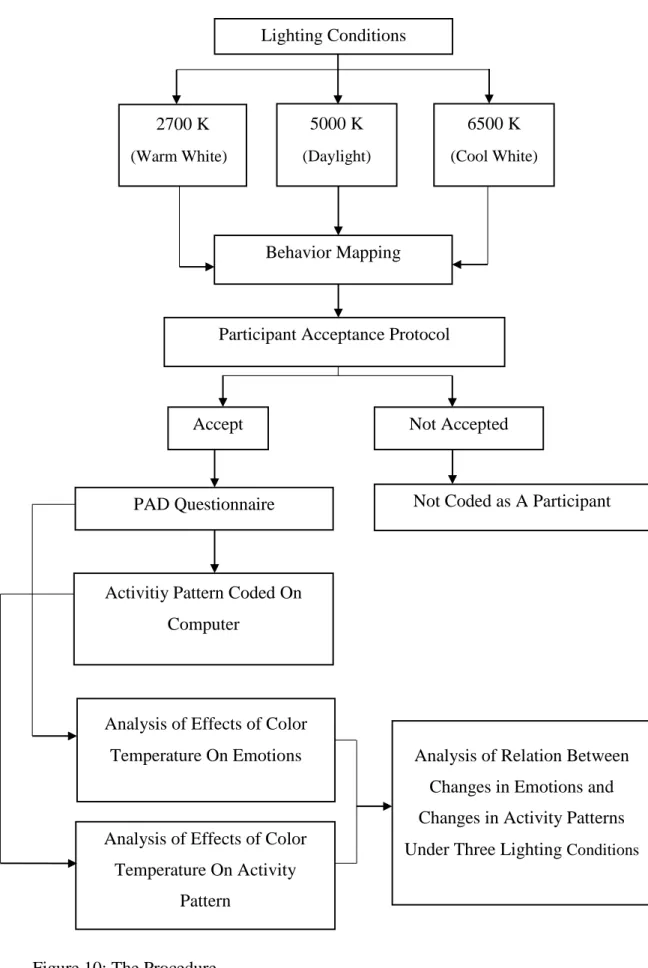
Figure 10: The Procedure ... 35
Figure 11: Example of The Observer’s Activity Coding Data Sheet ... 36
Figure 12: Behavior Map of 30 Customers Under 2700K (WW) Color Temperature ... 39
Figure 13: Emotional Responses According to Female and Male Customers Under 2700K (WW) ... 58
Figure 14: Emotional Responses According to Female and Male Customers Under 6500K ... 59
Figure 15: Emotional Responses According to Female and Male Customers Under 5000K ... 60
1
CHAPTER I
INTRODUCTION
Shopping is one of the daily activities of human kind. It might have taken many different styles of shopping through the history of civilization but substantially the notion stays the same. Before the buying, people tried to exchange products between them as a shopping activity. Developments in industrial field changed shopping attitude and people started to shop its current understanding.
Starting from the 1950s, there are increasing numbers of the researchers about the analysis of customer decisions and retail store design settings (Findlay & Sparks, 2002; Baker, Levy, & Grewal, 1992; Bechtel et al., 1987; Havlena & Holbrook, 1986).
Customer decisions generally cover only buying behavior at the beginning, especially among the marketers (Kotler, 1973). Researches include the effects of store setting on the customer buying behavior.
Atmospherics concept defined by Kotler (1973) and this concepts included interior and exterior environmental settings that have possibilities to change customer
2
behavior (Kotler, 1973). Atmospherics included interior elements like layout, odor, music, color and lighting (Turley & Milliman, 2000).
Lighting and color are found as most effective interior atmospherics that have influences on customer behavior (Barlı et al.,2012; Chen et al., 2016; Chen et al., 2015). Over the last decade, relationships between atmospheric details and customer experiences are analyzed by researchers. Studies are conducted to analyze emotional and behavioral responses as if they are in correlations with each other or not.
Researchers mainly focus on emotional responses of customer (Ampenberger et al., 2017; Bakker et al., 2014; Barlı et al., 2012; Bohl, 2012; Bustamante & Rubio, 2017). Recent studies start to analyze lighting and color influences on emotional responses of customers (Ampenberger, Staggl, & Pohl, 2017; Bailey & Burch, 2017). Some of these studies mainly focus on detailed lighting analyze by researching the effects of lighting on emotions and behavioral intentions. To study on the influences of lighting on emotional responses, the lighting needs to be used as independent variable. This requires the control of all other parameters. It is difficult to keep sufficient
experimental conditions in real store settings. Because of this reason, many of the studies that analyze the effect of lighting on emotions and behavioral intentions are conducted in virtual environments or in experimental setups. (Bercík , Horska, Wang, & Chen, 2016; Huang , Ali, & Liao, 2017; Jennings & Kingdom, 2017; Quartier, Vanrie, & Cleempoel, 2014). On the other hand, these experiments between lighting and emotional responses mainly use quantitative data to measure emotional and behavioral responses.
In addition, almost all of the lighting studies in the store environment consider the changes of general lighting conditions (Wang, Luo, Liu, Yang, & Zheng, 2014;
3
White, Rojas, Mappes, Rautiala, & Kemp, 2017; Yılmaz, 2018), a few of them focused on creating contrasts with general and accent lighting conditions. This study presents the relationship between lighting color temperature with emotional and behavioral responses of customers in the real retail store setting.
1.1. Aim of the Study
The aim of this study is to analyze the effect of color temperature on customers’ behavior and emotions in real retail store under different accent lighting conditions. For this purpose, three different color temperature of LED track spots are located to illuminate the specific area in real furniture store. 2700K, 5000K and 6500K color temperatures are preferred on LED track spots. General lighting color temperature is 5000K. 2700K and 6500K on accent lighting (LED track spots) creates contrast effect in environment. The contrast effect is also analyzed in the experiment. To analyze and understand the effects of color temperature of accent lighting on emotional and
behavioral responses could be helpful for designers and marketers to create more powerful store environments that influence customers’ emotional and behavioral responses in a positive way.
1.2. Structure of Thesis
This thesis mainly consists of five chapters. The first chapter is a brief introduction to study based on effect of store environment especially luminous environment of stores
4
on customers’ emotion and behavioral analysis. In addition, lighting and emotion relationships are mentioned. This chapter also describes the aim of the study and the structure of the thesis.
The second and third chapters are detailed literature review. Second chapter consists of two main parts based on store lighting studies. In the first part, lighting parameters in store environment are explained. In the second part, researches about the lighting effects on customers’ psychological reactions are mentioned.
The third chapter explains the literature about used methodology in this experiment. Firstly, Mehrabian-Russell method about measuring emotions in stores are explained and their questionnaire PAD scale is defined. Lastly, behavior mapping methodology to understand the behavioral analysis of customers is explained. For this
methodology, usage of activity pattern maps in the literature is also defined. The fourth chapter is the main part of the study based on the experimental study. In this chapter, firstly research questions and hypotheses are given. The method of the study is described by explaining the furniture store settings, identification of participant groups, and process of the experiment firstly. Then the design of the experimental study; behavior mapping method and Mehrabian-Russel PAD questionnaires are described respectively. Also, in this chapter, statistical analysis methods and evaluation of the data are presented. Lastly, findings of the study are discussed in relation to the previous studies about the topic mentioned in the second chapter.
The last chapter includes the conclusion and limitations of the study with further recommendations. This chapter contains the important aspects of results, summary of findings and limitations of the study with recommendations for further studies.
5
CHAPTER II
LIGHTING IN RETAIL STORE ENVIRONMENT
2.1. Lighting as an Atmospheric Tool
Since Kotler (1973) defined atmospherics to the marketing literature, there are several studies have discussed environmental cues effecting customers in a shopping environment (Bohl, 2012). They focused on environmental cues that influences customers’ buying behavior.
Environmental psychology and retailing studies proves that environmental design characteristics are crucial for creating pleasurable customer experiences, conveying desired store image and promoting specific behaviors (Rompay, Tanja-Dijkstra, Verhoeven, & Es, 2012). Hull & Harvey (1989) also defines physical design qualities as properties that create unique and well defined environments. They consider design characteristics as micro and molar qualities (Hull & Harvey, 1989). Light is a significant element for marketing that has crucial influences on customer emotions and retail environment that provides unique retail space. It is an important tool that can be controlled and measured by several parameters such as light
intensity, color temperature, illumination angle and color rendering index. By only using the type of lighting like cove, accent and dramatic lighting, designer could
6
provide dynamic retail environments. Rompay et Al. (2012) claim that it is possible to attract attention, influence emotions and preferences by creating dramatic
lighting effects in retail environment (Rompay, Tanja-Dijkstra, Verhoeven, & Es, 2012).
Turley & Milliman (2000) also consider lighting as an atmospheric characteristic and they include lighting under the title of general interior variables that influence customer behavior (Turley & Milliman, 2000). They explain that atmospheric influences have been researched on a wide variety of dependent variables, but sales, time in the store and approach-avoidance behavior are the most examined
dependent variables. Beside these explanations they add that there is a gap in the researches about considering other methods beyond the approach-avoidance behavior that could be connected with emotions (Turley & Milliman, 2000). This study tries to understand if there is a connection between emotional responses and behavior mapping studies rather than exploring approach-avoidance behavior by recording the same activities that are used in previous studies.
Tantanatewin & Inkarojrit also uses color and lighting as atmospheric tools that have influence on retail impression and identity (Tantanatewin & Inkarojrit, 2016). Decré & Pras also consider lighting as a marketing tool that affects people’s impression from brand and they support lighting color temperature is a strong tool for influencing customer’s feelings. However, they create a virtual experiment setup to conduct their study (Decré & Pras, 2013).
Kumar & Kim also regard lighting as an environmental cue and atmospheric but they test if this environmental cues could be used to create a specific brand effect or not (Kumar & Kim, 2014). More recently, Murray et al (2017) consider design
7
elements of environment as atmospheric tools and they examine the complexity of these tools as the independent variables that have impact on customers’ perception (Murray, Elms, & Teller, 2017).
2.1.1. Lighting Sources in Stores
Kruithof suggests a method for achieving a ‘pleasing effect’ based on a plot of the correlated color temperature (CCT) against the illuminance for indoor lighting design. He uses the illumination sources as fluorescent and incandescent lamps (Kruithof, 1941). The Kurithof Curve defines that color temperature between 2500K and 3000K considered as pleasing when the illuminance levels are between 200 and 500 lx. 5000K and 6500K color temperatures considered as pleasing when the luminance levels are between 300 and 50,000 lx (Figure 1).
Figure 1: The Kurithoff Curve
Lately, Chen et al. (2016) conduct a study with LED lighting fixtures and they find that the pleasant zone found in this study partially agrees with Kruithof’s rule. The
8
aim of their study is to analyze the emotional effects of museum lighting conditions with the usage of LEDs (Chen, Chou, Luo, & Luo, 2016).
According to US pattern institute, 6000K-6500K considered as Cool White color temperature (creates a cool, a refreshing atmosphere), 5000K color temperature considered as Natural Daylight color temperature (creates a natural atmosphere) and 2700K-3000K regarded as Warm White color temperature (creates a calm
atmosphere) (US Patent No. 0264.193, 2004).
Ko et al. consider display lighting as accent lighting and they support that lighting influences product sales by enhancing perception and preference. They add accent lighting has greater impact on customer’s reactions than general lighting (Ko, Kim, Choi, & Sung, 2016). They use 3000K and 4500K color temperature for the LED spot lights. They also change the angle of track spots as 20o and 30o search the effect of
angle. They find that most preferred accent lighting condition is provided with 3000K and 300 angle track spots (Ko, Kim, Choi, & Sung, 2016).
Hwang et al. also conduct a study in an experiment room to discuss the influence of lighting color on occupant comfort, they find that white tones color temperature of each lighting condition (red, blue, green) considered as more comfortable in an indoor environment (Hwang, Lee, & Kim, 2011). It means that white color temperatures are considered as more comfortable.
Another study again uses Warm (2700K) and Cool (6500K) White color temperatures to analyze color temperature effect on mood and feelings between genders (Kuijsters, Redi, Ruyter, Seuntie¨ , & Heynderickx , 2015). The aim of mentioned study is designing pleasant affective ambiences, using the psychological effects of colored lighting. They consider low (2700K) color temperature as low arousal ambience, as
9
cozy and higher color temperature as high arousal ambience as activating. They try to describe creation and evaluation the term of pleasant in cozy and activating
environment. They try to analyze the CCT effects in these environment between younger and older participants. They find that younger people need higher
temperature to feel pleasant than older people (Kuijsters, Redi, Ruyter, Seuntie¨ , & Heynderickx , 2015). Custers et al. also explain that “cool white light has also been shown to be arousing” (Custers, Kort, IJsselsteijn, & Kruiff, 2010).
Schielke and Leudesdorff also take an experiment to explore the influence of fashion retail store lighting on the brand classification and brand personality. They support that stores need to use general lighting, vertical illumination, accent lighting and projection to create high quality store image (Schielke & Leudesdorff, 2015). In another study, difference correlated color temperature effects on participants are observed and the differences between younger and older people are found (Knez & Kers, 2000). The mood is considered as dependent variable while CCT considered as independent. Results show that the negative mood of younger people increased under warm white color temperature while they are working for 90 minutes while the negative mood of older adults increased under cool white color temperature (Knez & Kers, 2000).
Another study explains that the greatest emotional responses are gathered under color temperature between 2700K and 3000K for food stores. On the contrary, the least influence on the customers’ emotions under the cold light sources (6000K-6500K) with the light emitting sources: LEDs (Nagyová, Berčík, & Horská, 2014).
Yılmaz supports that usage of different color temperature increases the pleasure levels of customers. Accent lighting system is mostly preferred for creating contrast and
10
dramatic effects in stores because this type of lighting could provide an expressive alteration in brightness and shadows that highlight specific products (Yılmaz, 2018).
2.1.2. Contrast
Contrast is a comparison that identifies differences in every atmosphere experience. Recognizing details and understanding visuals in everywhere is provided by contrast. In the literature there is a differentiation between luminance contrast and color (chromatic) contrast. These definitions come from the Kaufman’s explanations. He states that objects differentiate from their background because of the contrast. These contrasts could be resulted because of luminance contrast or color contrast (Kaufman , 1984).
Even the luminance contrast closely relats with the different brightness levels, under the same luminance levels there could be also contrast.
Another recent study tries to evaluate the contrast effect on (binocular rivalry) visual competition (Skerswetat, Formankiewicz, & Waugh, 2018). They find contrast creates more response on the brain than luminance. It proves that contrast increases the visual understanding of the objects around us (Skerswetat, Formankiewicz, & Waugh, 2018).
Kaufman (1984) mentions that contrast is also an outcome of chromatic information. The same illumination could create contrast because of the differences in wavelengths have reflectance of their own. If the light source has larger color saturation than the background light source even if it has the same chroma, this situation could create achromatic illuminance (Kaufman , 1984).
11
Contrast is the basic visual appearance which makes all tasks visible and visual behaviors possible. The human visual system derives no meaningful information unless there is a contrast in the environment. This means perception of contrast makes environment being viewed (Padgham & Saunders, 1975).
Padgham and Saunders (1975) add that contrast is the main effect that allows people to see, more specifically to differentiate a visual task from its surroundings. Beside the physical influences and definitions of contrast, there is also important
psychological of it. They also add that built-in mechanisms could increase the
perceived contrast. These mechanisms could relate with lighting and color qualities of environment (Padgham & Saunders, 1975). They explain that eye is not very capable of determining the intensity or intensity changes under uniformed illumination. However, visual system is much more sensitive to luminous changes, luminous discontinuities (Padgham & Saunders, 1975).
Jennings and Kingdom recently conduct a study to understand the contrast effect on perception, even if the picture is blurred Their findings demonstrate that contrast in Correlated color temperature and illuminance highly increased the perception of atmosphere (Jennings & Kingdom, 2017).
White et al. combine statistical models of visual perception with empirical data to understand how chromatic (hue/saturation) and achromatic (luminance) contrasts lead the detection and classification of stimuli in a complex forest environment. The data best proves a simple linear model of stimulus detection as an additive functionof both luminance and saturation contrasts (White, Rojas, Mappes, Rautiala, & Kemp, 2017). Their findings support that visual perception of contrast could lead people’s behavior and there is no significant difference on visual understanding and behavior for
12
luminous and saturation contrast cases (White, Rojas, Mappes, Rautiala, & Kemp, 2017).
Kim and Mullen also explore the influence of luminance and color contrast on visual perception. They explain that luminous contrast enhances perceived color contrast beside increasing the perception (Kim & Mullen, 2016).
Yılmaz (2018) highlights that to catch attention for marketing strategies, it is crucial that providing contrast rather than just a homogenous distribution of lighting in retail store atmosphere (Yılmaz, 2018).
Creating this contrast is possible to usage of general lighting with lower maintenance illuminance and combination with an accent lighting design strategy that has contrast color temperature. This accent lighting design strategy could increase the perception and attention of customers (Yılmaz, 2018). Another study also proves that contrast colored LED lighting increases perception and buying attitude of customer in food stores (Clare & Hancer, 2016).
Custers et al. mention that usage of contrast color temperature has significant influences on atmosphere perception of customers. They find that contrast lighting significantly reduces the feeling of tense (Custers, Kort, IJsselsteijn, & Kruiff, 2010). Tantanatewin and Inkarojrit also explain that enhancing contrast makes products interesting and attractive (Tantanatewin & Inkarojrit, 2016). Ampenberger et al. (2017) also they conduct a research with the aim of investigating lighting concepts with various lighting distributions and color contrasts which are constructed in a perception study. This study finds that when it compared with the homogenous illumination, zonal contrast illumination increases the perception (Ampenberger, Staggl, & Pohl, 2017).
13
Gong et al. also claim that preference and emotions are in a strong relationship between contrast. Their study demonstrate that contrast increases the perception and emotion but hue plays more important role than Chroma and lightness (Gong, Wang, Hai, & Xiaopeng, 2017).
2.2. Psychological Aspects of Lighting in Retail Stores
Turley & Milliman (2000) indicate that there are several studies that explore the influence of environmental cues on shopping behavior (Turley & Milliman, 2000). Emotions, perceptions, mood and impression are some of the considerations that regarded as psychological factors influence the shopping behavior.
Lombana & Tonello support that activation and evaluation are the emotional dimensions that are desired in retailing. In their study, they try to analyze these emotional dimensions with creating different lighting and color schemes on computer simulation (Lombana & Tonello, 2017). They include that manipulation of lighting can influence perception and emotion by creating pleasant atmosphere suitable for spending time that is required for purchasing (Lombana & Tonello, 2017). DiLaura et al. also explain that “lighting can be used to create excitement, and exciting store design has been identified as a contributor to purchase” (DiLaura, Houser, Mistrick, & Steffy, 2011).
Quartier et al. (2014) also explore the impact of lighting on atmosphere perception, emotions and behavior of customer. They use realistic setting as a three-dimensional stimulated supermarket (Quartier, Vanrie, & Cleempoel, 2014). They create semi-realistic food supermarket and search about the influence of lighting color on
14
emotions and behavior. In another study, Quartier (2011) also supports that 3000K color temperature create more pleasurable environment (Quartier, 2011).
Positive emotional responses are considered as creating a high perception of product quality, high recommended intention and likelihood of purchase. In addition, these product quality perceptions have significant positive influence in behavioral responses (Ladhari, Souiden, & Dufour, 2017).
Another study analyses impacts of store characteristics that include product
availability, product quality, store layout, employee politeness, décor, music, lighting, and aroma on the shopping experience of customers (Triantafillidou, Siomkos, & Papafilippaki, 2017). They consider various psychological components like hedonic, flow, escapism, challenge, learning, socializing, and communication for the shopping experience (Triantafillidou, Siomkos, & Papafilippaki, 2017). They find that product quality and in-store music were found to be the most influencing in-store
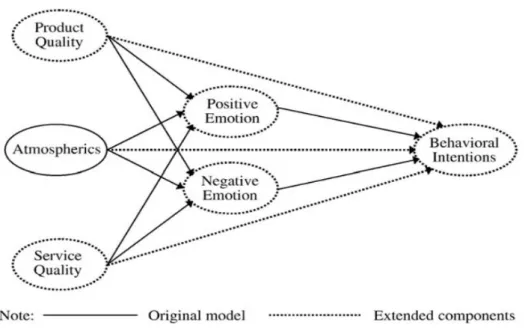
characteristics that affected the majority of psychological dimensions. Other important store attributes that emerged are store layout and ambient scent. They include lighting under the title of ambient scent. (Triantafillidou, Siomkos, & Papafilippaki, 2017). Jang and Namkung (2009) use structural equation modelling and they find that increasing atmospherics qualities including lighting increases positive emotions of customer (Figure 2). Their results also support that positive emotions mediate the relationship between atmospherics/ services and future behavioral outcomes. (Jang & Namkung, 2009).
15
Figure 2: Jang & Namkung's Extended Emotion and Behavior Model
Yılmaz (2018) explains that with the consideration of literature review, it is obvious that lighting is a dominant component of retail environment and can influence not only brand image but also the level of perception toward the quality of atmosphere (Yılmaz, 2018). Yılmaz’s study attempts to analyze how effective different lighting techniques in creating perception and the study tries to get quantitative results by gathering means of an environmental subject (Yılmaz, 2018).
Another study, that is conducted in a stimulated laboratory conditions, search about the color temperature and color rendering index on the attraction of customers. They state that by using accent and dramatic lighting, it is possible to create unique
shopping environment that could lead customers to stay longer and return to the store (Bercík , Horska, Wang, & Chen, 2016). They support that visual stimuli have a potential to overcome all other senses and their paper deals with a comprehensive research on the influence of light and color on the emotional state of customers on the food market (Bercík , Horska, Wang, & Chen, 2016). They use 2700K, 3000K, 4100K and 5600K color temperatures and their findings support that “warm-white
16
color temperature positively affects the intensity of well-being and mental state and negatively affects the power of concentration” (Bercík , Horska, Wang, & Chen, 2016).
Bustamante & Rubio (2017) explain a review in their study and they measure customer experience to undertand the effects of in-store settings on the customer response and eventually on customer behavior (Bustamante & Rubio, 2017). They state that behavior of customer is strongly connected with the experiences of customer in-store and these experiences are related with atmospherics (Bustamante & Rubio, 2017). Wang et al. also support that LED light would lead to less tense, more cosy, more safe and more lively atmosphere perceptions (Wang, Luo, Liu, Yang, & Zheng, 2014).
Seo & Fiore use S-O-R model for explore the shopping experience on overall
customer assessment about the store. Their focus group is “older” women (age 65 and older) and their focus space is fitting room. They examine the impact of the fitting room area on older female customers’ perceptions and behavioral intentions (Seo & Fiore, 2016).
17
CHAPTER III
EMOTIONAL AND BEHAVIORAL RESPONSES OF
COSTUMERS
3.1. Emotional Analysis of Customers
Emotional analysis of customers has been searched in several studies as it is considered influencing customers’ behavior in commercial spaces. Mehrabian and Russell (1974) define an approach to psychology to measure emotions and most of the researches conducted in commercial spaces still use this method to measure emotions (Mehrabian & Russell, 1974).
Quartier et al. mention that designing commercial spaces is important for both psychological needs of customers and functional needs for the environmental requirements. They use Mehrabian and Russel’s M-R model to analyze customer emotions and their questionnaire includes Pleasure and Arousal levels of emotional responses (Quartier, Vanrie, & Cleempoel, 2014).
Peng and Hung analyze customers’ emotional reactions as loyalty for luxury
restaurant and they also use extended Mehrabian- Russel M-R model as methodology (Chen, Peng, & Hung, 2015).
18
Krause and North also use the Mehrabian and Russel PAD scale to analyze emotions for the music concept and environmental context (Krause & North, 2014).
Mehrabian-Russel Model (M-R model) basically consists of three phases. These phases called Stimulus (S)- Organism (O)- Response (R) taxonomy. Lately, Donovan Rossiter (1980) modified and defined this taxonomy (Donovan & Rossiter, 1980). Several studies use this paradigm recently (Figure 3). This model basically covers the interactions between space and customer’s emotion, mood and behavior. In this taxonomy, environmental stimuli (S) considered as the atmospheric cues that lead reactions in organism (O) and organism causes responses (R) of customer (Quartier, 2011).
Figure 3: Stimulus-Organism-Response Taxonomy
Another interpretation of this S-O-R model is defined by Eroglu et al. they conduct a study for online shopping. They mention that usage of M-R model is still effective to measure reactions of people to analyze behavioral influences toward shopping (Eroglu, Machleit, & Davis, 2003).
There are several emotion measurement scale in marketing field (Machleit & Eroglu, 2000). The three categories of emotion that marketers mostly used in the marketing field are Izard’s ten fundamental emotions from his Differential Emotions Theory (Izard, 1977), Plutchik’s eight basic emotion categories (Plutchik, 1980) and Mehrabian and Russell’s (Mehrabian and Russell, 1974) Pleasure, Arousal and
19
Dominance scale (Izard, 1977). Havlena and Holbrook (1986) compare these three typologies with the regard of consumption and they found (Havlena & Holbrook, 1986). That PAD scale questionnaire includes more information about the emotional characters rather than other two typologies (Machleit & Eroglu, 2000).
Mehrabian and Russel suggest that whatever the behavioral response is it is the result of basic emotional responses. They cover Pleasure, Arousal and Dominance (PAD) levels of feelings as emotional levels of responses (Mehrabian & Russell, 1974). There are several studies use PAD scale to measure emotional responses.
Huang et al. explain that pleasure is an emotion that reflects extreme unhappiness to extreme happiness. Arousal means to person’s degree of excitement and stimulate. Dominance refers to the person’s feeling of she/he control his reactions toward environmental stimuli rather than environmental stimuli controls his reactions. The PAD model suggests that environmental stimuli influence the three main emotions of customers and this influences the behavior of customers in the environment (Huang , Ali, & Liao, 2017). Another online study find that pleasure and arousal levels of emotions have positive influence of online shopping behavior (Richard & Chebat, 2016).
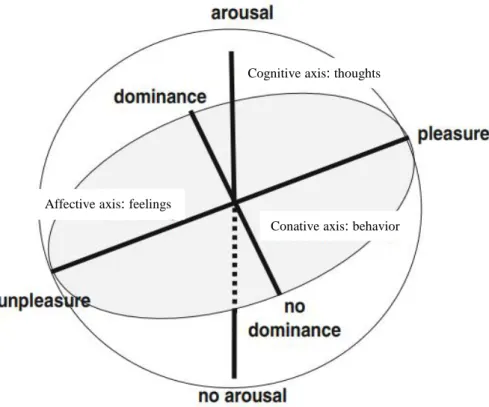
Baker et al. also demonstrate the original ideas of Mehrabian and Russel about pleasure, arousal and dominance levels. However, they connect PAD scale with feeling, thinking, acting. It means that rather than using S-O-R paradigm as stimulus-organism-response, they consider these actions as feeling, thinking and acting. In these scope, they regard PAD scale three dimensional graphic (Figure 4). They regard PAD scale as three dimensional model as tripartite view of experience (Bakker, Voordt, Vink, & Boon, 2014: 416).
20
Figure 4: Three Dimensional Model as Tripartite View of Experience According to Bakker et al. (2014: 416).
3.2. Behavior Analysis of Customers
Most of the retail store studies which use M-R model as a methodology, used the suggested outcomes that model support. These outcomes are measurements of customer behavior. These behavior of customers considered as approach/avoidance behavior (Mehrabian & Russell, 1974).
Approach behavior are results of positive emotions that cause spent more time, return and buying intentions. Avoidance behavior are results of negative emotions that lead customer leave the store and not buying intentions (Tang & Zhang, 2018).
Cognitiveaxis: thoughts
Conativeaxis: behavior
21
Nisco & Warnaby recently use the M-R model and test the effects of emotions on approach behavior. They test the time spent and spent money to understand the influence of pleasure and arousal levels on behavioral intentions (Nisco & Warnaby, 2014).
Tsaur et al. also conduct a study that uses M-R model and behavioral intentions of customers. They suggested that positive emotions influence behavioral intentions as spending more time in shopping environment (Tsaur, Luoh, & Syue, 2015).
To analyze the behavioral activity of customers, some studies use video camera tracking. Landmark and Sjøbakk use the technological method and prefer radio frequency (RFID) distribution (Landmark & Sjøbakk, 2017). In this study, there is only visual outputs that show the movement of customers. Beside the control area is limited with the fitting rooms. They basically introduce the usage of RFID usage to observe behavior (Landmark & Sjøbakk, 2017).
In another study, Barlı et al. (2012) record time spent to analyze behavior and find that white colored soft lighting conditions are positively associated with the increase of time spent but red colored lighting has negative association with behavior (Barlı, Aktan, Bilgili, & Dane, 2012).
Bailey and Burch mention that there are several ways to analyze behavior of people in public space. They explain that with the consideration of the target, visual cameras, sketches, drawings and coding methods could be preferred (Bailey & Burch, 2017; Larson, Bradlow, & Peter , 2005).
Marušić & Marušic (2012) explain that behavior mapping is a production of
observation method. (Marušić & Marušic, 2012). Ittelson et al. (1970) first introduced the behavior mapping method to record behavior when it occurs in a design setting
22
(Ittelson, Rivlin, & Prohansky, 1970). In the literature, there some studies used behavior mapping to understand the interaction between user and environmental setting (Marušić, 2011) most of these studies conducted in outdoor environment but it suggested that behavior maps could be used in public areas (Albouy, Leibovici, & Warman, 2013).
In this thesis study, Mehrabian-Russel model and their PAD scale of adjective pairs are used as methodology. PAD scale used for emotional analysis and time spent. Activity coding and behavior maps are used for behavioral analysis. Time spent is measured to understand approach behavior of customer under three different lighting conditions. Beside this method, manual behavior mapping and activity coding study is also conducted.
Observing spaces via behavior mapping seems as a kind of optimal scanning process which can provide successful decision-making and designing process. Behavior maps could be considered as direct links between users and places in physical and
functional ways (Marušić & Marušic, 2012).
Behavior mapping is the recording actions technique that requires observation. This observation includes spatial features and people activities in a link with time and space (Goličnik, 2005).
Marcus & Francis (1998) explain that behavior mapping is a valuable method that gives insight into the designed spaces and how designs work (Bechtel R. B., 1987; Marcus & Francis, , 1998). They add that this method “uses at the micro scale to map indoor and outdoor space” (Bechtel R. B., 1987).
23
Marušić & Marušic (2012) explain that there are some fundamental requirements that should be prepared before the any recording of behavior can initiate. These
requirements;
Map of the designed space that should be clearly defined The schedule of time that will be the same for each participant
Table for coding, counting and analysing of the activities (Marušić & Marušic, 2012).
In another study, that uses behavior mapping method to analyze children behavior in open spaces, Cosco et al. observe the open space playground equipment design effects on children play activities (Cosco, 2006; Cosco et al., 2010). They regard behavior mapping as “unobstructive and objecticve observational method” for measuring the effects of design characteristics and space use on behavior. Cosco et al. add that behavior mapping is a space scanning method for pre-designed spaces and generally it is needed to record activities in this designed space for more adequate codding and examining activities (Cosco, Moore, & Islam, 2010). With this method, infleunces in an environmental setting on user behavior could be represented. These influences in designed environments are called affordances in open spaces but these forces that lead people to behave in different ways could be used as environmental stimuli in door environment as Mehrabian-Russel method previously defined (Mehrabian & Russell, 1974).
Behavior mapping comes through activity coding (in some references it called activity matrix) to draw the data on computer drawings as the output, there are maps with signals that reflects the activity intense and in some cases participant characteristics (Marušić, 2011).
24
Although a well-designed map could include information about activity, drawing a map could not be enough as recording board. Observer needs to take notes, make detailed schemes and record the time. To get adequate data and prepare well-defined behavior map, the literature shows that there is a need for activity coding and records (Marušić, 2011).
There could be different coding and mapping techniques depend on scale and the nature of the research (Goličnik, 2005). Ittelson et al. (1970) points out that is possible to include graphs, pictures, signs and other visuals in behavior maps (Ittelson, Rivlin, & Prohansky, 1970).
Behavior maps demonstrate people’s behavior in real spatial settings with the consideration of design issues. These types of maps require specific data record and before mapping, the observer needs to record activity codes, draw signs and explain the activities in detail to draw trustable maps. Recently, most of researches use technological devices for recording like GPS cameras. However, these studies mostly related with urban scale (Chiesura, 2004; Dempsey, 2012; ElGindy & Abdelmoty, 2014).
Marušić & Marušic (2012) explain that behavior mapping is a recod method that allows researcher to understand the people actions in real spatial settings, in this way designers could read and talk with their designed spaces. Marušić & Marušic (2012) also highlight that this kinds of maps are visual data that allow designers and
designers to modifications and reconciliations between design and research in the field of planning and designing the space again. To construct these kinds of complex relationships and read the people behavior in an efficient way, activity coding is a crucial step before the drawing of behavior map (Marušić & Marušic, 2012).
25
Literature review (eg. Bechtel et al., 1987) shows that activity tables are used often to recording behavior in indoor settings. Some tables rows representing physical
locations and columns representing behavior (Table 1). Table 1: Activity Coding Table Example
Goličnik (2005) tested two types of activity codings that serve behavior maps, these are: behavioral matrixes and drawn activity patterns (Goličnik, 2005). Results show that there are only a few cases where mapping as behavioral matrix is efficient. These cases are quite simple square shaped open places like square shape streets with
outdoor tables and chairs and people move only one circulation. In other cases, drawn behavioral maps by observer is more inappropriate (Marušić & Marušic, 2012).
26
CHAPTER IV
EXPERIMENTAL STUDY
The aim of the study is to understand whether different accent lighting conditions have influences on customers’ emotional and behavioral responses. In experiment, LED track spot lights were used as accent lighting and general lighting conditions kept same. General lighting was provided with 5000K (artificial daylight) LED stripe lights. In this experiment, contrast was provided with accent lighting with keeping general lighting conditions same. Observation method and questionnaire with bipolar adjective pairs were provided for measurement of behavioral and emotional
responses. Correlations between emotional and behavioral responses were also taken into the consideration.
27 4.1.1. Research Questions and Hypotheses
To achieve the aim of the study and to understand the correlations following research questions and hypotheses were set:
RQ1: What is the influence of color temperature on emotional and behavioral responses?
RQ2: What is the influence of contrast color temperature on emotional and behavioral responses?
RQ3: How emotional and behavioral responses are correlated with each other under three different lighting conditions?
RQ4: What is the influence of gender on emotional responses?
H1: Low color temperature have positive influence on emotional and behavioral responses.
H2: Contrast color temperatures have positive influence on emotional and behavioral responses.
H3: There is a correlation between emotional and behavioral responses under three different lighting conditions.
H4: There is a correlation between emotional responses and gender under three different lighting conditions.
28 4.2. Method of the Study
The survey was conducted with 90 participants who were customers visited the furniture store after 6 pm. Data were collected through a field study approach that involved observation and interviewing of subjects who aimed to buy furniture set. Participation was voluntary and customers who filled acceptance protocol were used as participant. Equal number of man and woman customers selected to evaluate if there was gender effect on emotions and behavioral intentions or not.
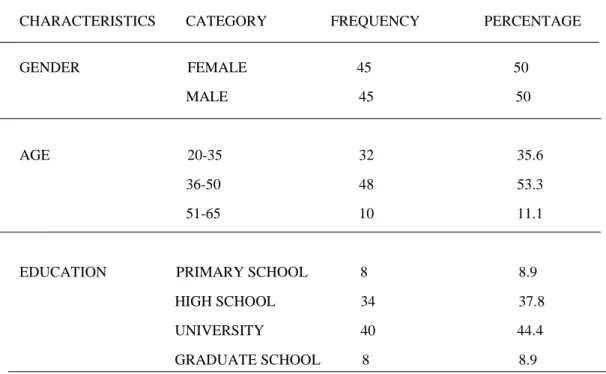
Analysis shows that mean age of the participants is 38.94. All participants have ages higher than 20 years and less than 65 years. The vast majority of the respondents (48 people, 53.3%) are in the 36-50 age range. Related to the education level of
participants, the highest percentage (40 people, 44.4%) is university students. Table 2 summarizes the demographic profile of participants.
CHARACTERISTICS CATEGORY FREQUENCY PERCENTAGE
GENDER FEMALE 45 50 MALE 45 50
AGE 20-35 32 35.6 36-50 48 53.3 51-65 10 11.1
EDUCATION PRIMARY SCHOOL 8 8.9 HIGH SCHOOL 34 37.8 UNIVERSITY 40 44.4 GRADUATE SCHOOL 8 8.9
29 4.2.2. Retail Store Settings
This study was conducted in a real furniture store in Etimesgut, Ankara, Turkey. The total area of the store is 230 m2 with the 3,5 meters ceiling height. Walls were covered with matte natural grey paint and columns covered with dark gray marble. Floors were covered with beige marble with brown strips. Location of the furniture set was in middle of general lighting, not in the direct zone from the entrance. The store was located in mezzanine floor that cannot get direct daylight (Figure 5 and Figure 6: plan and section of the store).
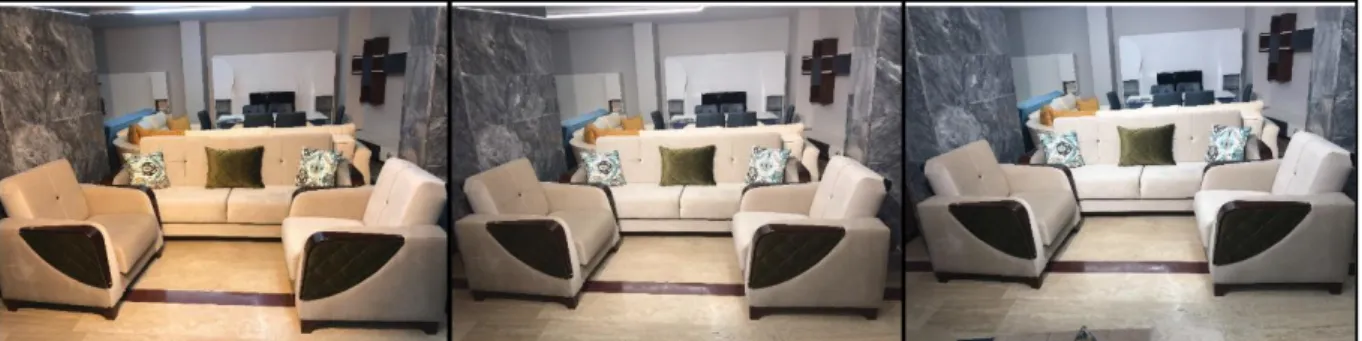
The furniture store plan layout and color of furniture setting were not considered as variables in this study. Thus, layout and colors kept same for three lighting conditions. The name of the furniture set was Aybüke in Ladin brand. The furniture set includes three pieces with one armchair for two people and two armchairs for single person. This set was used for experiment because it was the most sold furniture set with natural beige color (Figure 9). All other furniture layout and the chosen furniture set kept same to use the color temperature of accent lighting as independent variable.
30 Figure 5: Plan of the Store (not to scale)
31
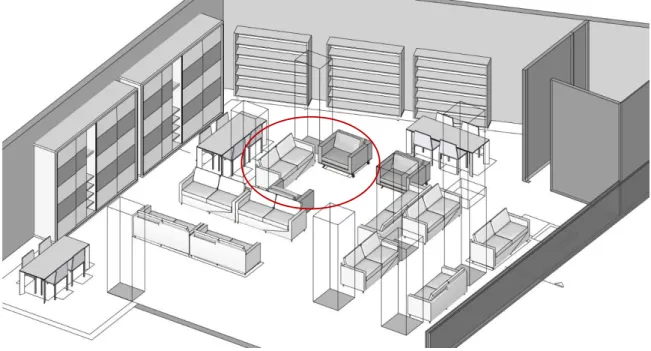
General lighting was provided by LED strip lights with 5000K (artificial daylight) color temperature. LED strips were located as a rectangle with 5x3 meters
dimensions. Axonometric view of the store shows the furniture layout (Figure 7). Columns are made invisible to show furniture layout clearly.
Figure 7: Axonometric Drawing of the Store
In this experiment, the color temperature of lights were changed on LED track spots that are shown in Figure 8. The angle of these track spots and the location was also important even if they were not considered as variables in the study as they were same for each color temperatured ligting fixture. The used angle of the fixtures was 450 with the horizontal axis (Figure 8).
32 Figure 8: The angle of Spot Lights
Ko et al. (2016) conducted a research on computer simulation of a retail setting and find that 450 angle for the products that with 120 cm and less height dimensions, mostly preferred by participants (Ko, Kim, Choi, & Sung, 2016). This finding was the guide for the usage of 450 vertical angle for the track spot lights. Because height of the furniture set was 110 cm from the floor. Okumura also found this angle suitable (US Patent No. 0264.193, 2004).
The illuminance levels for each color temperature were equal for each lighting
conditions and illuminance was not considered as a variable in this study. Illuminance levels were mostly in between 300-400 lx.
Three different lighting conditions were used as independent variable that were considered as having influences on costumers’ emotional and behavioral responses. These conditions provided by LED track spots as accent lighting on the specific furniture set. Color temperatures were 2700K (Warm White), 5000K (Artificial Daylight) and 6500K (Cool White). Table 3 shows technical data for each LED track spot.
33 Table 3: Technical data of LED track spots
Philips Master LED Track Spots Technical Data
L1 L2 L3
Correlated Color Temperature
Lamp luminous flux (lm) Luminaire wattage (W) Luminaire Image Ra Luminaire Luminous Intensity Distribution 2700 K 265lm 35watt ≥ 80 5000 K 280lm 35watt ≥ 80 6500K 300lm 35watt ≥ 80
Three color temperature of LED track spots were chosen as they are mostly preferred ones in the market (DiLaura, Houser, Mistrick, & Steffy, 2011). General lighting color temperature was 5000K that is provided by LED strip lights in exist. Figure 9a, 9b, 9c reflects the store setting under 2700K, 5000K and 6500K color temperature conditions.
34
Figure 9 a, b, c : The Furniture Set Under 2700K (left), 5000K (middle), 6500K (right) Color Temperature
4.2.3. Procedure
Observation and questionnaire survey methods were used in this study. As the nature of observation, at the beginning, customers were not aware of the experiment and walked in the store freely. For three different lighting conditions, three different sample groups were chosen. After customers finished their walk, the experiment and process of the study told them. The participant acceptance protocol was given and if the customer wants to be participant, the observer data was taken into the
consideration (Figure 10).
Experiment took one and a half months. Started on 7th November 2017 and 20th December 2017. To eliminate daylight conditions, experiment was conducted after 18.00. as the customers were real customers who visited the store, participants were chosen who came to the store after 18.00. customers were different for each lighting conditions. When the 30 people finished for each condition, other color temperature was mounted.
35 Behavior Mapping Lighting Conditions 2700 K (Warm White) 5000 K (Daylight) 6500 K (Cool White)
Accept Not Accepted
PAD Questionnaire Not Coded as A Participant
Activitiy Pattern Coded On Computer
Analysis of Effects of Color Temperature On Activity
Pattern
Analysis of Effects of Color
Temperature On Emotions Analysis of Relation Between Changes in Emotions and Changes in Activity Patterns Under Three Lighting Conditions
Participant Acceptance Protocol
36
The experimental study consisted of two parts, behavior mapping and questionnaire. Activity coding study was drawn by the observer to analyze behavioral responses. To analyze emotional responses, the used Questionnaire is Mehrabian and Russel’s Pleasure, Arousal and Dominance scale questionnaire and that is explained under PAD questionnaire section.
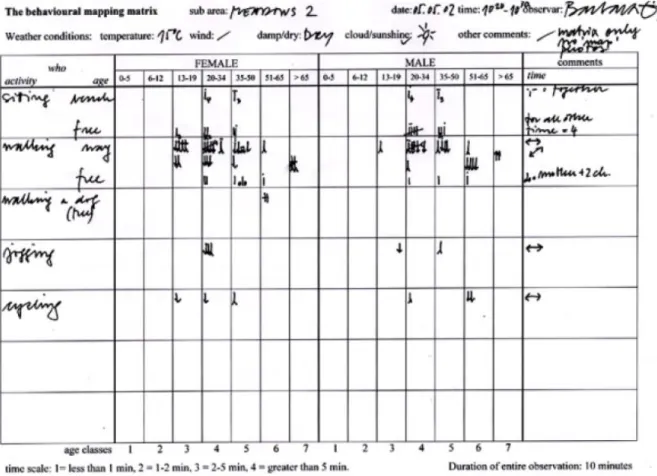
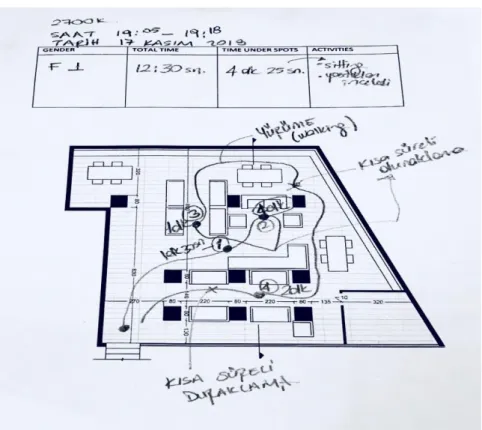
In this study, the observer coded each visited point of the customer and put dark dots for them and wrote time near the points as activity coding study (Figure 11). Figure 11 shows the example filled activity coding data sheet by the observer.
Figure 11:Example of The Observer’s Activity Coding Data Sheet
If the customer accepted to be a participant of the study, each activity pattern drawn on digital data sheet for each lighting condition. The order of visited points was also written like 1, 2, 3, 4 and these kind of quantitative data was used in SPSS 24.0 program to analyze the effects of lighting color temperature on circulation patterns.
37
Activity coding was used for giving order to activities. Visited points were recorded and the order visited points were given. Activity coding were given in separate plans for female and male under three lighting conditions.
Activity coding data sheet was used by the observer and customers were not aware of it. It was used to construct behavior mapping. Activity pattern analyzed in statistics and recorded the detailed activity patterns.
After the experiment, all drawings were transferred illustrator program. Routes of customers and visited points were drawn in digital program one after the other. This study provided clean visualizations to understand the behavioral intentions (Appendix A. Figure 1, 2, 3, 4, 5, 6).
Before questionnaire, customers were not aware of the experiment and they walked in the store freely. Observer coded their activity and draw sketches on the store plan (Appendix A. figure 1). Observer also recorded customers’ time spent and drew the points that customers walk, made low activity and vigorous activity. After hand drawing, the recorder drew the visited points of customers on illustrator program with giving color and gender codes. As it explained in the behavioral analysis section (part 3.2), behavior mapping method in the literature, mostly used in open places like public parks, children playground areas (Cosco, Moore, & Islam, 2010; Marušić & Marušic, 2012). To analyze the effects of enviromental settings on people’s behavior, it was also mentioned that, using this method in indoor spaces was also possible (Marušić, 2011).
The usage of activity coding data sheet, circulation patterns, time spent and the route of the customer were drawn. These data was reflected on behavior mapping with symbols and colors. Different genders were drawn with different symbols.
38
Color code was used in behavior mapping. To draw three different behavior maps for three different lighting color temperature, three color and their tints were selected. Red color was chosen for mapping under 2700K (WW), yellow was used for 5000K (DL) and blue is preferred for 6500K (CL). Three color tints were also preferred to reflect the activity time in spaces. Lighest red, yellow and blue was used to reflect walking activity. Medium tints of red, yellow and blue was used to reflect acvities in between 1 and 3 minutes. Activities takes more than 3 minutes reflected with the existing hue of red, yellow and blue. Appendix B includes maps under 2700K (WW), 5000K (DL) and 6500K (CL). Appendix B1 demonstrates completed behavior map for 30 customers under 2700K, Appendix B2 reflects behavior under 50000K and Appendix B3 demonstrates behavior of customers under 6500K.
Gender also illustrated with different shapes, triangle demonstrates female and square shape demonstrates male. These behavior mappings are summaries of behavioral responses of customers undr 2700K, 5000K and 6500K color temperatures. Figure 12 is the behavior map with squares and triangles under 2700K (WW) color temperature.
39
Figure 12: Behavior Map of 30 Customers Under 2700K (WW) Color Temperature
After customers finished their walk, they asked if they were volunteer to join the experiment as a participants or not. If they accepted the protocol, their activity patterns and coding considered and they asked to fill the emotion questionnaire. This questionnaire included PAD scale of paired adjectives defined by Mehrabian and Russel (Mehrabian & Russell, 1974) and lastly modified by Donovan and Rossiter (Donovan R. J., Rossiter, Marcoolyn, & Nesdale, 1994).
PAD scale of measurement included Pleasure, Arousal and Dominance levels of emotions. Pleasure level has 6 items that consisted of adjective pairs that were considered as opposite. In the same way, Arousal level included 6 item and Dominance level had 4 items. Customers filled the 5 scale table as extremely
40
negative, negative, neutral, positive and extremely positive (Table 4). The table was
constructed in English but in the experiment, Turkish translated version was preferred (see Appendix C).
Records come from activity coding and PAD questionnaire was used in statistical analysis and records come from drawings on plans reflected illustrator program to draw behavior mappings.
Before the correlation analysis and difference tests, Shapiro-Wilk normality test was conducted to understand if the variables distributed as a normal curve or not. Results revealed that samples were normally distributed (p>0.05). Because of the this finding, other tests were conducted as parametric tests.
In order to analyze the effect of color temperature on emotional responses, ANOVA Test of Independence was conducted. This test was used for Pleasure, Arousal and Dominance (PAD) scale of emotions separately under three different color
temperature. To analyze if color temperature had influence Pleasure level, Arousal Level and Dominance level, descriptive statistics were also used to understand the changes in means under different color temperatures.
To analyze if there were influences of color temperature on behavioral responses, independence tests were used. As behavioral responses divided into two parts as circulation patterns and time spent, ANOVA tests were conducted both for circulation patterns and time spent under 2700K, 5000K and 6500K color temperature. ANOVA tests were preferred because there were multiple comparisons in this study. In the experiment, three different lighting conditions were prepared and analysis between three of them need to be conducted.
41 Table 4: PAD Adjective Pairs
42 4.3. Results
4.3.1. Effects of Color Temperature on Emotional Responses
To understand if lighting color temperature has influence on emotional responses, the test was used to compare means of emotional responses under three different lighting conditions. ANOVA test was considered as suitable to compare means in between three different sample groups.
There are equal number of participants for each lighting condition and Argyrous explains that ANOVA F-test is appropriate for measuring equality of means
(Argyrous, 2011). Statistical analysis for three different lighting conditions showed that there are differences on emotional responses under three different lighting
conditions. ANOVA table (F=34.753, df=2, p=0.0001, α=0.05, p< α) shows that there is a difference on emotional responses under three different lighting conditions
(Appendix A. table 1). After finding that lighting color temperature has influence on emotional responses, descriptive statistics and mean values examined in detail to understand if there is a contrast effect on emotional responses.
Emotional responses changed under all these three lighting conditions. 2700K (WW) and 6500K (CW) color temperatures considered as contrast color temperatures since general lighting color temperature is daylight color temperature (5000K). LED track spots with WW and CW color temperature had positive influence on emotional responses. WW color temperature increased pleasure, arousal and dominance levels more than CWcolor temperature. Mean value for emotional responses equals 54.10 under 2700K, 34.40 under 6500K and 29.30 under 5000K. this explains that total ranks of Pleasure, Arousal and Dominance levels are highest under 2700K and lowest
43
under 5000K color temperature. Table 5 shows mean values for each adjective pairs under three different color temperatures. Ratings between 1 and 5 were included in 5 scale Likert adjective pairs (eg. bored-entertained: 1-2-3-4-5). 1: extremely negative, 2: negative, 3: neutral, 4: positive and 5: extremely positive.
Table 5: Mean Values For Adjective Under Three Different Lighting Conditions 2700K WW 5000K DL 6500K CW Bored-entertained 4.4 2.8 2.7 Despair-hopeful 4.7 2.6 2.6 Unhappy-happy 4.3 2.5 3.6 Melancholic-contented 3.7 2.5 2.9 Annoyed-pleasure 4.8 2.2 3 Dissatisfied-satisfied 4.6 2.3 2.8 Calm-excited 4 2.3 2.8 Unaroused-aroused 4 2.5 2.4 Dull-jittery 4.3 2.4 2.7 Relaxed-stimulated 3.3 2.3 2.7 Sleepy-wide awake 4 2.5 2.4 Sluggish-wild 4 2.3 2.9 Dominance-submissive 3.4 1.9 2.5
In control- cared for 2.8 2.2 3
Autonomous-guided 3.3 2 2.73 Influential-influenced 2.9 1.8 2.23 TOTAL MEAN 3.9 2.3 2.7 P L EA S URE AROU S A L DO M INA NCE
44
Table 6 shows the semantic ratings of emotion ranks under three different lighting conditions. Red color reflects ranks under 2700K, blue reflects ranks under 6500K and yellow reflects ranks under 5000K (Table 6). It is shown that 2700K color
temperature caused highest changes on emotional responses when the results are more similar under 5000K and 6500K color temperatures.
Table 6: Semantic Ratings Under 2700K (Red), 5000K (Yellow) and 6500K (Blue)
Pleasure:
Extremely Negative (1) negative (2) neutral (3) Positive (4) Extremely Positive (5) Bored Entertained despair Hopeful Unhappy Happy Melancholic contented Annoyed Pleasure dissatisfied satisfiedArousal:
Calm Excited Unaroused Aroused Dull Jittery Relaxed StimulatedSleepy Wide awake
Sluggish wild
Dominance:
Dominance Submissive
In control Cared for
Autonomous Guided
45
4.3.2. Effects of Color Temperature on Behavioral Responses
Behavioral responses considered as customers’ route when they were walking around, which is titled as circulation patterns, time spent under illuminated area with track spot lights and behavior maps which is the visual illustration that reflects the time spent and activity types of customers under three different lighting
condition. ANOVA tests for independency, correlation coefficients and Scheffe analysis were conducted to understand the influence of color temperature on behavioral responses.
Circulation patterns evaluated with activity coding method. This method allowed observer to code visited spaces in store and these codes used for statistical analysis to understand if circulation patterns influenced from color temperature or there is not significant influence. Correlation coefficients and ANOVA test for
independency tests are conducted for statistical analysis.
Circulation patterns evaluated with observation method. Activity coding and manual behavior mapping methods used for the study. Activity coding used to explore changes in visiting order of customers (changes in circulation paths). Specifically illuminated furniture set especially observed. Changes in activity patterns analyzed. Observer draw the route of each customer on map manually and noted visited products with the order of visiting (See Appendix B. figure 1, 2, 3, 4, 5, 6). Standardized coefficients beta equals .727 at 0.05 significance level and it explains that there is a strong, high, marked association between color temperature and visiting order of customers (Appendix A. Table 2).
46
This result demonstrates that circulation pattern of customers changed under different lighting conditions. It means that visiting order depends on color temperature. ANOVA test (F=34.753, df=2, p=0.0001, α=0.05, p< α) for
dependency results also prove that circulation patterns and color temperature is not independent from each other.
Mean values and multiple comparisons show that people visited the furniture set in an early order when it illuminated with contrast color temperatures (Appendix A, Table 1). WW color temperature (2700K) and CW color temperature (6500K) are considered as contrast color temperatures for this study because general lighting condition has DL color temperature (5000K). Results show that WW color temperature had more significant influence on circulation path than CW color temperature. DL color temperature created at least significant influence when it compared with WW and CW color temperatures. For the understanding of relation between time spent and color temperature, total amount of time spent in store and time spent under illuminated area with the 15.22 minutes under when the color temperature is WW (2700K). When color temperature is CW (6500K) the average time spent is 11.18 minutes. The mean value is 9.69 when the color temperature is DL (5000K). correlation coefficients analysis is conducted to understand the relation between color temperature and total time spent. Correlation demonstrates that there is a negative, moderate association between color temperature and time spent (β value is -.339). It means that, people spent more time when the WW (2700K) color temperature used.
The mean value of time spent in front of the illuminated furniture set 6.01 minutes under when the color temperature is WW (2700K). When color temperature is CW (6500K) the average time spent under LED spots is 4.13 minutes. The mean value