ISTANBUL BILGI UNIVERSITY FACULTY OF SOCIAL SCIENCES
MASTERS IN MARKETING
SERVICE QUALITY AT FOOTBALL STADIUMS AND ITS EFFECT ON GAME ATTENDANCE
Zeliha Eylül ARSLAN 114689010
Supervisor: Doc. Dr. Gülberk Gültekin SALMAN
İSTANBUL 2017
ACKNOWLEDGEMENTS
I would like to express my gratitude and thank my thesis supervisor Prof. Dr. Selime Sezgin for her support throughout my graduate studies and for instilling in me the passion to learn and to teach.
I wish to extend my thanks to Doç. Dr. Gülberk Salman for her academic guidance for this thesis, careful and constructive review of the final manuscript and attending my defense jury.
I further extend my personal gratitude to the interviewees, Beşiktaş JK Vodafone Arena Stadium Director, Mr. Ahmet Ateş; Fenerbahçe SK Stadium Manager, Mr. Ayhan Baki; Galatasaray SK Commercial Director, Mr. Özgür Gündoğan for their time and significant contribution for the formation of this thesis.
I am grateful to my family for their continuous support and for helping me to keep my feet on the ground at times.
I would like to thank my talented friend, Meray Uyanık for her designs.
Finally, I would like to thank all the participants who took part in this study through the survey and in-depth interviews.
Zeliha Eylül Arslan Istanbul, 2017
CONTENTS Page No. CONTENTS... iv ABBREVIATIONS...vii LIST OF FIGURES...viii LIST OF TABLES...ix ABSTRACT... xii 1. INTRODUCTION... 1 2. LITERATURE REVIEW... 3 2.1 SPORT MARKETING... 3 2.2 SERVICE QUALITY... 4
2.2.1 Service Quality Dimensions... 8
2.2.2 Service Quality Models... 9
2.2.3 Sport Service Quality Models...10
3. METHODOLOGY... 11
3.1 CONCEPTUAL FRAMEWORK... 11
3.1.1 Aim of the research...12
3.1.2 Variables...13
3.1.3 Sample... 17
3.1.4 Choice of research approach...18
3.1.5 Research Questions...18
3.1.6 Research Model and Hypothesis... 18
3.1.6.1 Proposed Model of the Research... 19
3.2 RESEARCH METHOD...21
3.2.2 Research Design... 22
3.2.3 Data Analysis...25
3.3 FINDINGS... 25
3.3.1 Demographic Distribution... 26
3.3.1.1 Examination of Findings Related to Service Quality at Sporting Events in Turkey Based on Demographic Variables...27
3.3.1.1.1 Testing The Statistical Significance of Gender Differences in Perceived Service Quality at Sporting Events... 27
3.3.1.1.2 Testing The Statistical Significance of Marital Status Differences in Perceived Service Quality at Sporting Events...29
3.3.1.1.3 Testing The Statistical Significance of Education Differences in Perceived Service Quality at Sporting Events...31
3.3.1.1.4 Testing The Statistical Significance of Work Differences in Perceived Service Quality at Sporting Events... 33
3.3.1.1.5 Testing The Statistical Significance of Revenue Differences in Perceived Service Quality at Sporting Events...34
3.3.1.1.6 Testing The Statistical Significance of Team Differences in Perceived Service Quality at Sporting Events... 37
3.3.1.1.7 Testing The Statistical Significance of Season Ticket Differences in Perceived Service Quality at Sporting Events...39
3.3.2 Factor Analysis...40
3.3.2.1 Revised Model of the Research... 42
3.3.3 Reliability... 44
3.3.4 Correlations... 45
3.3.5 Regression... 50
3.3.5.1 Finalized Model of the Research... 52
3.3.5.1.1 Regression Weights of the Finalized Model... 54
4. CONCLUSION...56
4.1 MANAGERIAL IMPLICATIONS...56
4.2 LIMITATIONS AND RECOMMENDATIONS FOR FUTURE RESEARCH...58
Appendix 1 – QUESTIONS FOR STADIUM MANAGERS... 60
Appendix 2 – QUESTIONS FOR FOCUS GROUPS... 62
Appendix 3 – SURVEY QUESTIONS FOR FANS...64
Appendix 4 – PROPERTIES OF SURVEY QUESTIONS... 68
ABBREVIATIONS
BJK Beşiktaş JK
FB Fenerbahçe SK
LIST OF FIGURES
Page No. Figure 1. Various Goods Listed in Relation to their Tangible and Abstract Qualities.5
Figure 2. Proposed Model...19
Figure 3. Revised Model...42
LIST OF TABLES
Page No.
Table 1. Variables...17
Table 2. Frequencies and Percentages of Demographic Information for the Spectators ... 26
Table 3. Independent T-Test Results on Service Quality at Sporting Events (On the Basis of Gender)... 27
Table 4. One-way ANOVA Results on Service Quality at Sporting Events (On The Basis of Marital Status)... 29
Table 5. One-way ANOVA Results on Service Quality at Sporting Events (On The Basis of Education)...31
Table 6. Independent T-Test Results on Service Quality at Sporting Events (On the Basis of Work)...33
Table 7. One-way ANOVA Results on Service Quality at Sporting Events (On the Basis of Revenue)...35
Table 8. One-way ANOVA Results on Service Quality at Sporting Events (On the Basis of Team)...37
Table 9. Independent T-Test Results on Service Quality at Sporting Events (On the Basis of Season Ticket)... 39
Table 10. Rotated Component Matrix... 40
Table 11. Reliability... 44
Table 13. Weighted Regression Results of Organizational Identification... 51
Table 14. Weighted Regression Results of Convenience...51
Table 15. Regression Weights of Organizational Identification... 54
Table 16. Regression Weights of Convenience...54
Adı ve Soyadı : Zeliha Eylül Arslan
Danışmanı : Yrd. Doç. Dr. Gülberk Gültekin SALMAN Türü ve Tarihi : Yüksek Lisans Tezi, Mayıs 2017
Alanı : Pazarlama
Anahtar Kelimeler : Spor Pazarlaması, Hizmet Kalitesi, Stadyum
ÖZET
FUTBOL STADYUMLARINDA HİZMET KALİTESİNİN
MAÇLARA KATILIMA ETKİSİ
Bu tezin temel amacı profesyonel futbol kulüplerinin taraftarlarına sunduğu hizmetin kalitesinin anlaşılması ve taraftarların stadyumlarda sunulan hizmet kalitesi algısını etkileyen fakt rler ile maça katılım arasındaki ilişkinin ortaya konmasıdır. Bu çalışma ayrıca Türkiye deki futbol seyircilerinin hizmet ve hizmet kalitesi algısının rgütsel zdeşleşme ve maça gitme sıklığına etkisini analiz etmeyi hedeflemekte olup, araştırma için kantitatif ve kalitatif araştırma y ntemi kullanılacaktır. alışma İstanbul da 3 büyük profesyonel futbol kulübü Beşiktaş, Fenerbahçe ve Galatasaray taraftarları incelenerek ortaya çıkmıştır. alışmada ncelikle kulüp stadyum direkt rleri ve taraftarlarıyla derinlemesine mülakat yapılmıştır. Bulgular rafine edildikten sonra pilot çalışma sonucunda 432 katılımcı ile gerçekleştirilen 58 sorudan oluşan amprik çalışmada, taraftarların iki temel boyuttan oluşan hizmet kalitesi algısı ve maça gitme sıklığını etkileyen rgütsel zdeşleşme ve elverişlilik fakt rleri ortaya konmuştur. Hizmet kalitesi, rgütsel aidiyet ve maça katılım arasında da anlamlı ilişkiler bulunmuştur.
Name and Surname : Zeliha Eylül Arslan
Supervisor : Yrd. Doc. Dr. Gülberk Gültekin SALMAN Degree and Date : Master, May 2017
Major : Marketing
Keywords : Sports Marketing, Service Quality, Stadium
ABSTRACT
SERVICE QUALITY AT FOOTBALL STADIUMS
AND ITS EFFECT ON GAME ATTENDANCE
The main purpose of this study is to understand service quality professional football clubs present to their fans and to reveal the relationship between factors that affect the fans perception of the service quality provided at stadiums and game attendance. This thesis also aims to analyze the effect of fans perception of service quality at football stadiums in Turkey on organizational identification and game attendance, using qualitative and quantitative research methods. The study is conducted with the fans of three biggest professional soccer clubs in Istanbul – Besiktas JK, Fenerbahce SK and Galatasaray SK. First, in-depth interviews are conducted with the clubs stadium managers and fans. Findings are refined and after the pilot study, the questionnaires consisting of 58 items are collected from 432 fans. As the result of this empirical study, it is discovered that fans service quality perceptions consisted of two dimensions and organizational identification and convenience factors prominently affected game attendance frequency. Relationships between service quality, organizational identification and game attendance are found to be significant.
Don't sell the steak, sell the sizzle. – Elmer Wheeler. 1. INTRODUCTION
Major spectator sports industry is a competitive industry that is continuously growing. Increase in prices leads to heightened customer expectations for event quality, which poses a challenge for sport organizations (Howard and Crompton, 2004). Yet, major professional sports leagues in the world are struggling to keep operational costs down while continuing to provide the finest on-field product and customer services (Ko, Zhang, Cattani & Pastore, 2011). High quality services promote customer satisfaction and loyalty in the service industry, enhancing the profitability of the service provider, in this case, the football clubs. From this perspective, it is critical for professional sports organizations to offer high-quality events and services to succeed in this competitive business environment (Anderson et al., 1994; Anderson and Sullivan, 1993; Dagger and Sweeney, 2007; Fornell, 1992). Service quality is identified as the most critical issue that contemporary sports marketers need to address, since it is a proxy measure of management performance, a significant aspect in the positioning of the club. Service quality is also a key factor in terms of consumer behaviour variables, such as spectators game attendance and building a loyal fan base, while generating higher revenues for the club (Martinez et al., 2010). In the context of spectator sports, the research shows that consumers primarily focus on these dimensions with regards to event quality: game performance; amenities and additional services; and event staff and service-delivery systems (Foroughi et al., 2014). Hence, it is argued that the quality of sports events should be evaluated as a combination of programs and service delivery processes (Getz, 2005).
In the recent years, service quality and spectator satisfaction became an important discussion topic with the industrialization of football. Despite of spectators severe interest and the budget that spectators constitute for clubs, it is thought provoking that the clubs have shortcomings in terms of service quality and face financial problems. Previously, clubs considered service quality merely as equivalent of sporting success, reflecting spectators narrow perspective on service quality, which resulted in limited value creation within the football world. Sporting
success is seen as quality service these days. The fact that fans are contending themselves with the meager service provided to them, making evaluations based on sporting success and not displaying rational reactions results in contradictions related to service quality in the football world. To bring service quality and spectator satisfaction to high level, improving the quality of existing products will not be enough; continuously presenting new products and memorable experiences to spectators is essential. It is critical to differentiate by being creative and seizing new opportunities in the market. As the spectators become conscious consumers, the consumption culture in football world will also change and with the increasing expectations, modern football sector will not be sustained with the usual products and methods, but rather by experiences.
Fan experience is shaped by the stadium atmosphere. The sport marketing literature focuses on the special atmosphere in sport stadiums as one of the most important reasons why spectators attend events. Yet, researchers paid little attention to the effects of sport stadium atmosphere on consumer behavior (Uhrich & Berkenstein, 2010). Previous research on atmosphere focused on retail stores almost exclusively (Turley & Milliman, 2000). The research on the store atmosphere yielded empirical evidence for the store atmosphere s positive effect on marketing such as length of stay (Donovan & Rossiter, 1982), repatronage intention (Babin & Attaway, 2000) and perceived pleasure (Baker, Levy, & Grewal, 1992; Spies, Hesse, & Loesch, 1997; Tai & Fung, 1997). The striking difference between the majority of service settings such as retail stores and the sport stadium is that the atmosphere in a stadium provides additional value to the core product, while creating a unique entertainment value. In fact, the total service experience may be determined by the entertainment value itself (Kotler, 1973). As Kotler predicted, this study will reveal how the service experience is determined by the game atmosphere, in other words, the entertainment value itself in the case of Turkish football spectators. Our understanding of the construct of sport stadium atmosphere is still at a rudimentary stage. It remains unclear what specific factors contribute to the service quality at football stadiums and the stadium atmosphere. There are no attempts in the literature to develop sport stadium atmosphere as a theoretical construct and to operationalize it for use in empirical studies. It is therefore impossible at present to investigate adequately the
relationship between stadium atmosphere and variables with important financial implications, such as on-site food and beverage consumption, spectator satisfaction, and positive word-of-mouth, all of which make up service quality (Uhrich & Berkenstein, 2010). This study attempts to conceptualize the relationship between service quality and game attendance.
2. LITERATURE REVIEW
As sport marketing gains momentum with recent developments in media, sponsorship and technology among others, this study focuses on service quality for sport marketing research. The fundamental concepts pertaining to this study are analyzed in the context of marketing literature, focusing on service quality at football stadiums.
2.1 SPORT MARKETING
Sport marketing is the specific application of marketing principles and processes to sports products and to non-sports products through association with sport (Shank, 2002). In the realm of sports, the demand for professional marketing has grown over time, as the needs and demographic makeup of sport consumers have become more complex. The competition for the spectator and participant spending has simultaneously increased. From professional teams to small college teams, every organization started to look for ways to attract and maintain consumers. In an attempt to create a coherent market to bring sport consumers with sport products and services, sport marketing came into existence. The term sports marketing was coined by Advertising Age in 1979 to describe activities done by marketers using sport for promotional purposes. The following definition of sport marketing is adapted from standard definitions of general marketing (Mullin, Hardy & Sutton, 1993):
“Sport marketing consists of all activities designed to meet the needs and wants of sport consumers through exchange processes. Sport marketing has developed two major thrusts: the marketing of sport products and services directly to sport consumers and the marketing of other consumer and
industrial products and services using partnerships and promotions with sport properties.” (p. 11)
Making up the sports marketing mix, sport marketing is the application of the four Ps of marketing (pricing, product, promotion and place) to a sport context with the end goal of meeting the needs of the sports customer (Morgan & Summers, 2005). Sport displays characteristics of a service such as intangibility, separability, perishability, and heterogeneity. Yet, sports also display tangible qualities of goods through merchandise and sport memorabilia. Sports customers may include spectators, sports participants, players, corporations and investors (Morgan et al., 2005).
2.2 SERVICE QUALITY
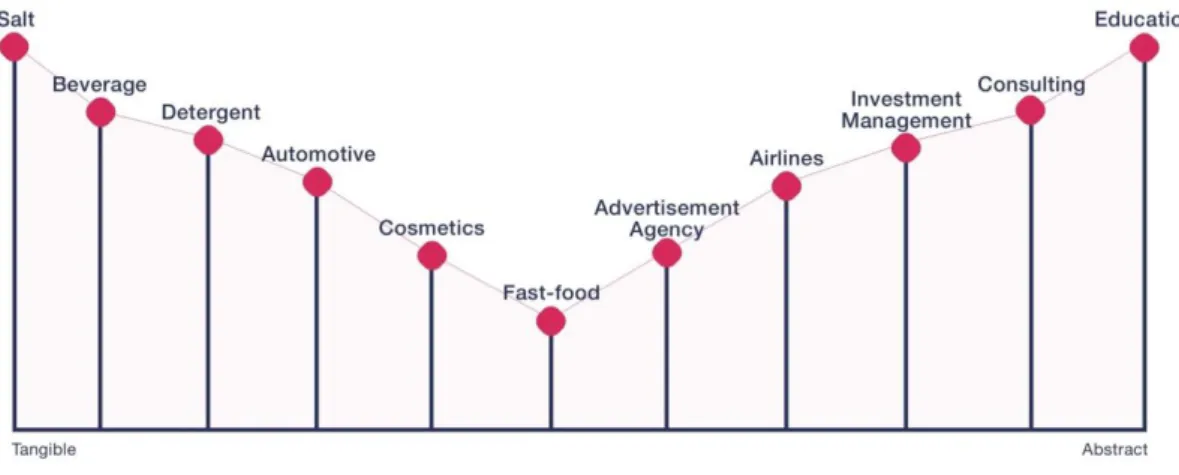
Today, many organizations define their mission as to “serve” the people or their customers in some form. Organizations both in private and public sectors communicate this message to their customer through various channels. Services today encompass many heterogeneous activities across a wide variety of sectors. A service may be an idea, factual information, an innovation, entertainment, even food or security. Since service can be in any form, it is a complex concept and it is difficult to define. Services show differences across a wide range and their relation with tangible goods makes it difficult to define the concept of service. It is feasible to suggest that many businesses provide a combination of goods and services for customers to use (Üneri, 1994). The fact that finished goods differ across a wide range, consisting of pure goods and pure services, gives us the opportunity to categorize as to define the service concept. In reference to this subject, Shostack (1982) suggests the goods and services classification method, ranging from tangible to abstract. The fact that finished goods differ across a wide range, consisting of pure goods and pure services, gives us the opportunity to categorize them and to define the service concept. In reference to this subject, Shostack (1982) suggests the goods and services classification method, ranging from tangible to abstract.
Figure 1. Various Goods Listed in Relation to their Tangible and Abstract Qualities
(Reference: Zeithaml & Bitner, 2000)
In Figure 1, the range of goods and services shows that education has the service property, whereas businesses such as airlines and businesses produce products that are a mixture of goods and services. For instance, airlines companies selling tickets to provide a flight service becomes the main purpose of an activity. On the other hand, customer service representative providing service for a customer, seeking information about airlines services becomes a supporting factor for selling the service. Hence, service may be defined as “determinable abstract efforts that fulfill customer needs as the main goal or part of an event” (Üner, 1994). The most common definition of service is “a benefit or an activity that is provided by a group to another without resulting in an ownership of anything. Service production may or may not be related to a physical product.” (Rust, 1994).
Services are actions, processes and performances (Zeithaml et al., 2000). Services differ from products generally for their property of being abstract. Yet, most products cannot be delivered to customers without services being offered. For instance, customers meet abstract qualities of services during the process of buying a
product. Similarly, most services include tangible components. Whereas football stadiums take place in service industry, seats that are being seated on carry tangible properties. Since products are tangible, customers feel ownership of products as the result of their purchase; whereas they gain an experience as the result of their service purchase. A customer who buys a car leaves the store with the car he bought, whereas a customer, who buys a service, leaves the store with the experience he bought. (Oral Yüksel, 2006).
Considering the above statements, service can be defined as the fact of physically and psychologically providing time, place and location benefits for the individual and the society from the social perspective. As it can be understood from the definition of services, their importance increased over time because of their social and psychological benefits for the country economy. Some of the developments that have led services sector to rise can be specified as; technological change, changes in market demand, globalization, changes in legal regulations, supply chain development, increase in the number of service producers, and the impact of service quality movement. Development of each of these factors also bring along the growth of the services sector. In many of the developed economies, services sector takes up %70 of GDP (The Worldbank, 2017). The service industry dominates the Turkish economy, accounting for about %64 of Turkey s gross domestic product (GDP) according to 2015 estimates (The Worldbank, 2017). The football economy in Turkey is worth about 1 million Euro and Turkish football league is the fourth most expensive league in the world (Fortune Turkiye, 2016).
Five fundamental SERVQUAL dimensions of services are (Zeithaml, 2000): tangibles, reliability, responsiveness, assurance, and empathy. Tangibles relate to the appearance of physical facilities, equipment, personnel, and communication materials. Reliability dimension stands for the ability to perform the promised service dependably and accurately. Responsiveness is the willingness to help customers and provide prompt service. Assurance dimension refers to the knowledge and courtesy of employees and their ability to convey trust and confidence. Lastly, empathy dimension stands for the caring, individualized attention the firm provides its customers (Zeithaml, 2000). In service sector quality implementations, it is
critical to know the difference between service dimensions and how they differ from other sectors. Most service quality surveys are variations of SERVQUAL, which measures four main intangible characteristics of employee service; empathy, reliability, responsiveness, and assurance. Tangible aspects of the service such as the facility or stadium quality may be measured less reliably by using this instrument (Wakefield, 2007).
Service quality research related to intangibles has been seen as unreliable (as identical studies produced different results) due to two reasons. First, SERVQUAL was developed primarily for pure services such as home telephone service and does not fully account for more complex service environments such as sporting events, where multiple service scenarios exist. In this case, a spectator encounters different groups of employees, attending a sporting event: Parking/Security personnel Ticket office Ticket takers Ushers Vendors Concessions (Wakefield, 2005).
For many years, service in sports has been seen as an act restricted to presenting sports events to spectators for their enjoyment. In the recent years, a new product concept emerged as various goods are presented to spectators instead of a service with limited scope. This requires sports events to be examined under a different light. Although the game being played in the field is the most fundamental service that is offered to the spectators, there are many goods and services that accompany the game. Goods such as licensed merchandise along with food and drink services, security service and television broadcasts are just a few examples of products that are offered to spectators in the sports industry. Paralleling the dynamic nature of sports industry, new goods and services are being marketed continually
Goods and services in sports industry can be classified in four categories: sports goods (sport and fitness equipment), sportswear, sports services, and entry fee (Hoga, 1998). A sport is both a consumer product and an industrial product (Argan, 2007). Sports have the characteristics of a consumer product when it is produced as a final product of mass consumption for spectators and participants. Spectators and participants may be catered to by other industries and businesses. Sponsorship
activities, sports broadcast and advertisements may be utilized by organizations aiming to reach their own target consumers. In this regard, sports have the quality of an industrial product. Since no tangible product exists for a team or sporting event, the image of the team or sports venue is the driving force behind market success (Barry, 2000).
2.2.1 Service Quality Dimensions
Service quality is one of the most researched subjects in services, in general, and sporting events in particular. The service provided on the field in the form of the sporting event is the core service provided to fans. The service in the stands is a secondary service provided to fans. However, the secondary service is vital to keeping fans once they come to see the game. Parasuraman et al. (1985) defined perceived service quality as "a global judgment, or attitude relating to the superiority of a service". Similarly, Bitner and Hubbert (1994) suggested that service quality is "the consumer's overall impression of the relative inferiority/superiority of the organization and its services". For instance, Besiktas sold season tickets for 2017/2018 season and offered the option to put name tags on each seat for season ticket holders. The core service provided to fans is the guaranteed seat for each game during next season, yet the added value comes from the personalization the club offers to fans holding a season ticket.
Gr nroos (1984) studies service quality in two parts, functional and technical quality, while evaluating technical quality as the outcome of service production and delivery and functional quality as the performance result of service. In other words, technical quality concept focuses on what the customer receives as the service, whereas functional quality is about how the customer receives the service.
2.2.2 Service Quality Models
Conceptualization of service quality had been a research interest for marketing studies. The American and Nordic models are used for the conceptualization of service quality. The American model is based on Parasuraman et al. s (1988) SERVQUAL model, consisting of five dimensions: reliability, responsiveness, empathy, assurance and tangible. SERVQUAL model focuses on the functional property of service quality. The Nordic model is suggested by Gr nroos (1988) and consists of functional and technical quality. Brady and Cronin (2001) combine the American and Nordic models and propose a dimensional, multi-level factor model, consisting of interaction, physical interaction and outcome quality. Only the relevant service quality models to the context of this research are designated in this section.
GAP model by Parasuraman et al. s (1985) and the analysis of service quality dimensions provides an essential framework for defining and measuring service quality (Yarimoglu, 2011). Gr nroos (1984) developed the first service quality model and measured perceived service quality based on the test of qualitative methods. Technical quality considers what was delivered as the service and the customer evaluations, whereas functional quality is interested in how the service was delivered. More recently, Brady and Cronin (2001) developed another model for measuring service quality sing Likert scale, which highlights interaction quality that was formed by attitude, behavior, and expertise; physical service environment quality that was constituted by ambient conditions, design, and social factors; and outcome quality that was formed by waiting time, tangibles, and valence affect service quality.
Cronin and Taylor (1992) developed SERVPERF, a performance-only model for measuring service quality, specifically used in empirical studies in banking and fast food sectors. A three-dimensional model was proposed by Rust and Oliver (1994), which was built on service product, service delivery, and service environment. The Service Quality Ring is suggested by Rust and Oliver to improve the service quality, arguing for the factors that should be developed by service
organizations to improve the service quality (Berry et al., 1994). These factors are listening, reliability, basic service, service design, recovery, surprising customers, fair play, teamwork, employee research, and servant leadership. Retailers offer a mix of goods and services rather than pure service (Berry, 1986). Since retail stores offer products and services together, measuring service quality in retailers requires different models. Dabholkar et al. (1996) developed the Retail Service Quality Scale (RSQS), which is a multilevel model that has 5 dimensions, 6 sub dimensions, and 28 items. The scale was viewed as a general model to measure service quality of retailers such as department and specialty stores. Finally, Brady et al. (2002) performed a replication of SERVPERF in different sectors such as spectator sports, entertainment, health care, long-distance carriers, and fast food (Yarimoglu, 2011).
2.2.3 Sport Service Quality Models
Service quality has been measured by both the generic SERVQUAL model as well as by modified versions of the scale adapted for the sports industry (Ko et al., 2011). There have also been attempts to measure service quality in the specific context of spectator sports (Kelley and Turley, 2001; McDonald et al., 1995; Theodorakis and Alexandris, 2008; Theodorakis et al., 2001). For instance, the 39-item TEAMQUAL scale is the modified five-dimensional version of SERVQUAL developed by McDonald et al. (1995), measuring the performance of ticket takers, ticket ushers, merchandisers, concessionaires, and customer representatives. In a similar example, Theodorakis et al. (2001) developed SPORTSERV scale to assess the perceptions of service quality among sports spectators. The scale consists of 20 performance-only items representing five dimensions of service quality: (1) tangibles (cleanliness of the facility); (2) responsiveness (willingness of personnel to help); (3) access (accessibility of stadium); (4) security (personal security during games); and (5) reliability (delivery of services as promised) (Ko et al., 2011).
More recently, Theodorakis et al. (2009) averaged the scores of the five SPORTSERV dimensions to examine the relationship between overall service quality and repurchase intentions. Finally, Kelley and Turley (2001) developed a
nine-factor structure for measuring service quality at spectator sports: (1) employees; (2) facility access; (3) concessions; (4) comfort; (5) game experience; (6) show time; (7) convenience; (8) price; and (9) smoking. Ko and Pastore proposed a conceptual model to measure service quality at spectator sports, and developed the Model of Event Quality for Spectator Sport (MEQSS). To test the proposed conceptual MEQSS model, a measurement tool known as the scale of event quality for spectator sports (SEQSS) was developed (Ko et al., 2011).
3. METHODOLOGY 3.1 CONCEPTUAL FRAMEWORK
There are two primary schools of thought are used for the conceptualization of service quality, the American and Nordic models. The foundation of the American model of service quality is Parasuraman et al. s (1988) SERVQUAL model, consisting of five dimensions: reliability, responsiveness, empathy, assurance and tangible. SERVQUAL model focuses on the functional property of service quality. On the contrary, the Nordic model, suggested by Gr nroos (1988), consists of functional and technical quality and it is designed to predict brand image. Brady and Cronin combine the two schools of thought, the American and Nordic models together and develop a multi-dimensional, multi-level factor model of service quality, which contains: interaction, physical interaction and outcome quality. According to Brady and Cronin, aesthetic quality remains unexplored. The conceptual starting point of aesthetic quality is rooted in Pine and Gilmore s idea of memorable experiences:
“An experience occurs when a company intentionally uses services as the stage, and goods as props, to engage individual customers in a way that creates a memorable event.” (Pine & Gilmore, 1998).
Increasing competition and deregulation continuously leads businesses to search for profitable ways to differentiate themselves. From this perspective, offering and delivering high service quality has been pointed as a successful differentiation strategy (Parasuraman, 1988).
The purpose of this thesis are to (1) define the construct of service quality in football stadium settings, (2) propose a model conceptualizing two dimensions of aesthetic and functional quality, (3) show aesthetic and functional qualities effect on organizational identification and convenience and (4) examine the relationships between the proposed constructs.
3.1.1 Aim of the research
The aim of the research is threefold; to identify service quality dimensions at football stadiums, to reveal how these dimensions affect organizational identification and convenience in particular and then to present how organizational identification and convenience affect spectators game attendance for football games in Turkey. An exploratory approach was chosen to explore the service quality at football stadiums. For this study, the biggest Turkish football clubs, known as The Big Three – Beşiktaş, Fenerbahçe and Galatasaray are used for sampling. With the results from the three major teams, this study also aims to generate a model of service quality for football stadiums and to unveil the relationship between spectators service quality perceptions, organizational identification, convenience and game attendance factors. Service quality is entirely examined from the spectator perspective. In this sense, this study will enable football clubs to understand spectators perception of service quality and discover the factors influencing game attendance.
3.1.2 Variables
The variables chosen for this study are aesthetic quality, functional quality, game atmosphere, crowd experience, opponent characteristics, player performance, facility access, seat space, frontline employees, entertainment, organizational identification and convenience.
Aesthetic quality as a concept is rooted in Pine and Gilmore s (1998) notion of memorable experiences. They argue that organizations should design engaging experiences for customers based on ancillary products and aesthetic environments to enable them to charge admission or special fees from their customers such as personal seat license (Pine & Gilmore, 1998). Aesthetic quality comprises memorable goods and promotional activities. Memorabilia is associated with promotional goods, whereas intangible products include half-time shows, in-game activities and interactions between fans and players.
Technical quality is conceptualized as the outcome of service production and delivery by Gr nroos (1988) and Brady and Cronin (2001). The outcome of services is critical and the outcome at sporting events is win or loss. Yet, focusing on the outcome quality only is not enough from a managerial perspective, since the outcome does not guarantee the spectators will commit to returning for future sporting events (Wann & Branscombe, 1990). For instance, there are die-hard fans who stay as a true fan over time despite the fact that their teams fail to win championships for a long period of time. In this study, technical quality has merged under aesthetic quality dimension.
Functional quality relates to service environments and frontline employees. According to Gr nroos (1988), functional quality focuses on the service delivery process and is defined by how the customer evaluates the interactions between the customer, frontline employees, and the service environment. This conceptualization of functional quality is commonly used among marketing researchers. However, functional quality is often criticized for including both functional and aesthetics aspects of a service environment in a single dimension. Yoshida and James argue
that the functional aspect of a service environment (i.e., space, layout, and information signs) should be viewed as functional quality, whereas the aesthetic aspect of the service environment (i.e., design, theme, and festive atmosphere) should be considered aesthetic quality.
Game atmosphere is an essential part of the service provided at sport events, football games in this case, by the organizers. The special atmosphere in stadiums is one of the main reasons why spectators attend events. Research by Uhrich and Benkenstein provides significant evidence for the fact that the atmosphere at a stadium adds value to the core product. They define the sport stadium atmosphere as the relationship between perceptions of the specific environmental features of a sport stadium and the stimulated affective responses of the spectators. In his pioneering research in this field, Kotler (1973) reveals that atmosphere is a quality of the spatial surroundings. Wochnowski also supports the environment-oriented perspective is reflected in definition of atmosphere in the context of sport settings: “Atmosphere . . . is the totality of emotionally appealing environmental stimuli in a defined place” (p. 181). Crowd experience refers to the state of being surrounded by thousands of fans at a game and being able to interact with fans surroundings.
Opponent characteristics reveals the qualities of opposing teams. Player performance is the evaluation of how players perform during the game. Performance of individual players contribute to the game quality and the outcome of the game. In fact, the product being presented at the stadium is the football itself and player performance contributes considerably to what is being delivered as the product at the stadium.
Facility access is the assessment of the stadium layout and the accessibility of the stadium. The dimension of seat space refers to the seat arrangement at the stadium and how convenient the seating area is. Frontline employees variable attempts to capture spectators evaluations of the service being offered by the stadium employees and how they address spectators needs. Entertainment dimension gauges how customers are entertained and satisfied by the games they watch at the stadium.
Organizational identification is about how fans identify themselves in relation to their team. Some of the fans might be coming to stadiums for the sporting event (game experience) itself. However, for those fans who attend the game for reasons apart from the sporting event itself (such as, social reasons, business reasons, family obligations etc.), the service in the stands may be the most important aspect in determining their satisfaction with the event. According to Wakefield (2007), for those highly identified fans who attend for their love of the team and the game, the service provided in the stands will add value by determining:
How long they will spend at the stadium, arriving late or leaving early if dissatisfied,
How much they will spend while at the stadium, given how long they are there, and
How many games they attend throughout the season.
In the context of sports, organizational identification is often referred as team identification. Team identification concerns the extent to which a fan feels a psychological connection to a team (Wann, Melnick, et al., 2001). Level of team identification has been found to predict a variety of fan responses including perceptions of influence on the outcomes of sporting events, consumption of team sponsors products (Madrigal, 2000; Pritchard & Negro, 2001), and attendance (Bristow & Sebastian, 2001; Swanson, Gwinner, Larson, & Janda, 2003). Social identity is the part of an individual s self-concept that derives from his or her knowledge of their membership and groups together the value and emotional significance attached to that membership. Team identification transpires as a manifestation of social identity. With this membership, fans become members of a team because they believe a team s success or failure to be their own success or failure (Kim & Kim, 2009). According to the research by Wann & Branscombe (1993), spectators who strongly identified with a specific sports team, relative to those spectators moderate or low in identification, reported more involvement with the team, displayed a more ego-enhancing pattern of attributions for the team's successes, had more positive expectations concerning future team performances,
exhibited greater willingness to invest larger amounts of time and money to watch the team play, and were more likely to believe that fans of the team they are identified with possess special qualities.
Convenience refers to the ease of using services available at the concourse areas in the stadium, the service provided in the stands. The sportscape (or physical evidence) and people (staff and customers) are proved to be two of the most important dimensions of the services marketing mix, the 7Ps. In spectator sports, sports facilities are commonly believed to have a positive influence on attendance levels (Hill & Green, 2000; Dale et al., 2005). Greenwell et al. (2002) suggest that managers who wish to increase attendance of professional soccer should improve service elements such as facility aesthetics, stadium accessibility, and seating comfort to satisfy the needs of customers with low levels of team identification. Moreover, the qualified staff has been shown to influence spectators of professional soccer in their satisfaction from the service and their repurchase intentions (Theodorakis & Alexandris, 2008). Although a number of researchers have shown that facility factors (Wakefield & Blodgett, 1999; Wakefield & Sloan, 1995; Zhang et al., 1998) and personnel factors (Zhang et al., 1997; Zhang et al., 1998) are significantly related to customer behavior, their importance for football fans has not been investigated and the concepts of sport facilities and staff have not been analyzed adequately.
Kelley and Turley (2001) defined nine quality factors for sports fans when they evaluate their experience in the events: staff, price, access to facilities, concessions, fan comfort, the game experience, game time/show time, convenience and antismoking policy. In sports, it has been argued that the inanimate environment is represented by the facility itself, the staff who interact with customers are considered service staff, and the bundle of service benefits is the core product or game itself (Greenwell et al, 2002). Sport facilities have been shown to be very important for sports fans. King (1999) finds that sports fans have come to expect comfort and convenience from sporting facilities, making it necessary for teams to build and renovate facilities at record speed.
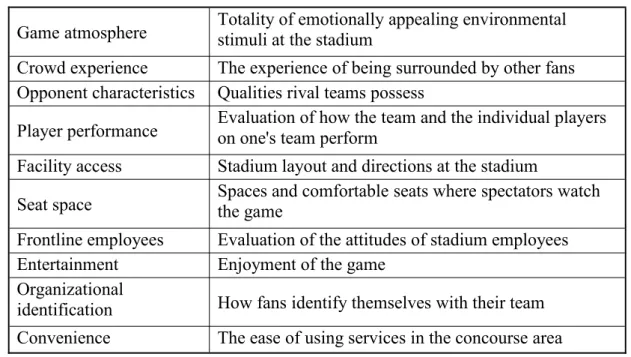
Table 1. Variables
Game atmosphere Totality of emotionally appealing environmentalstimuli at the stadium Crowd experience The experience of being surrounded by other fans Opponent characteristics Qualities rival teams possess
Player performance Evaluation of how the team and the individual playerson one's team perform Facility access Stadium layout and directions at the stadium
Seat space Spaces and comfortable seats where spectators watchthe game Frontline employees Evaluation of the attitudes of stadium employees Entertainment Enjoyment of the game
Organizational
identification How fans identify themselves with their team Convenience The ease of using services in the concourse area
3.1.3 Sample
Data for this study were collected from a sample of 452 respondents who are supporters of Besiktas JK, Fenerbahce SK and Galatasaray SK football clubs. Their ages are varying from 17 to 63. Data was collected in an online questionnaire via Google Forms. The qualitative data were obtained from responses to surveys with 5 point Likert-scale administered by myself. Data collection took place over three weeks and yielded a final usable sample of 432 completed surveys. The age, sex, and income level of respondents were controlled by a quota sampling method.
3.1.4 Choice of research approach
Descriptive and relational survey models were preferred as research methods to test whether game attendance differ depending on aesthetic and functional quality. While the independent variables of the study are aesthetic and functional quality; the dependent variable is the number of games spectators attend.
3.1.5 Research Questions
The main research objects in this study are service quality, organizational identification, convenience and game attendance frequency. Therein, the relationships between these concepts need to be examined. In order to better understand these concepts while examining the relationships among them, fan demographics and perceptions relating to service quality factors should be analyzed. Research questions for this study are listed below. In the light of these questions, the research model and hypothesis are constructed.
Main research questions:
How is service quality defined in the context of football stadiums? Do service quality perceptions differ among fans supporting different
football clubs/teams?
Does demographics affect fans perceptions of service quality? What kind of a relationships exists between service quality at football
stadiums and game attendance?
How does organizational identification affect game attendance? How does atmosphere affect game attendance?
3.1.6 Research Model and Hypothesis
By examining the relationship between service quality at football stadiums and game attendance, this research suggests the model seen in Figure 2.
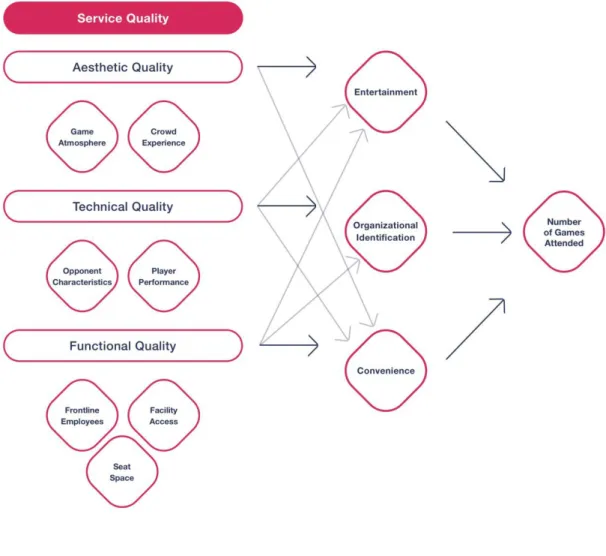
3.1.6.1 Proposed Model of the Research
The proposed model for this research has been taken as an example from Yoshida and James hypothesized service quality model (Figure 2), which combined SERVQUAL and SERVPERF models for measuring service quality, alongside several scales and subscales developed by prominent researchers in the sport marketing field. The construct of aesthetic quality is captured by game atmosphere and crowd experience, whereas functional quality is correlated with frontline employees, seat space and facility access. Two main factors are associated with technical quality: team characteristics and player performance.
The proposed model leads to the following research hypothesis: H1: Aesthetic quality has an impact on entertainment.
H1a: Game atmosphere has an impact on entertainment. H1b: Crowd experience has an impact on entertainment.
H2: Technical quality has an impact on organizational identification.
H2a: Opponent characteristics has an effect on organizational identification. H2b: Player performance has an effect on organizational identification. H3: Functional quality has an impact on convenience.
H3a: Frontline employees has an impact on convenience. H3b: Facility access has an impact on convenience. H3c: Seat space has an impact on convenience.
H4: Aesthetic quality has an impact on organizational identification. H4a: Game atmosphere affects organizational identification.
H4b: Crowd experience affects organizational identification. H5: Technical quality affects entertainment.
H5a: Opponent characteristics has an effect on entertainment. H5b: Player performance has an effect on entertainment. H6: Functional quality influences organizational identification.
H6a: Frontline employees has an impact on organizational identification. H6b: Facility access has an impact on organizational identification. H6c: Seat space has an impact on organizational identification. H7: Technical quality has an impact on convenience.
H7a: Opponent characteristics affect convenience. H7b: Player performance affects convenience.
H8: Aesthetic quality has an impact on convenience. H8a: Game atmosphere influences convenience. H8b: Crowd experience influences convenience. H9: Functional quality influences entertainment.
H9a: Frontline employees have an impact on entertainment. H9b: Facility access affects entertainment.
H9c: Seat space has an impact on entertainment.
H10: Entertainment affects the number of games fans attend.
H11: Organizational identification affects the number of games fans attend. H12: Convenience has an impact on the number of games attended.
3.2 RESEARCH METHOD
In the previous section, past studies in the literature and concepts were discussed and the conceptual framework, research model and hypothesis for this study were presented. In this section, the research approach and how the methodology for this study was developed will be discussed. The qualitative and quantitative methods used for the data analysis will also be examined in this section.
3.2.1 Research Process
Research process includes the stages of this research. First part of the research consists of qualitative research which forms the basis for the quantitative research. Discoveries and conclusions derived from the qualitative research are intended to support the reliability of the scales used for the main part of the study.
3.2.2 Research Design
This research has started with qualitative research method with the purpose of establishing the foundation of the research firmly and with high reliability and validity. In this sense, an in-depth interview was conducted primarily to understand the needs and understandings of football clubs. Additionally, three focus group interviews were conducted and common opinions were obtained. Questionnaire was formed with the determined scales and the translation of the scales was examined by native English and Turkish speakers to ensure the integrity of the questionnaire. As a result, a pilot study was conducted on a sample of 100 people to test the reliability of the questionnaire. Then the questionnaire which constituted the main study was presented to rest of the participants and data were collected. The data collection method, tool, design and sample will also be explained in detail.
3.2.2.1 Qualitative Research
Qualitative research conducted for this study includes in-depth interviews with stadium managers and football fans.
3.2.2.1.1 In-depth Interview
As the service quality is at the core of this research, it is critical to consider the football clubs perspective as well. In order to understand how clubs approach the topic of service quality, what kind of works they do for fans and how they utilize sport marketing in their works, in-depth interviews were conducted with stadium managers of three clubs, Besiktas JK, Fenerbahce SK and Galatasaray SK.
In-depth interviews were conducted in-person with Ahmet Ateş, Stadium Director at Beşiktaş SK; Özgür Gündoğan, Commercial Director at Galatasaray SK; and Ahmet Baki at Fenerbahçe SK. The interview questions are in Appendix 1. Throughout the interviews, service, service quality, stadium atmosphere and game attendance themes were discussed mainly. It was significant that the stadium managers started to realize that there are opportunities to be seized outside of game
itself and acknowledge that the stadium and game experience could be enhanced through better marketing and through interactivity such as through social media. Another important point of discussion was the comparison between old and new stadiums, as Besiktas and Galatasaray have rebuilt their stadiums recently and Fenerbahce has renewed theirs. During the interviews, it was denoted that stadium renewals and constructions resulted in increased service quality. Last but not least, the football culture in Turkey has been pinpointed as the underlying mechanism at play, while discussing all aforementioned themes in detail.
Besiktas Stadium Director, Ateş categorizes service into two parts, as game day and non-game day. Yet, Ateş stated that the service being provided at the Vodafone Arena stadium on game days is limited to food and drink vendors mostly, despite the fact that there are a few areas designated for sponsors, a privately-run restaurant as well as boxes inside the stadium. Outside of game days, the stadium serves houses fashion shows, meeting and other activities, while VIP boxes are used as meeting rooms, coupled with catering service provided by the club vendors. Similarly, Galatasaray s Turk Telekom Arena Stadium housed several concerts such as Madonna. Galatasaray Commercial Director, Özgür Gündoğan took a more holistic approach and defined the service being provided at football stadiums as a “game day experience”, which starts with buying the ticket and includes transportation to and from the stadium, product diversity, food and drink vendors, clean toilet facilities, seats, and finally the game in the field. The notion of total service experience Gündoğan mentioned which they approach in four parts: ticketing, food and drink, stadium and field (game) experiences. While Gündoğan pointed that the game itself is the most significant part of the service, there should be other services for entertainment outside the game. Ko, Zhang, Cattani and Pastore defined this as augmented services dimension, which includes in-game promotion, events, and activities, in addition to game product (Ko et al., 2011).
Collectively, stadium managers acknowledge the fact that activities organized by sponsors could be increased and this area remains unexplored. There is an example case, as Ateş mentioned, of Turkish Football Federation (TFF) organizing sponsorship activities for Ziraat Turkey Cup previously and these activities attracted
more spectators to attend the games. On another note, all stadium managers acknowledge the fact that there are fan groups that exhibit high levels of organizational identification and they evaluate the team s performance and success as their own.
3.2.2.1.2 Focus Groups
After the quality of service examined by the in-depth interviews with stadium managers, 3 focus group interviews took place for the review of the viewpoints of the fans and other issues to be discussed. Football spectators who were asked randomly and volunteered to take part in the study participated in the focus group interview. The numbers of men and women were equal, as 3 female and 3 male participants were recruited for the focus interview. Questions asked during the session in Appendix 2. In addition, at the end of the sessions, all scale questions used in the literature on the evaluation of the service quality perceptions have been evaluated.
The questions participants asked revealed that the quality of service, which is especially important for this study, is partially understood by them as they evaluated service quality as the game itself. When asked to define the service they receive, participants were not able to explain what the service they receive at the stadium is. Yet, it is revealed that receiving information and communicating with the club. Participants expressed different opinions about the reasons for supporting their teams, which revealed the perspectives of fans on organizational identification. Reasons for supporting their team included influence of family and friends, interaction with other fans and need for socialization. The need for belonging is another reason why fans attend games as they emphasize the team culture.
Overall, spectators are likely to attend activities outside of the game and this poses an opportunity for club and stadium managers. Merchandise and giveaways are also important for fans, as anticipated by Pine and Gilmore (1998). Spectators also value diverse range of products (food and drinks). In fact, they stated that they would attend more games if clubs offered merchandise, giveaways and different types of food and drinks. Accessibility of the stadium, transportation to and from the stadium,
access to seats and facilities inside the stadium are imperative for spectators. For female spectators, convenient seats, safety, clean facilities and activities for families are stated as being the most important.
3.2.2.2 Quantitative Research
A series of quantitative studies have been carried out in order to determine the main data collection method and to demonstrate interconnected and correlated relationships between research dimensions and meaningful results.
3.2.2.2.1 Data Collection
The data of the study were collected via a survey form in Likert-Scale. Supporters were given survey forms and asked to fill individually.
3.2.3 Data Analysis
After finishing the data collection by means of online survey, the data obtained was imported and entered into Microsoft Office Excel and prepared for the subsequent analysis for IBM SPSS.
In this study, the quantitative data was analyzed through Statistical Package for the Social Sciences (SPSS) version 21. This program can help the researchers to find descriptive statistics of the data. For instance, in this study, the mean, minimum and maximum levels, and standard deviation of the data were analyzed. During the analysis process of acquired data, Independent Samples T-Test, One Way ANOVA, Pearson Correlation and SEM were applied in terms of deductive statistics. After obtaining data, statistical analysis will be used to evaluate our results.
3.3 FINDINGS
In this section, data analysis has been conducted to analyze the data gathered through the online questionnaire. The results and their interpretation regarding the
research questions have been stated. This section presents and discusses the findings of this research, which aimed to reveal the perceived service quality at football stadiums in Turkey.
3.3.1 Demographic Distribution
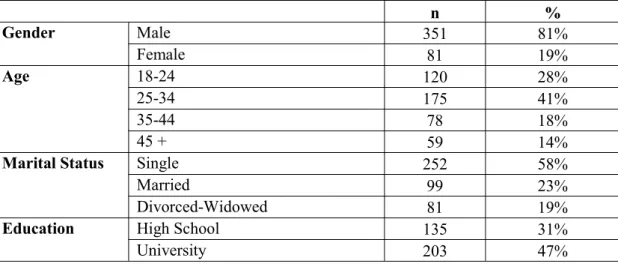
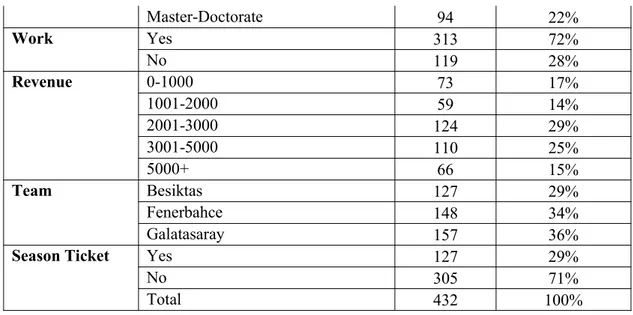
The summary of football spectators demographic information is shown in Table 2. The sample group participating in the study consisted of 81 female spectators (19%) and 351 (81%) male football spectators (n=432). Spectator ages varied between 17 and 63 (M = 31.39, sd = 9.98). For data analysis average age for the sample group was considered. The sample was grouped under 2 age groups, 34 and under and 35 and over. In respect to this grouping 295 football spectators were 34 and under (69%), whilst 137 were 35 and over (32%). Majority of football spectators were single (58%). Considering education level, a majority of the spectators participating in the study were university graduates (47%), followed by high school graduates (%31) and masters level (22%). Number of spectators with a season pass was 127 (29%) and those attended games by purchasing a ticket for each game made up a group of 305 spectators (71%). The frequency of attending events amongst spectators was mainly 5 games or less (71.5%). It was striking to see that the rate of spectators attending 10 games or more was low (12.9%).
Table 2. Frequencies and Percentages of Demographic Information for the Spectators n % Gender Male 351 81% Female 81 19% Age 18-24 120 28% 25-34 175 41% 35-44 78 18% 45 + 59 14%
Marital Status Single 252 58%
Married 99 23%
Divorced-Widowed 81 19%
Education High School 135 31%
Master-Doctorate 94 22% Work Yes 313 72% No 119 28% Revenue 0-1000 73 17% 1001-2000 59 14% 2001-3000 124 29% 3001-5000 110 25% 5000+ 66 15% Team Besiktas 127 29% Fenerbahce 148 34% Galatasaray 157 36%
Season Ticket Yes 127 29%
No 305 71%
Total 432 100%
3.3.1.1 Examination of Findings Related to Service Quality at Sporting Events in Turkey Based on Demographic Variables
3.3.1.1.1 Testing The Statistical Significance of Gender Differences in Perceived Service Quality at Sporting Events
In this part of the study Independent T-Test was performed to compare the evaluation of supporters about service quality at sporting events based on gender. Table 3 reflects the comparison results found out.
Table 3. Independent T-Test Results on Service Quality at Sporting Events (On the Basis of Gender)
Gender Independent
Sample T-Test Male (351) Female (81)
x ss x ss t p
Game atmosphere and Entertainment 3,9 0,7 3,7 0,7 2,697 0,007
Crowd experience 4,1 0,9 3,8 0,7 2,459 0,014 Opponent characteristics 3,2 0,7 3,3 0,7 -0,737 0,462 Player performance 3,6 0,8 3,6 0,7 -0,290 0,772 Frontline employees 3,4 0,9 3,4 0,8 0,419 0,676 Facility access 3,7 0,9 3,6 0,7 1,426 0,155 Seat space 3,6 0,9 3,6 0,8 -0,054 0,957
Organizational identification 3,0 1,0 2,8 0,8 1,570 0,117
Convenience 3,7 0,9 3,6 0,8 1,149 0,251
Number of Games Attended 5,5 5,8 3,4 3,2 3,122 0,002
When considering gender as an independent variable, no statistically significant differences were encountered in:
- Evaluation about opponent characteristics of supporters (p>0,05).
- Player performance evaluation of supporters (p>0,05).
- Spectators views about frontline employees (p>0,05).
- Spectators opinions about facility access (p>0,05).
- Terms of how spectators evaluate seat space (p>0,05).
- Organizational identification of supporters (p>0,05).
- Convenience perception of supporters (p>0,05).
However, statistically significant differences were encountered in:
- Game atmosphere and entertainment experience of supporters (p<0,05). Male supporters are more satisfied with game atmosphere and entertainment than female supporters.
- Crowd experience perception of supporters (p<0,05). Male supporters evaluate crowd experience more positively than female supporters.
- Number of games spectators attended (p<0,05). Single and married supporters attend football games more than divorced and widowed supporters.
3.3.1.1.2 Testing The Statistical Significance of Marital Status Differences in Perceived Service Quality at Sporting Events
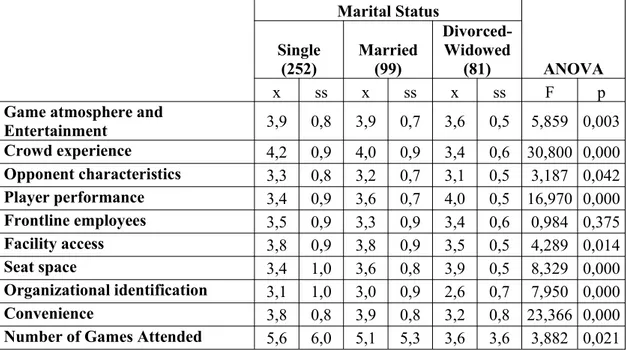
In this part of the study, One-way ANOVA was performed to compare the spectators evaluation of service quality at sporting events based on marital status. Table 4 reflects the comparison results.
Table 4. One-way ANOVA Results on Service Quality at Sporting Events (On The Basis of Marital Status)
Marital Status ANOVA Single (252) Married(99) Divorced-Widowed (81) x ss x ss x ss F p
Game atmosphere and
Entertainment 3,9 0,8 3,9 0,7 3,6 0,5 5,859 0,003 Crowd experience 4,2 0,9 4,0 0,9 3,4 0,6 30,800 0,000 Opponent characteristics 3,3 0,8 3,2 0,7 3,1 0,5 3,187 0,042 Player performance 3,4 0,9 3,6 0,7 4,0 0,5 16,970 0,000 Frontline employees 3,5 0,9 3,3 0,9 3,4 0,6 0,984 0,375 Facility access 3,8 0,9 3,8 0,9 3,5 0,5 4,289 0,014 Seat space 3,4 1,0 3,6 0,8 3,9 0,5 8,329 0,000 Organizational identification 3,1 1,0 3,0 0,9 2,6 0,7 7,950 0,000 Convenience 3,8 0,8 3,9 0,8 3,2 0,8 23,366 0,000
Number of Games Attended 5,6 6,0 5,1 5,3 3,6 3,6 3,882 0,021
When considering marital status as an independent variable, no statistically significant differences were encountered in spectators views about frontline employees (p>0,05).
- Game atmosphere and entertainment experience of supporters (p<0,05). Single and married supporters are more satisfied with game atmosphere and entertainment than divorced and widowed supporters.
- Crowd experience perception of supporters (p<0,05). Single supporters evaluate crowd experience more positively than divorced and widowed supporters.
- Supporters evaluation about opponent characteristics (p<0,05). Divorced and widowed supporters find opponent team performance better than single and married supporters.
- Player performance evaluation of supporters (p<0,05). Single and married supporters find player performance better than divorced and widowed supporters.
- Opinion about facility access of supporters (p<0,05). Divorced and widowed supporters find the stadiums more accessible than single and married supporters.
- Supporters evaluation of seat space in the stadium (p<0,05). Single and married supporters are more satisfied with seat space rendered in the stadiums than divorced and widowed supporters.
- Organizational identification of supporters (p<0,05). Single and married supporters identify with their teams more than divorced and widowed supporters.
- Convenience perception of supporters (p<0,05). Single supporters find the stadiums more convenient than divorced and widowed supporters.
- Number of games spectators attended (p<0,05). University graduated supporters attend football games more than high school and master-doctorate graduated supporters.
3.3.1.1.3 Testing The Statistical Significance of Education Differences in Perceived Service Quality at Sporting Events
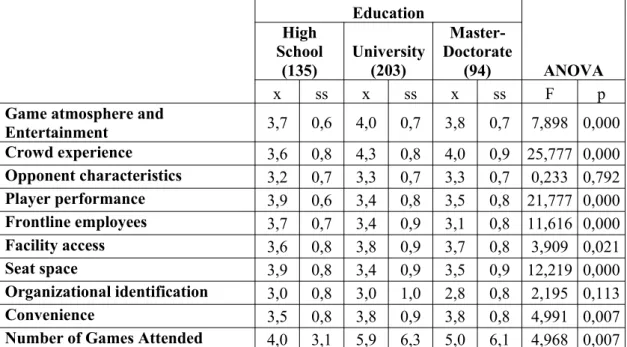
In this part of the study, One-way ANOVA was performed to compare the evaluation of supporters about service quality at sporting events based on education. Table 5 reflects the comparison results found out.
Table 5. One-way ANOVA Results on Service Quality at Sporting Events (On The Basis of Education)
Education ANOVA High School (135) University(203) Master-Doctorate (94) x ss x ss x ss F p
Game atmosphere and
Entertainment 3,7 0,6 4,0 0,7 3,8 0,7 7,898 0,000 Crowd experience 3,6 0,8 4,3 0,8 4,0 0,9 25,777 0,000 Opponent characteristics 3,2 0,7 3,3 0,7 3,3 0,7 0,233 0,792 Player performance 3,9 0,6 3,4 0,8 3,5 0,8 21,777 0,000 Frontline employees 3,7 0,7 3,4 0,9 3,1 0,8 11,616 0,000 Facility access 3,6 0,8 3,8 0,9 3,7 0,8 3,909 0,021 Seat space 3,9 0,8 3,4 0,9 3,5 0,9 12,219 0,000 Organizational identification 3,0 0,8 3,0 1,0 2,8 0,8 2,195 0,113 Convenience 3,5 0,8 3,8 0,9 3,8 0,8 4,991 0,007
Number of Games Attended 4,0 3,1 5,9 6,3 5,0 6,1 4,968 0,007
When considering education as an independent variable, no statistically significant differences were encountered in:
- Organizational identification of supporters (p>0,05).
However, statistically significant differences were encountered in:
- Game atmosphere and entertainment experience of supporters (p<0,05). University and master-doctorate graduated supporters are more satisfied with game atmosphere and entertainment than high school graduated supporters.
- Crowd experience perception of supporters (p<0,05). High school graduated supporters evaluate crowd experience more positively than university and master-doctorate graduated supporters.
- Player performance evaluation of supporters (p<0,05). High school and university graduated supporters find player performance better than master-doctorate graduated supporters.
- In spectators views about frontline employees (p<0,05). University graduated supporters are more satisfied with service rendered by frontline employees than high school graduated supporters.
- Opinion about facility access of supporters (p<0,05). High school graduated supporters find the stadiums more accessible than university and master-doctorate graduated supporters.
- Seat space opinion of supporters (p<0,05). High school graduated supporters are more satisfied with seat space rendered in stadium than university and master-doctorate graduated supporters.
- Convenience perception of supporters (p<0,05). University graduated supporters find the stadiums more convenient than high school graduated supporters.
- Number of games attended by supporters (p<0,05). University graduated supporters attend the games more often than high school graduated supporters.
3.3.1.1.4 Testing The Statistical Significance of Work Differences in Perceived Service Quality at Sporting Events
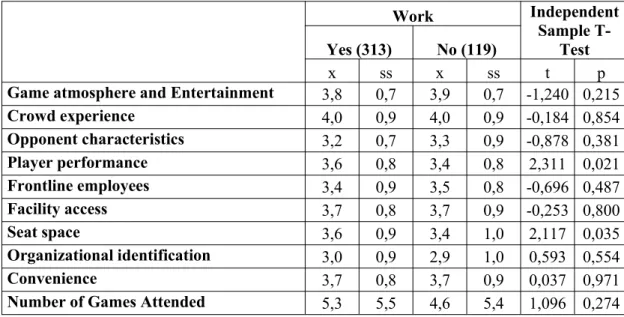
In this part of the study Independent T-Test was performed to compare the evaluation of supporters about service quality at sporting events based on work. Table 6 reflects the comparison results found out.
Table 6. Independent T-Test Results on Service Quality at Sporting Events (On the Basis of Work)
Work Independent
Sample T-Test Yes (313) No (119)
x ss x ss t p
Game atmosphere and Entertainment 3,8 0,7 3,9 0,7 -1,240 0,215
Crowd experience 4,0 0,9 4,0 0,9 -0,184 0,854 Opponent characteristics 3,2 0,7 3,3 0,9 -0,878 0,381 Player performance 3,6 0,8 3,4 0,8 2,311 0,021 Frontline employees 3,4 0,9 3,5 0,8 -0,696 0,487 Facility access 3,7 0,8 3,7 0,9 -0,253 0,800 Seat space 3,6 0,9 3,4 1,0 2,117 0,035 Organizational identification 3,0 0,9 2,9 1,0 0,593 0,554 Convenience 3,7 0,8 3,7 0,9 0,037 0,971
Number of Games Attended 5,3 5,5 4,6 5,4 1,096 0,274
When considering work as an independent variable, no statistically significant differences were encountered in:
- Game atmosphere and entertainment experience of supporters (p>0,05).
- Crowd experience of supporters (p>0,05).
- Spectators views about frontline employees (p>0,05).
- Supporters evaluation of facility access (p>0,05).
- Organizational identification of supporters (p>0,05).
- Convenience perception of supporters (p>0,05).
- Number of games spectators attended (p>0,05).
However, statistically significant differences were encountered in:
- Player performance evaluation of supporters (p<0,05). Supporters who work find player performance better than supporters who do not work.
- Seat space opinion of supporters (p<0,05). Supporters who work are more satisfied with seat space rendered in stadiums than supporters who do not work.
3.3.1.1.5 Testing The Statistical Significance of Revenue Differences in Perceived Service Quality at Sporting Events
In this part of the study One-way ANOVA was performed to compare the evaluation of supporters about service quality at sporting events based on revenue. Table 7 reflects the comparison results found out.
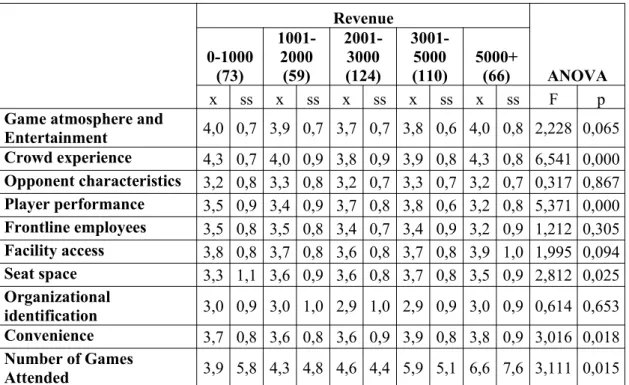
Table 7. One-way ANOVA Results on Service Quality at Sporting Events (On the Basis of Revenue)
Revenue ANOVA 0-1000 (73) 1001-2000 (59) 2001-3000 (124) 3001-5000 (110) 5000+(66) x ss x ss x ss x ss x ss F p
Game atmosphere and
Entertainment 4,0 0,7 3,9 0,7 3,7 0,7 3,8 0,6 4,0 0,8 2,228 0,065 Crowd experience 4,3 0,7 4,0 0,9 3,8 0,9 3,9 0,8 4,3 0,8 6,541 0,000 Opponent characteristics 3,2 0,8 3,3 0,8 3,2 0,7 3,3 0,7 3,2 0,7 0,317 0,867 Player performance 3,5 0,9 3,4 0,9 3,7 0,8 3,8 0,6 3,2 0,8 5,371 0,000 Frontline employees 3,5 0,8 3,5 0,8 3,4 0,7 3,4 0,9 3,2 0,9 1,212 0,305 Facility access 3,8 0,8 3,7 0,8 3,6 0,8 3,7 0,8 3,9 1,0 1,995 0,094 Seat space 3,3 1,1 3,6 0,9 3,6 0,8 3,7 0,8 3,5 0,9 2,812 0,025 Organizational identification 3,0 0,9 3,0 1,0 2,9 1,0 2,9 0,9 3,0 0,9 0,614 0,653 Convenience 3,7 0,8 3,6 0,8 3,6 0,9 3,9 0,8 3,8 0,9 3,016 0,018 Number of Games Attended 3,9 5,8 4,3 4,8 4,6 4,4 5,9 5,1 6,6 7,6 3,111 0,015
When considering revenue as an independent variable, no statistically significant differences were encountered in:
- Game atmosphere and entertainment experience of supporters (p>0,05).
- Supporters evaluation about opponent characteristics (p>0,05).
- Spectators views about frontline employees (p>0,05).
- Supporters opinion about facility access (p>0,05).
However, statistically significant differences were encountered in:
- Crowd experience of supporters (p<0,05). Supporters who have 5000+ TL income evaluate crowd experience more positively than other supporters.
- Player performance evaluation of supporters (p<0,05). Supporters who have 3001-5000 TL income find player performance better than other supporters.
- Seat space opinion of supporters (p<0,05). Supporters who have 3001-5000 TL income are more satisfied with seat space rendered in stadium than other supporters.
- Convenience perception of supporters (p<0,05). Supporters who have 3000+ TL income find stadiums more convenient than other supporters.
- Number of games spectators attended (p<0,05). Supporters who have 3000+ TL income attend games more often than other supporters.