c
T ¨UB˙ITAK
Effects of Ozonation on Characteristics of Aquatic
Fulvic Acid
S
¸ermin G ¨UL
C¸ ukurova University, Faculty of Arts & Sciences, Chemistry Department, 01330 Adana-TURKEY
Received 29.03.2001
Aquatic fulvic acid (FA) treated with ozone was characterized by physical/chemical (dissolved organic carbon-DOC), spectroscopic (UV/VIS, IR, fluorescence), chromatographic (gel permeation chromatography-GPC) methods. The influence of ozonation on the subsequent water treatment process such as floccula-tion and chlorinafloccula-tion was also examined. The DOC concentrafloccula-tion of the 20 min ozonated FA samples was reduced only a small amount (5%) whereas the UV absorption reduced to a higher percent (40%). The IR spectra of ozonated samples showed a moderate attenuation of the double band and aromatic character of FA. Ozonation of the FA caused the fluorescence intensities to increase steadily with ozonation time, whereas it decreased when FA was flocculated after ozonation. Gel chromatographic characterization of FA showed that the high molecular weight (HMW) fractions were eliminated after flocculation fol-lowed by ozonation, while the apparent molecular weight (AMW) distribution of ozonated FA changed slightly. The formation potentials of trihalomethane (THMFP) and adsorbable organically bound halo-gen (AOXFP) were significantly decreased with the increasing ozonation time along with the flocculation process.
Introduction
The yellow to brown colour of many raw water sources can be attributed to the presence of humic material. Humic substances as natural organic matter (NOM) show no toxic properties1. Aquatic humic substances (HS) are thought to have a moderate aromatic character (∼25% of the total carbon) with large numbers of carboxyl groups, some phenolic groups, alcoholic OH groups, methoxyl groups, ketones, and aldehydes2−4. Fulvic acids have been proven to account for 80-90% of the humic material present in surface water5.
Disinfection by chlorine or ozone creates new compounds by chemical reactions between fulvic acids and disinfectant. Today, it is a known fact that humic substances in surface waters will form trihalomethanes (THMs) in the presence of free chlorine6,7.
When ozone is applied as a preoxidant in water treatment, it can react rapidly with NOM present in water8. Ozonation changes the nature of NOM, which in turn affects the removal of DOC during flocculation, adsorption and chlorination8,9. A review of the literature reveals that increasing ozonation is often associated with a reduction of trihalomethane formation potential (THMFP) and adsorbable organically bound halogen formation potential (AOXFP) 11−13. This research was aimed at expanding our knowledge of the impacts
of preozonation on HS. It was expected that the results might have implications for the removal of HS by subsequent processes such as flocculation and chlorination.
Experimental
Samples: The experiments were performed by FA (HO10) isolated from a brown water Lake Hohloh, (HO10),
Black Forest, Germany. The isolation of FA was done according to Abbt-Braun and et. al14.
The studied final concentration of FA samples was 1.4 mg/L DOC. Before use, the sample was prefiltered through a 0.45 µm polycarbonate membrane. The resulting FA was approximately 50% carbon by weight.
Ozonation: The applied ozone concentration (7 mg/L) was generated by Anseros (Type Com/R)
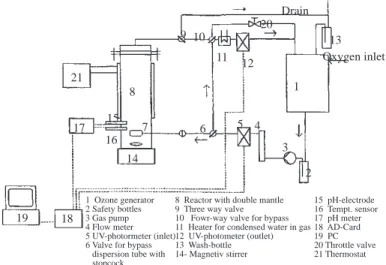
ozone generator, which was fed with oxygen gas. Ozonation was carried out in a 1.000 mL glass cylindrical vessel which has a glass cover containing inlets for feeding the gas, temperature and pH measurements, sampling and venting. A stirrer kept the liquid phase mixed. The data for ozone concentrations, temperature and pH was continuously monitored with a PC connected to the system. Details of the ozonation system are shown in Figure 1. The ozone concentration in the gas flow was measured at the reactor in- and outlet by UV detector at 253.7 nm with two-second intervals. The absorbed amount of ozone was calculated by integration of the difference of the inlet and outlet ozone concentrations over small intervals. The sample contact times were 5 min and 20 min and the concentrations of absorbed ozone these durations were 3.44 mg/L and 10.88 mg/L, respectively. pH values of FA solutions were 4.3 - 4.5. In the experiments, the temperature of the solution and gas flow rate was fixed at 10◦C and 41 L/h, respectively.
1 Ozone generator 2 Safety bottles 3 Gas pump 4 Flow meter 5 UV-photormeter (inlet) 6 Valve for bypass dispersion tube with stopcock
8 Reactor with double mantle 9 Three way valve 10 Fowr-way valve for bypass 11 Heater for condensed water in gas 12 UV-photometer (outlet) 13 Wash-bottle 14- Magnetiv stirrer 15 pH-electrode 16 Tempt. sensor 17 pH meter 18 AD-Card 19 PC 20 Throttle valve 21 Thermostat 21 17 19 18 14 16 15 8 7 6 5 4 3 2 Oxygen inlet 13 Drain 20 12 10 9 1 11
Figure 1. Schematic diagram of the ozonation system
Dissolved Organic Carbon (DOC): DOC measurements were made by the persulfate-ultraviolet
oxidation method (APHA, 1992). The DOC Analyzer (Dohrman Model DC 80) was calibrated with a 10 mg/L (as carbon) potassium hydrogen phthalate (KHP) standard before each run of sample. Measurements were conducted in triplicate. Error of the method was±1% .
Spectroscopic Characterization: UV/Vis specific spectral absorption coefficient (SAC) that is
nm (SAC254) and Vis-Absorption at λ=436 nm (SAC436) by using 1 cm quartz cell at pH 6.8 with a Perkin Elmer-Lamda 5 spectrophotometer.
Fluorescence: The fluorescence of FA was recorded with a fluorescence spectrometer (Perkin Elmer
LS 50 B) using an excitation wavelength of 330 nm. The emission spectra were measured between λ=350 nm and 550 nm at an angle of 90◦versus the position of the excitation beam. The bandwidth of the slits was 5 nm. pH and DOC concentration of FA solution were 6.8 and 5.0 mg/L for the measuring of fluorescence, respectively.
IR-spectra: The IR- spectra were recorded in the range from 4000 to 500 cm−1with a resolution of
8 cm−1 with a FTIR Spectrometer (Bruker Equinox 55) using KBr pellets of freeze dried FA samples.
Gel Chromatography: The nominal mass distribution was determined on a polyacrylate gel
(par-ticle size, 40 µm; pores, 40-80 nm range) TSK-HW-40S column (21 cm length, 1.6 cm diameter) with a simultenous quantification of UV-Detection (λ=254 nm) (Gamma Analysen Technik GmbH, GAT-PHD601) and DOC-Detection (Gr¨antzel, Thinfilm-UV-TOC with IR-Detector Siemens, Ultramat 5E). Samples with 5.0 mg/L of DOC after filtrating with 0.45 µm polycarbonate filter were chromatographed with 0.028 M phosphate buffer as mobile phase with a flow rate of 1.0 mL/min. All the data collected are recorded on a PC. Details of chromatographic system were presented elsewhere15,16.
Chlorination: The solutions of FA (3.0 mg/L) were reacted with hypochlorite solution (as 10 mg
Cl2/ L) at pH=7.0. The reactions were completed by adding of Na2S2O3 after 48 h. The adsorbable organically bound halogens (AOXs) were analysed according to German standard methods17. The effect of ozone on organic halide formation of FA was investigated with respect to chloroform. Quantitative analysis of THM was done on a GC/ECD- System (Chrompack CP 900). Error of the method was±8%.
Flocculation: Flocculation is performed with polyaluminiumchloride (PAC) at a dosage of 3.0 mg
Al/L. The DOC concentration of samples was 4.0 mg/L. The experiments were carried out following the standardized procedure in Engler-Bunte-Institute18. After allowing the flocks to grow for 24 h, the solutions were filtered using 0.45 µm polycarbonate filter. The aluminium remaining in solution was determined by electrothermal AAS.
Results and Discussion
Physical/Chemical and Spectroscopic Characterization of Ozonated FA: After ozonation, decrease
in DOC concentration was small (Table 1). The results showed that ozonation of FA led to a much larger decrease in UV absorbance with compare to the removal of DOC. The decrease of UV/Vis absorbance at 254 nm and at 436 nm with increasing ozone concentration can be attributed to the degradation of the double bonds and oxidation of reactive chromophoric groups such as –C=O and -NO19
2 .
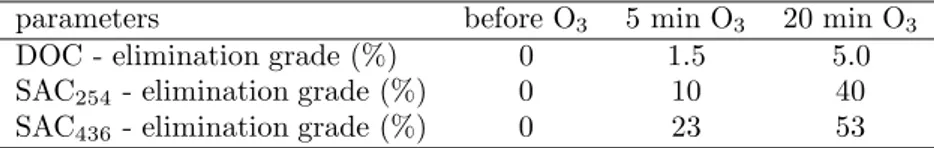
Table 1. Effects of ozonation on DOC and on specific spectral absorbance coefficients at λ= 254 nm (SAC254) and
at λ= 436 nm (SAC436)
parameters before O3 5 min O3 20 min O3
DOC - elimination grade (%) 0 1.5 5.0
SAC254 - elimination grade (%) 0 10 40
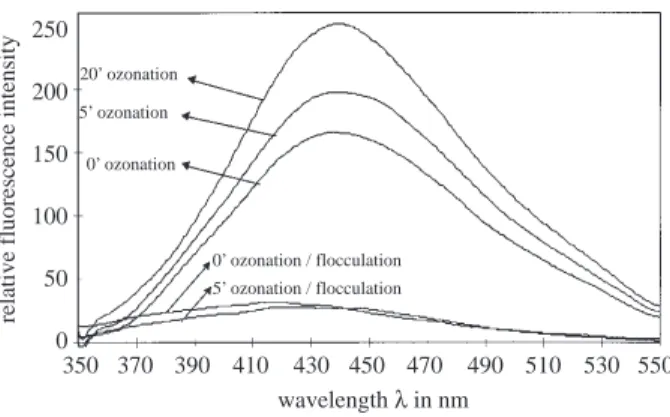
Fluorescence is a typical property of humic and fulvic acids. The fluorescence intensities of unozonated and ozonated (18.94% and 51.52% for 5 and 20 min ozonation times) FAs showed that ozonation caused to increase of the fluorescence intensities in both ozonation times (Figure 2). The increase of fluorescence of ozonated samples can be attributed to the association of the fluorescent structures, which may be produced by the partial oxidation of nonfluorescent chromophores with ozone. The flocculation of FA resulted in significant reductions of fluorescence intensities in both ozonated (86%) and unozonated (84%) samples and positions of emission maximum exhibited a blue shift.
250 200 150 100 50 0
relative fluorescence intensity
350 370 390 410 430 450 470 490 510 530 550 wavelength λ in nm 20’ ozonation 5’ ozonation 0’ ozonation 0’ ozonation / flocculation 5’ ozonation / flocculation
Figure 2. Fluorescence emission spectra of ozonated and ozonated/flocculated FA
The functional groups of FAs were determined by infrared spectroscopy. Absorption bands of FA were compared with the data of aquatic HS collected by Abbt-Braun20. The broad bands around 3400 cm−1 are due to O-H stretching bonds of phenolic structures and alcohols and N-H stretching band of amines and amides (Figure 3). The absorption band at 1709 cm−1 is very likely caused by the C=O stretch vibration of acids, esters, aldehydes and ketones. The second band at 1622 cm−1 is typical for the bog water FA, which is due to C=C stretching vibration of unsaturated (conjugated ketones) and aromatic structures (conjugated phenyl group). The C=O stretching frequency (around 1620) is characteristic in amides or quinonoid structures of FA. The C-O stretching bands of polysaccharide structures appear around 1070 cm−1. The intensities of absorption bands of FA decreased with increasing ozonation time. It can be shown by IR-spectra of ozonated samples that ozonation leds to decrease of the double-bond character and the aromatic character but not strong as mach as C-O stretching bands of polysaccharides.
relative transmission 4000 500 ν in cm-1 1000 1500 2000 2500 3000 3500 0’ 5’ 20’ ozonation 1146 1070 941 779 1622 1383 1709 3395 — — — — — —
Figure 3. IR-spectra of HO10 FA
Chromatographic Characterization of Ozonated FA: The characterization of the DOC after
weights (AMWs) of FA fractions were determined with integrated areas under gel chromatograms and calibrated with polyethyleneoxides (PEOs). In gel chromatograms, the fractions of FA with high molecular weight (HMW) (tR= 23 min to about 38 min) show a relatively sharp peak, whereas the low molecular weight
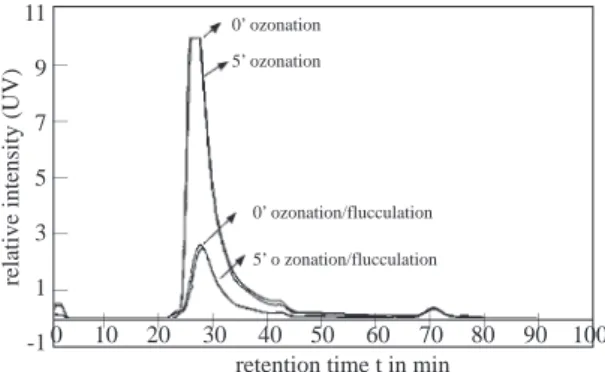
(LMW) fractions were broadly distributed. As the retention time increased, the distribution of DOC shifted from HMW fractions toward intermediate and smaller ones due to elution procedure of gel chromatography (Figure 4)21. A similar chromatogram was seen in the UV-detection (Figure 5). The pronounced sharp peaks having tR= 45 min (Figures 4,5) are LMW organic matters which are UV-inactive. In Table 2, the
results of the ozonated and unozonated FAs obtained by gel chromatograms are summarized. After 20 min of ozonation, a significant part of the high molecular weight substances were broken down into smaller molecules (AMW: 709 g/mol), which were seen at higher retention times in the LC/DOC chromatogram as stated elsewhere16. There is a loss of organic carbon from all molecular size fractions, which can be attributed to organic carbon oxidation to produce either volatile organics or CO2. The LC/UV chromatogram of 20 min ozonated FA has a weaker shoulder than 5 min ozonated FA16. Initial results compared to UV spectral absorbances indicated that about 85.6% SAC254 was diminished after 20 min ozonation (Table 2). The decrease in the UV absorbance at 254 nm can be interpreted as being due to the destruction of the HMW fraction of FA containing double bonds and the chromophores.
relative intensity (DOC)
retention time t in min
5’ ozonation/flucculation 0’ ozonation/flucculation 0’ ozonation 5’ ozonation 9 8 7 6 5 4 3 2 1 0 -1 0 10 20 30 40 50 60 70 80 90 100 — — — — — — — — — — — — — — — — —
Figure 4. LC/DOC chromatogram of ozonated and ozonated/flocculated FA
relative intensity (UV)
retention time t in min
0’ ozonation/flucculation 5’ o zonation/flucculation 0’ ozonation 5’ ozonation 11 9 7 5 3 1 -1 0 10 20 30 40 50 60 70 80 90 100 — — — — — — — — — — — — — —
Figure 5. LC/UV chromatogram of ozonated and ozonated/flocculated FA
Ozone leads to changes in the high molecular weight fraction by breaking down the molecules to smaller pieces and by the introduction of polar carboxylic groups that do not contribute to reaction with aluminium22. The results in Figure 4 reveal that the DOC removal may be reduced by flocculation of ozonated samples, but UV reduction of ozonated samples by flocculation was better than unozonated ones (Figure 5).
Table 2. The results of the gel chromatograms of FA with DOC and UV detections. Parameters 0 min ozonation 5 min ozonation 20 min ozonation HMW fraction tR (min) 28.46 28.86 29.79 DOC (mg/L) 3.45 3.05 1.77 % of cDOC 51 45 41.5 SAC254 (1/m) 58.32 56.63 8.39 % of cSAC 80 81 77 MW (g/mol) 926.8 855.13 709 LMW fraction tR (min) 44.68 44.53 43.88 DOC (mg/L) 0.66 0.69 0.34 % of cDOC 10 10 8 SAC254 (1/m) 2.86 2.90 0.91 % of cSAC 4 4 8.3 MW (g/mol) 35.5 36.6 41.7
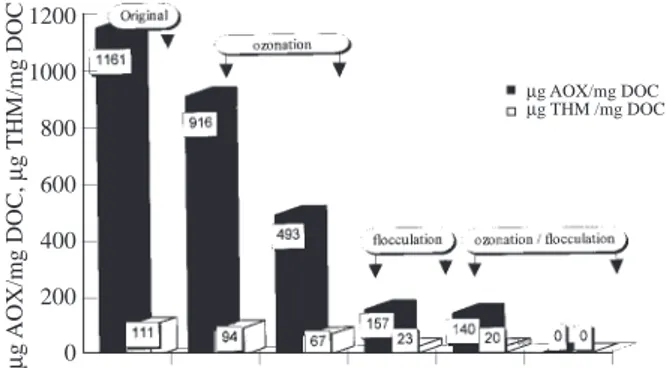
Effect of Preozonation on AOXFM and THMFP: AOXFM and THMFP were significantly
reduced by flocculation following ozonation or flocculation alone with increasing ozonation time (Figure 6). This might be due to the oxidation of hydroxylated aromatic rings with two free meta-positioned OH-groups during ozonation. These kind functional groups are potential active sites for haloform formation8.
— — — — — — — — — — — — 1200 1000 800 600 400 200 0 µ g AOX/mg DOC, µ g THM/mg DOC µg AOX/mg DOC µg THM /mg DOC
Figure 6. Effect of preozonation and flocculation on the formation potential of AOX and THM
Conclusions
The results of this study can be concluded as follows:
After ozonation, the DOC concentration was reduced to a small extent. The UV/VIS absorbance was decreased to a greater extent. These results and IR spectra show that the reactive functional groups like ketones, aldehydes and double bonds are slightly oxidized by ozone.
Ozonation produced moderate changes in the molecular weight distribution of FA. The apparent molecular weight distribution of ozonated FA changed slightly, whereas the high molecular weight fractions were eliminated after flocculation followed ozonation.
Ozonation reduced the concentration of chlorination byproduct precursors in HS. The AOXFP and THMFP were significantly decreased in ozonated samples. This might be due to the oxidation of hydrox-ylated aromatic rings with two free meta positioned –OH groups during ozonation. The remaining DOC of the ozonated samples showed less AOXFP and THMFP when subsequent flocculation was carried out.
Therefore, it can be assumed that the high molecular weight fractions contribute to a high extent to the THM and AOX formation.
Fulvic acids are resistant to ozonation. Some functional groups were oxidized. The complete elimina-tion of FA is not possible by using only ozone.
Acknowledgement
This research was supported by the 32nd International Seminar (IS), German Academic Exchange Service (DAAD) and Deutsche Forschungsgemeinschaft (DFG, ROSIG)
References
1. A. N. Breemen, T. J. Niewstand and G. C. Meent-Olieman, Wat. Res. 13, 771-779 (1979).
2. M. Schnitzer and S. H. Kahn, “Humic Substances in the Environment”, M. Dekker, New York, 1972.
3. F. J. Stevenson, “Humic Chemistry, Genesis, Composition, Reactions”, Wiley-Interscience, New York, 1982.
4. F. H. Frimmel and R. F.Christman, “Humic Substances and Their Role in the Environment” in Dahlem Workshop Reports, John Wiley & Sons, Chichester, 1988.
5. E. M. Thurman, “Organic Geochemistry of Natural Waters”, Martinus Nijhoff/Dr. W. Junk Publishers, Dordrecht, 1985.
6. J. N. Veenstra, J. B. Barber and P. A. Khan, Ozone: Sci. Eng. 5, 225-244 (1983).
7. D. A Reckhow, P. C Singer and R. L Malcolm, Environ. Sci. Technol. 24, 1655-1664 (1990) 8. J. J. Rook, Environ. Sci. Technol. 11, 478-482 (1977).
9. M. M. Edwards, J.E. Benjamin and J. Tobiason, J. AWWA. 86, 105-116 (1994).
10. D. M Owen, G. L. Amy, Z. K. Chowdhury, R. Paode, G. McCoy and K. Viscosil, J. AWWA. 87, 46-63. 1995. 11. R. G. Rice, Ozone: Sci. Eng. 2, 75-99 (1980).
12. B. Legube, J. P Crou´e, J. De Laat and M. Dor´e, Ozone: Sci. Eng. 11, 69-92 (1989). 13. P. Bose, B. K. Bezbarua and D. A. Reckhow, Ozone: Sci. Eng. 16, 89-112 (1994).
14. G. Abbt-Braun, F. H. Frimmel and P. Lipp, Z. Wasser- Abwasser-Forsch. 24, 285- 292 (1991). 15. S. A. Huber, and F. H.Frimmel, Vom Wasser, 86, 277-290 (1996).
16. S. G¨ul, G. Abbt-Braun and F. H. Frimmel, Intern. J. Environ. Anal. Chem. 75(3), 275-284 (1999). 17. DIN 38 409, 1991. Summarische Wirkungs- und Stoffkenngr¨oßen (Gruppe H). Bestimmung der adsorbierbaren
organisch gebundenen Halogene (AOX) (H 14). 18. M. R. Jekel, Ozone: Sci. Eng. 5, 21-35 (1983).
19. L. J. Anderson, J. D. Johnson and R. F. Christman, Environ. Sci. Technol. 20, 739-742 (1986). 20. G. Abbt-Braun, Vom Wasser 77, 291-302 (1991).
21. R. Beckett, Z. Jue and J. G. Giddings, Environ. Sci. Technol. 21, 289-295 (1987). 22. M. Jekel, Vom Wasser. 61, 349-361 (1983).