Corporate Diversification,
Grup Affiliation and Firm Value:
Evidence from Turkey
Elif AKBEN SELÇUK*
Abstract
The objective of this study is to investigate the impact of corporate diversification in a sample of 255 Turkish firms for the period between 2006 and 2012. Regression results indicate that diversified firms trade at a premium compared to single-segment firms. To explain this finding, we also investigate the possible moderating role of business group affiliation for the diversification-value relationship. Analysis results reveal that the diversification premium is confined to firms that are not affiliated with business groups. These results suggest that group members already capture the benefits of diversification without the need to diversify further at the firm level.
Keywords: Corporate Diversification, Business Groups, Turkey JEL Classification: G32, G34
Öz -
Kurumsal Çeşitlendirme, Grup Bağlantıları ve Firma Değeri: Türkiye ÖrneğiBu çalışmanın amacı, 2006 ve 2012 yılları arasında 255 Türk firmasından oluşan bir örneklemde kurumsal çeşitlendirmenin firma değerine etkisini incelemektir. Regr-esyon sonuçlarına göre, çeşitlendirilmiş firmalar uzman firmalara kıyasla çeşitlendirme primiyle faaliyet göstermektedir. Bu bulguyu açıklamak amacıyla işletme gruplarıyla bağlantıların çeşitlendirme-değer ilişkisi üzerinde olası bir etkileşim etkisi araştırılmıştır. Analiz sonuçları, çeşitlendirme primi bulgusunun yalnızca işletme gruplarıyla bağlantılı olmayan firmalarda geçerli olduğunu ortaya koymaktadır. Bu sonuçlar grup şirketlerinin çeşitlendirmenin faydalarını elde ettiklerini ve firma düzeyinde ek bir çeşitlendirmeye ihtiyaç duymadıklarını göstermektedir.
Anahtar Kelimeler: Kurumsal Çeşitlendirme, İşletme Grupları, Türkiye JEL Sınıflandırması: G32, G34
1. Introduction
Diversification plays an important role not only in the personal investment field but also in corporate strategy. In modern portfolio theory, diversification refers to the spreading of risk by combining different asset classes into a single portfolio. This allows the poor returns on some assets to be offset by higher returns on others. As a result, total variance is decreased but returns are unaffected. Unlike the diversification of investment portfolios, with well-documented benefits, the benefits of corporate diversification are not as obvious.
Corporate diversification, in its broadest sense, can be defined as the entry of an existing company into a new business activity involving new products and markets (Brost and Kleiner, 1995). The relationship between corporate diversification and firm value is of interest to business researchers for studying the more general problem of determining firm boundaries. A more pragmatic reason for studying corporate diversification is that corporate managers face decisions about diversifying and refocusing their firms (Marinelli, 2010). Empirical data about how such decisions worked in the past may be useful in planning. Estimates of the costs and benefits of corporate diversification might also be useful to investors and to regulators.
While diversification continues to be a growth strategy for firms, little consensus exists on the relationship between diversification and firm value. Despite the substantial number of studies on the subject, no theoretical or empirical agreement exists among researchers (Dey and Banerjee, 2011; Maksimovic and Phillips, 2007; Martin and Sayrak, 2003; Palich, Cardinal, et al. 2000).
The first objective of the present article is to investigate the impact of corporate diversification on firm value in an emerging market, Turkey. Our second objective is to investigate the moderating role of business group affiliation for the diversification-value relationship for Turkish companies. Most of large companies in Turkey operate under a business group affiliation. These business groups are organized around a holding company. Usually, a single family or a small number of families hold the majority control of the holding company, which itself has shares in several other companies giving rise to a pyramidal structure. There are cases where the companies under the holding company own the shares of each other (Yurtoglu, 2000). We anticipate that the value effect of diversification might be different depending on whether the company is affiliated with a business group.
Although the literature on diversified firms from developed countries is rich, only a few studies have examined diversification-value relationship in the context of
developing countries. To date, most recommendations to developing country firms were based on experience and knowledge gained in the developed world, and these may not be appropriate for emerging country firms (Khanna and Palepu, 1997; Khanna and Rivkin, 2001). The relationship between diversification and firm value may be different in emerging markets due to under-developed product, capital, and labor markets coupled with under-developed laws and regulations (Khanna and Palepu, 1997).
More importantly, only a very limited number of studies examined the impact of firm level diversification or the impact of business group affiliation on the performance of Turkish companies. Moreover, no studies to date have investigated a potential interaction effect between these two variables and the present study attempts to fill this gap in the literature.
The remainder of the article is organized as follows. Section 2 synthesizes the literature on the motives, benefits, and costs of diversification, and reviews empirical evidence. Section 3 presents the data and the methodology. Section 4 contains the valuation results. Section 5 analyzes the moderating role of business group affiliation for diversification-value relationship while Section 6 summarizes the main findings of the study and concludes.
2. Literature Review
This section provides a survey of previous literature about the impact of diversification on firm value focusing on studies that have been most influential for finance research. In the following sections, the theories on costs and benefits of diversification are discussed first, followed by empirical studies about diversification-value relationship. A third subsection is devoted to diversification studies on Turkish firms, which are the main focus of this article.
2.1. Overview of Main Theories
In perfect capital markets, diversification should be irrelevant to firm value. If stockholders wish to reduce unsystematic risk, they can diversify their own portfolio directly (Erdorf, Wendels, et al. 2013). However, many firms operate in more than one industry. In finance literature, several theories on benefits and costs associated with diversification have been developed.
The first benefit of diversification, which gives rise to diversification premium, involves the creation of internal capital markets in which divisions with high cash
but promising investment opportunities. Williamson’s (1975) work, which was further developed by Stein (1997), is at the root of this hypothesis. Having an internal market to fund the firm’s needs for capital is value increasing since internally raised equity capital is less costly than external funds. Second, diversification may benefit firms by a coinsurance effect derived from combining businesses with imperfectly correlated earnings. This effect reduces firms’ unsystematic risk and thus increases value (Bhide, 1990; Lewellen, 1971; Shleifer and Vishny, 1992). Third, diversification creates a tax advantage by allowing the profits of some segments to be offset by the losses of others (Majd and Myers, 1987). In addition, the resource based theory suggests that diversified companies may share resources among divisions and thus benefit from economies of scope (Teece, 1980, 1982). Finally, diversified firms can create and exploit market power advantages by using some anticompetitive tools that are unavailable to focused companies, such as predatory pricing, collusion, or reciprocal buying (Scherer, 1980; Saloner, 1987; Villalonga, 2004a).
On the other hand, there are costs to corporate diversification, which give rise to diversification discount. The first cost of diversification is related to agency theory, which considers diversification as an activity that managers undertake for their own benefit, at the expense of shareholders. Diversification may benefit managers because of the power and prestige associated with managing a larger firm (Jensen, 1986), because managerial compensation is related to firm size (Jensen and Murphy, 1990), or because diversification reduces the risk of managers’ undiversified personal portfolios (Amihud and Lev, 1981). Another cost of diversification is related to overinvestment problem and internal capital markets. If managers have a general tendency to overinvest, then access to an internal market for capital in a diversified firm simply provides a greater opportunity to overinvest in negative NPV projects (Jensen, 1986). Similarly, diversified firms can provide cross subsidies to unprofitable lines of business (Meyer, Milgrom, et al. 1992). Finally, corporate diversification might be value destroying for some firms due to inefficient allocation of capital among different segments, which may result from information asymmetry between central managers and divisional managers (Harris, Kriebel, et al., 1982; Wulf, 2009).
2.2. Empirical Studies
As it becomes clear from the preceding discussion, there are both benefits and costs to diversification, with the net effect being an empirical question. The answer to this question depends on the time period, geographic location, data, and statistical methods used for estimation (Kuppuswamy and Villalonga, 2010).
In finance literature, the seminal papers on firm level diversification are Lang and Stulz (1994) and Berger and Ofek (1995). Preceding work on conglomerates had compared ex-post performance of diversified firms to the performance of single segment firms. By contrast, Lang and Stulz (1994) and Berger and Ofek (1995) decomposed diversified firms into their segments and then valued these segments using benchmark companies. Lang and Stulz (1994) found that diversified firms trade at lower Tobin’s q than comparable single-segment firms over the period 1978 to 1990. To obtain comparable firms, the authors calculated mean and median Tobin’s q of single-segment firms operating in the same three-digit SIC code for every segment of a diversified company. A diversified firm’s comparable q was then found by the weighted average of the divisional qs. Lang and Stulz (1994) regressed the difference between firms’ actual Tobin’s q and comparable Tobin’s q on three measures of diversification: the number of segments that the firm reports and two Herfindahl indices of diversification computed from segment sales and segment assets. In their regressions, the authors consistently found that the coefficient of the diversification variable is negative and significant, meaning that multi-segment firms sell at a discount relative to single-segment firms.
Berger and Ofek (1995) were able to confirm the results of Lang and Stulz (1994) using a slightly different methodology. They found that diversified firms trade on average at a 13 percent to 15 percent discount relative to single-segment firms during the period 1986 to 1991. In their paper, the authors used assets, sales or earnings multiples instead of Tobin’s q. The natural logarithm of the ratio of the actual value of a firm to its imputed value was called “excess value” and was used to analyze whether diversified firms trade at a discount or premium. The imputed value was obtained by multiplying the reported accounting value (assets, sales, or EBIT) for each segment by the median ratio for single-segment firms in the same industry. Later on, Servaes (1996) studied data for US firms covering the period from 1961 to 1976 and documented a large diversification discount during the 1960s, but this discount declined to zero during the 1970s. Insider ownership was found to be negatively related to diversification during the 1960s, but when the diversification discount declined in 1970s, firms with high insider ownership were the first to diversify. Denis, Denis, et al. (1997) and Anderson, Bates, et al. (2000) were also able to confirm evidence of a value loss from diversification for US firms.
A second group of cross-sectional studies questioned the previous evidence that diversification destroys value. The findings of these studies suggest that
diversification, in itself, does not destroy value. But, they argue that factors different from diversification are responsible for the documented diversification discount. Once these factors are controlled for, the diversification discount may decrease or disappear.
Within this strand of literature, Campa and Kedia (2002) argued that, several studies fail to control for firm effects that lead to diversification and therefore report a diversification discount when it is actually caused by other underlying characteristics. They found that diversified firms differ from single segment firms and noted that the diversification discount either decreases or disappears entirely when these exogenous characteristics affecting the decision to diversify are controlled by using instrumental variables.
Similarly, Villalonga (2004a) argued that conglomerates are different prior to beginning their diversification program, and thus research documenting a diversification discount suffers from sample selection bias. Her study caused the diversification discount to disappear when econometric methods of casual inference are used. The author used three different techniques including fixed-effects estimator, simultaneous-equation estimation with instrumental variables, and Heckman’s two-stage method to control for the endogeneity of the diversification decision. All three methods indicated that diversification is not causally related to the discount.
In another study, Mansi and Reeb (2002) found that measures of firm value based on book values of debt instead of market values systematically undervalue diversified firms relative to single-segment firms. Their data included 2,856 firms from 1988 to 1999. Using a contingent claim framework and controlling for risk effects, the authors found that diversification is not associated with reductions in overall firm value. Their results imply that diversification does not destroy value, but rather results in a wealth transfer from shareholders to bondholders. The authors’ hypothesis was supported by the following three results: equity holder losses in diversification are related to firm leverage, all-equity firms do not exhibit a diversification discount, and using book value of debt in the calculation of excess value creates bias.
In a more recent study, Hoechle, Schmid, et al. (2012) also found that diversification discount decreases or even disappears using a dynamic panel generalized method of moments (GMM) estimator to control for endogeneity and controlling for corporate governance.
The studies in the second group do not contest the finding that diversified firms sell at a discount. Instead, they argue that the discount is not due to diversification itself but is a result of a given firm selling at a discount prior to diversifying. There is also a third group of studies which question the existence of the diversification discount phenomenon itself. These studies argue that there is no diversification discount and in fact diversified firms may even trade at a significant premium. Differences in these and previous results are attributed to the use of different measures, time periods, or databases.
For instance, Miller (2006) created a measure of technological diversity based on citation-weighted patents. Since this measure is defined for both single-segment and diversified firms, and is not correlated with more fundamental aspects of diversification, endogeneity was not a problem. Analysis results showed a positive relationship between diversification based on technological diversity and market-based measures of performance. The results hold when other factors including R&D intensity and capital intensity are controlled for or when controlling for unobserved factors using panel data.
In another study, Whited (2001) caused the discount to disappear by employing a measurement-error consistent estimator of Tobin’s q. Generalized Method of Moments (GMM) estimation results showed that diversified firms are not significantly different from single segment firms. The author concluded that the results in the previous literature appear to be artefacts of measurement error.
Villalonga (2004b) hypothesized that the diversification discount could be due to the inappropriateness of the segment data from Compustat that is used to measure it in most previous studies. She used Business Information Tracking Series (BITS) data for the US economy from 1989 to 1996, which allows for construction of business units that are more comparable across firms. This data indicated a diversification premium which is robust to variations in measures of excess value and diversification. Finally, He (2009) argued the diversification discount documented in earlier studies can be an artefact of the pre-1997 data or a failure to control for endogeneity. In 1997, the Financial Accounting Standards Board established a new segment-reporting standard (SFAS 131) for US public companies and the author documented a significant diversification premium when only post-1997 data were used. In contrast, he found that the pre-1997 data typically generates a diversification discount, but the effect is statistically less significant when endogeneity is controlled for.
All aforementioned studies have been performed for the US companies. Non-US studies too show that discount exists in some countries whereas others have a premium. In their study, Fleming, Oliver, et al. (2003) found that Australian firms traded at a discount between 1988 and 1998, but the discount vanished when low performing firms were excluded from the sample. In another study, Lins and Servaes (1999) found that a discount existed in Japan and United Kingdom, whereas no discount was found in Germany. The authors also showed that the discount in Japan is confined to firms that are part of industrial groups. In a comparative study, Fauver, Houston, et al. (2003) have used databases from 35 developed and developing countries, and found that the value of corporate diversification is negatively related to the level of capital market development. Among high-income countries, where capital markets are well developed, the authors documented a significant diversification discount. By contrast, for the lower income countries, they found that there is either no diversification discount or a diversification premium.
Among studies focusing on firm level diversification in emerging markets, Li and Wong (2003) were able to document a diversification premium in China and Nachum (2004) found a premium in 22 emerging markets. In a more recent study, Lee, Hooy, et al. (2012) found that diversification increases value for Malaysian firms. On the contrary, Lins and Servaes (2002) analyzed the costs and benefits of corporate diversification in seven emerging markets, and found that diversified firms are valued lower than focused firms for the year 1995. They also found that the diversification discount is only valid for firms that belong to industrial groups.
Among studies on group affiliation, Singh, Nejadmalayeri, et al. (2007) found that group affiliated firms in India perform significantly worse than focused firms and that there exists a significant negative relation between the degree of diversification and firm performance for the years 1998-2000. However, the rest of the business group studies in emerging and transition countries actually offer a different picture. Based on data between the 1970s and the early 1990s, studies in China (Yiu, Bruton, et al., 2005), India (Khanna and Palepu, 2000a; Ramaswamy, Li, et al., 2004), South Korea (Lee, Peng, et al., 2008), and Chile (Khanna and Palepu, 2000b) report that most of group affiliated firms enjoy higher value than focused firms. Khanna and Rivkin (2001) also found a positive relationship between group affiliation and value in a sample of 14 emerging markets.
2.3. Studies on Turkish Firms
firm level and group level. At the firm level, Yucel, Ozmen, et al. (2012) found that diversified Turkish firms traded at a premium compared to single-segment firms for the period between 2005 and 2010. The authors employed the excess value methodology for a sample of 32 diversified and 119 single-segment companies and their results were robust to different measures of diversification such as the entropy index or Herfindahl index.
In the previous literature, we could locate the following studies investigating the impact of group affiliation on the performance of Turkish companies: Gunduz and Tatoglu (2003) analyzed the stock performance and accounting performance of 202 non-financial firms listed on Istanbul Stock Exchange as of 1999. Using t-tests on several variables, they concluded that firms affiliated with business groups do not differ from unaffiliated firms in terms of corporate performance. In a more recent study, Gonenc, Kan, et al. (2007) analyzed the performance of 200 non-financial firms listed on Istanbul Stock Exchange during the 2001 crisis. They used two measures of accounting performance, namely operating return on assets (OPRA) and return on assets (ROA), and one measure of stock market performance, namely Tobin’s q. Using multivariate analysis including several control variables, they found that group affiliated firms, defined as those firms owned by a holding company, have better accounting performance compared to unaffiliated firms. Group affiliation did not have a significant effect on stock market performance.
3. Methodology 3.1. Sample Selection
To select firms to be included in the study, we started with the entire universe of Turkish firms as of the end of the year 2012. Since we need market values for the companies in our study, we excluded private companies from the analysis and limited our sample to firms listed on Borsa Istanbul. We then excluded firms whose primary business is financial services to ensure comparability, resulting in a final sample of 255 firms. We classified a firm as diversified when it reports sales in two or more industries. We classified a firm as a group affiliate if the ultimate owner is a holding company. Our period of analysis covers the years between 2006 and 2012, corresponding to seven years of data. The main reason of excluding the years prior to 2006 is to ensure comparability and consistency in our dataset since public Turkish companies switched to IFRS financial statements in 2005.
3.2. Variables
As explained in the literature review section, most studies that focus on developed countries with a large number of companies use the Berger and Ofek’s (1995) excess value as their dependent variable. However, this method might be inappropriate for an emerging market like Turkey where few matching firms are available. Hence, following Lins and Servaes (2002), we chose to use Tobin’s q (which is calculated as the sum of the market value of equity and book value of debt divided by book value assets) as the dependent variable in our analysis. To avoid problems with outliers, we removed observations with q ratios in the top 1% or bottom 1% of the sample.
To measure diversification, following Berger and Ofek (1995), a dummy variable (D) is employed, which takes the value of “1” if the firm reports sales in more than one business segment and “0” otherwise. On the other hand, the dummy variable GR takes the value of 1 for group affiliates which are defined as those firms whose largest owner is a holding company.
A number of other factors related to value are also included in our model as control variables. The majority of the previous papers on diversification controlled for firm size, profitability and growth opportunities (Berger and Ofek, 1995; Lang and Stulz, 1994; Lins and Servaes, 1999, 2002; Servaes, 1996, among others). Consequently, we included firm size measured by the natural logarithm of total assets (SIZE), profitability measured by the ratio of operating income to sales (EBITSA), and growth opportunities measured by the ratio of capital expenditures to sales (CAPEXSA), as control variables in our regression equations.
We also included the ratio of total debt to total assets to capture the degree of financial slack available to the firm (Campa and Kedia, 1999). Finally, we controlled for international sales because Errunza and Senbet (1984) and Morck and Yeung (1991) found evidence of a positive relation between internationalization and firm value while Denis, Denis, and Yost (2002) found evidence that international diversification leads to a decrease in firm value. The internationalization is measured by the ratio of the firm’s international sales to its total sales (INT). We also included industry dummies in our models since market values or total assets might differ according to sectors in which companies are operating.
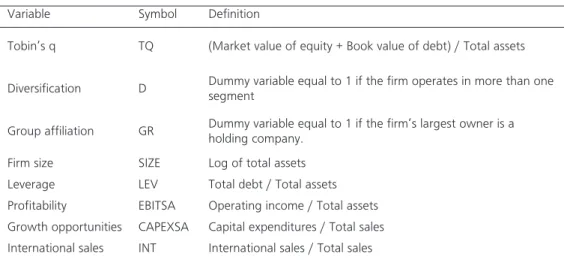
Table 1. Variable Definitions
Variable Symbol Definition
Tobin’s q TQ (Market value of equity + Book value of debt) / Total assets Diversification D Dummy variable equal to 1 if the firm operates in more than one
segment
Group affiliation GR Dummy variable equal to 1 if the firm’s largest owner is a holding company. Firm size SIZE Log of total assets
Leverage LEV Total debt / Total assets Profitability EBITSA Operating income / Total assets Growth opportunities CAPEXSA Capital expenditures / Total sales International sales INT International sales / Total sales 3.3. Descriptive Statistics
Table 2 below provides the descriptive statistics on our variables. There are 1795 firm-years in total. 750 of the firm-years belong to diversified firms while 1045 belong to single segment firms. The data constitute an unbalanced panel since some observations are missing.
As can be seen on Table 2, 42 percent of the companies in our sample are diversified and 37 percent are group affiliates. The average Tobin’s q is 0.93. Firm size, determined as the natural logarithm of total assets, has a mean of 19. Leverage, given as the ratio of total debt to total assets, registers a mean value of 0.53. The mean profitability measured by the ratio of operating income to sales is 0.04. Growth opportunities are measured as the ratio of capital expenditures to sales and show a mean of 0.07. Finally, 16 percent of the companies in our sample are internationally diversified, i.e. derive portion of their sales from abroad.
Table 2. Descriptive Statistics
Variable Obs Mean Std. Dev. Min Max
TQ 1477 0.93 1.11 0.03 14.22 D 1785 0.42 0.49 0.00 1.00 GR 1785 0.37 0.48 0.00 1.00 SIZE 1663 19.00 1.68 13.85 23.66 LEV 1663 0.53 0.48 0.01 8.67 EBITSA 1528 0.04 0.48 -7.80 9.49 CAPEXSA 1759 0.07 0.13 -0.01 1.11 INT 1711 0.16 0.22 0.00 1.00 Assets (TL) 1663 805,000,000 2,170,000,000 1,036,737 18,800,000,000
3.4. Estimation
Using the variables presented in the previous section, the following regression equation will be estimated.
TQit = b0 + b1Dit + b2Xit + ܭit Eq. (1) where:
TQit is the Tobin’s q of the firm i in year t,
Dit is a dummy variable equal to 1 if firm i is diversified in year t, 0 otherwise, Xit is the set of exogenous observable characteristics of the firm i included as control variables,
b0,b1, b2 are parameters to be estimated, ܭit is the error term.
Due to the structure of our dataset, panel data estimation will be employed. The Hausman (1978) test points to a violation of the assumptions of the random effects model hence a fixed affects model will be used. The fixed effects model has also the advantage of controlling for the endogeneity of the diversification variable (Campa and Kedia, 2002; Villalonga, 2004a).
4. Valuation Results
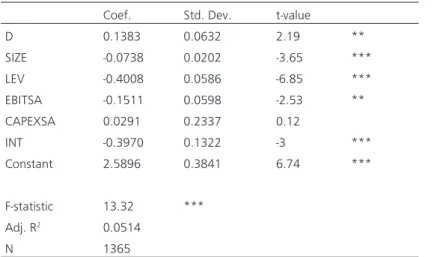
Table 3 contains the estimation results for Eq. (1). First, the F-statistic suggests that the overall model is significant (p<.01). The adjusted R-squared value is in line with values obtained in prior diversification studies (e.g. Campa and Kedia, 2002; Khanna and Palepu, 2000; Lang and Stulz, 1994; Lins and Servaes, 1999, 2002). The variable D which is used to measure diversification has a positive and statistically significant coefficient meaning that there is a diversification premium in our sample. Tobin’s q value for diversified firms is approximately 0.14 points higher compared to that of single-segment firms. In addition, the coefficients on most control variables are significant. Size, leverage, profitability, and internationalization are negatively and significantly related to firm value while growth opportunities do not have a significant impact. Overall, our regression results suggest that, in Turkey, corporate diversification increases company value for the period between 2006 and 2012. Diversified companies in our sample are valued more compared to single segment firms, providing support for weak-form diversification premium (Villalonga, 2003).
To assess the validity of our model’s assumptions, several diagnostic tests were performed after the estimation. Normality was checked by a visual inspection of Q-Q plot and histogram of the residuals. Linearity was also visually checked by a plot of residuals vs. predicted values and no significant problems were detected. Breusch-Pagan/Cook-Weisberg test (chi2=8.98, p>0.1) showed that homoscedasticity
assumption is satisfied. Finally, Durbin-Watson test statistic (1.93) showed no evidence of autocorrelation.
Table 3. Valuation Results
Coef. Std. Dev. t-value
D 0.1383 0.0632 2.19 ** SIZE -0.0738 0.0202 -3.65 *** LEV -0.4008 0.0586 -6.85 *** EBITSA -0.1511 0.0598 -2.53 ** CAPEXSA 0.0291 0.2337 0.12 INT -0.3970 0.1322 -3 *** Constant 2.5896 0.3841 6.74 *** F-statistic 13.32 *** Adj. R2 0.0514 N 1365
*** and ** denote significance at 1% and 5% respectively.
5. The Role of Business Group Affiliation
The previous section has focused on diversification at the firm level and documented a diversification premium. One of the most emphasized benefits of diversification is the creation of internal capital markets within the diversified firm. In that sense, industrial groups or business groups consisting of companies with strong cross-shareholdings, are somewhat similar to diversified firms since member companies may support each other economically in potentially profitable projects. Of course, groups cannot be expected to create internal capital markets in which funds flow as freely from firms with poor investment opportunities to firms with better investment opportunities. Still, previous studies found that sensitivity of investment to cash flow is smaller for group member firms (Lins and Servaes, 1999).
In light of the above mentioned evidence, it is possible that diversification only benefits firms that do not belong to industrial groups. For firms that have a group
some of the benefits of internal capital markets may already be captured by the group structure (Lins and Servaes, 1999).
Turkey constitutes an ideal experimental setting to test that hypothesis, since the majority of the large scale firms in Turkey are operating under a business group affiliation. These business groups are organized around a holding company. Despite their importance for the Turkish economy, the activities of business groups are not well documented. As explained in the literature review section, some studies such as Gonenc, Kan, et al. (2007) or Gunduz and Tatoglu (2003) compared group members and non-group members in terms of performance, but in general empirical evidence is scarce. This is largely due to the fact that official data are collected at the company level instead of the group level (Yurtoglu, 2000).
The objective of the present section is to investigate the role of group membership on firm value from a different perspective: We aim at analyzing the moderating role of group membership for the diversification-value relationship in Turkish companies. We anticipate that the value effect of diversification might be different depending on whether the company is affiliated with a business group. To this end, we estimate the following regression.
TQit = b0 + b1Dit + b2Xit + b3GRit + b4Dit *GRit + ܭit Eq. (2) where:
TQit is the Tobin’s q of the firm i in year t,
Dit is a dummy variable equal to 1 if firm i is diversified in year t, 0 otherwise, GRit is a dummy variable equal to 1 if firm i is affiliated with a business group Xit is the set of exogenous observable characteristics of the firm i included as control variables,
b0,b1, b2, b3,b4 are parameters to be estimated, ܭit is the error term.
Eq. (2) cannot be estimated using fixed-effects due to the singularity of the data (Fauver, Houston, et al., 2003). This singularity results from the inclusion of a dummy variable for business group membership (GR) that persists over time. In addition, the Hausman (1978) test indicates a violation of the assumptions of the random effects model so pooled OLS method will be employed. The estimation
results are presented on Table 4.
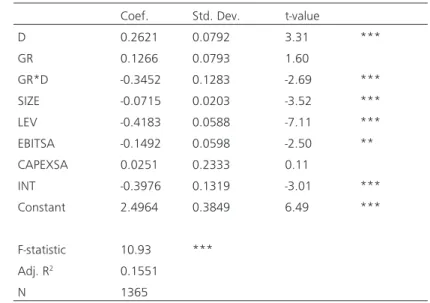
First, the F-statistic suggests that the overall model is significant (p<.01). The adjusted R-squared value is in line with values obtained in prior diversification studies (e.g. Campa and Kedia, 2002; Khanna and Palepu, 2000; Lang and Stulz, 1994; Lins and Servaes, 1999, 2002). Moreover, Table 4 shows that the coefficient on the diversification dummy is positive and significant. In this specification, the coefficient of the diversification dummy represents the impact of diversification on value for non-group affiliates only. Among the non-group members, diversified firms’ average Tobin’s q is 0.26 points higher compared to single-segment firms.
The coefficient of the interaction between the group member dummy and the diversification dummy is negative and statistically significant. This finding indicates that, business group affiliation decreases the benefits of firm level diversification.
If we recode the group membership variable so that it is equal to 0 for firms that belong to business groups, and 1 for firms that are not members of business groups, then the coefficient on the diversification variable is equal to -0.0831 and is not significantly different from zero. This result means that for firms that belong to business groups, diversification does not have an impact on company value.
When the coefficient estimates for control variables are analyzed, the variables SIZE, EBITSA, LEV, and INT are found to have negative and statistically significant coefficients. On the other hand, the coefficient estimate for the variables CAPEX is not significantly different from zero, meaning that capital expenditures do not have an effect on company value.
This evidence supports the argument that group members can capture the benefits of corporate diversification without having to diversify at the firm level. For firms that are group members, the costs and benefits of diversification cancel each other out. But for firms that are not group members, firm level diversification has a positive impact on company value.
To assess the validity of our model’s assumptions, several diagnostic tests were performed after the estimation. Normality was checked by a visual inspection of Q-Q plot and histogram of the residuals. Linearity was also visually checked by a plot of residuals vs. predicted values and no significant problems were detected. Breusch-Pagan/Cook-Weisberg test (chi2=7.62, p>0.1) showed that homoscedasticity
Table 4. Moderating Role of Group Affiliation
Coef. Std. Dev. t-value
D 0.2621 0.0792 3.31 *** GR 0.1266 0.0793 1.60 GR*D -0.3452 0.1283 -2.69 *** SIZE -0.0715 0.0203 -3.52 *** LEV -0.4183 0.0588 -7.11 *** EBITSA -0.1492 0.0598 -2.50 ** CAPEXSA 0.0251 0.2333 0.11 INT -0.3976 0.1319 -3.01 *** Constant 2.4964 0.3849 6.49 *** F-statistic 10.93 *** Adj. R2 0.1551 N 1365
*** and ** denote significance at 1% and 5% respectively.
6. Conclusion
The objective of this article was to empirically investigate the impact of corporate diversification on firm value in Turkey. Overall, analysis results suggest that, for the period from 2006 to 2012, diversified Turkish firms in our sample are valued more compared to single-segment firms, providing support for weak form diversification premium. Moreover we found that the diversification premium is confined to firms that are not affiliated with business groups.
Our results provide support for the institution-based view of diversification (Khanna and Palepu, 1997; Peng and Delios, 2006; Lee, Peng, et al., 2008). According to this view, different institutional environments significantly affect companies’ optimal diversification strategy. In institutionally weak environments that are present in most emerging markets, the costs associated with diversification may overweight the benefits, because diversified firms can imitate the beneficial functions of various market institutions that are present in developed countries but not in emerging economies.
Specifically, Khanna and Palepu (1997) explain that most emerging markets are characterized by imperfections in product, labor and financial markets. Companies in emerging markets can overcome these “institutional voids” by diversifying at the firm level or through membership in industrial groups (Lins and Servaes, 2002). For
instance, established brands are an important source of power for companies in emerging markets due to difficulty in disseminating information and inexistence of mechanisms to corroborate the claims of the sellers. As a result, a conglomerate with a good reputation can use its name to succeed in other unrelated businesses. There are also problems in labor markets since most emerging economies suffer from scarcity of well-trained people. Diversified companies can create value by spreading the cost of professional development over the segments and creating their own internal labor market. Finally, since equity markets in are small and illiquid, the internal capital market created by divisions of conglomerate firms becomes advantageous.
In addition to imitating the institutions that are lacking in emerging markets, diversification may provide other important benefits. If the economic and legal environments make it more difficult to contract with other firms, it may be more beneficial to merge different segments within the same company than it is to have them operate on a stand-alone basis. Diversified firms or groups in these countries may also be better able to attract quality employees and better able to lobby or influence the political and regulatory process (Fauver, Houston, et al., 2003).
Our results have important implications. For managers, optimal strategic actions in given country and time period may not be appropriate in other countries or different time periods in the same country. According to the empirical results of this study, focus strategy often advised by consultants from developed countries does not seem appropriate for developing country firms. Thus, managers from emerging or less developed countries should not mistakenly narrow the scope of their operations upon advice from developed country consultants (Khanna and Palepu, 1997; Khanna and Rivkin, 2001).
From a public policy perspective, promoting diversification or the formation of business groups in emerging markets would help companies to overcome the shortage of key resources such as capital or labor. However, as market institutions evolve and competition increases, diversified companies or business groups may turn into “core rigidities” (Kim, Hoskisson, et al., 2004). As institutional and competitive contexts change and improve, so should the strategy of companies. A corollary of this observation for policy-makers is that, the existence of highly diversified firms in a given country could be considered as a signal that the country lacks market-supporting institutions (Chen and Chu, 2012). Therefore, policy-makers should adopt the necessary reforms to increase the transparency and competitiveness of markets.
The present study suffers from the following limitations: First, it does not distinguish between related and unrelated diversification. Several studies in the previous literature found that while unrelated diversification has an effect on firm value, related diversification does not. This hypothesis could not be tested in this study due to inability of finding suitable benchmark companies. Moreover, the excess value measure used as the dependent variable in many empirical studies could not be employed because of our limited sample size. In addition to addressing these limitations, future research can also investigate the role of agency costs and corporate governance in emerging markets for the relationship between diversification and firm value.
References
1. Amihud, Y., and Lev, B. (1981). Risk reduction as a managerial motive for conglomerate mergers. The Bell Journal of Economics, 12(2): 605-617.
2. Anderson, R. C., Bates, T. W., Bizjak, J. M., and Lemmon, M. L. (2000). Corporate governance and firm diversification. Financial Management, 29(1): 5-22.
3. Berger, P. G., and Ofek, E. (1995). Diversification’s effect on firm value. Journal of Financial Economics, 37: 39-65.
4. Bhide, A. (1990). Reversing corporate diversification. Journal of Applied Corporate Finance, 3(2): 70-81.
5. Brost, M. A., and Kleiner, B. H. (1995). New developments in corporate diversification strategies. Management Research News, 18(3): 24-33.
6. Campa, J. M., and Kedia, S. (2002). Explaining the diversification discount. The Journal of Finance, 57(4): 1731-1762.
7. Chen, C. N., and Chu, W. (2012). Diversification, resource concentration, and business group performance: Evidence from Taiwan. Asia Pacific Journal of Management, 29: 1045-1061.
8. Denis, D. J., Denis, D. K., and Sarin, A. (1997). Agency problems, equity ownership and corporate diversification, The Journal of Finance, 52: 135-160. 9. Denis, D. J. , Denis, D. K., and Yost, K. (2002). Global diversification, industrial
diversification and firm value. The Journal of Finance, 57: 1951-1979.
10. Dey, T. and Banerjee, R. (2011). Can corporate diversification promote firm value? A survey, University of Munich Working Paper, No. 28928, http://mpra. ub.uni-muenchen.de/28928/
11. Erdorf, S., Hartmann-Wendels, T., Heinrichs, N., and Matz M. (2013). Corporate diversification and firm value: A survey of recent literature. Financial Markets and Portfolio Management, 27(2): 187-215.
12. Errunza, V., and Senbet, L. (1984). International corporate diversification, market valuation, and size-adjusted evidence. The Journal of Finance, 39: 727-745.
13. Fauver, L., Houston, J., and Naranjo, A. (2003). Capital markets development, international integration, legal systems, and the value of corporate diversification: A cross-country analysis. Journal of Financial and Quantitative Analysis, 38(1): 135-157.
14. Fleming, G., Oliver, B., and Skourakis, S. (2003). The valuation discount of multi-segment firms in Australia. Accounting and Finance, 43: 167–185. 15. Gonenc, H., Kan, O. B., and Karadaglı, E. D. (2007). Business groups and
internal capital markets. Emerging Markets Finance and Trade, 43(2): 63–81. 16. Gunduz, L., and Tatoglu, E. (2003). A comparison of the financial characteristics
of group affiliated and independent firms in Turkey. European Business Review, 15(1): 48-54.
17. Harris, M., Kriebel, C.H., and Raviv, R. (1982). Asymmetric information, incentives and intrafirm resource allocation. Management Science, 28(6): 604– 620.
18. Hausman, J. A. (1978). Specification tests in econometrics. Econometrica, 46(6): 1251–1271.
19. He, X. (2009). Corporate diversification and firm value: Evidence from post-1997 data. International Review of Finance, 9(4): 359-385.
20. Hoechle, D., Schmid, M. M., Walter, I., and Yermack, D. (2012). How much of the diversification discount can be explained by poor corporate governance? Journal of Financial Economics, 103: 41-60.
21. Jensen, M. C. (1986). Agency costs of free cash flow, corporate finance, and takeovers. The American Economic Review, 76(2): 323-329.
22. Jensen, M. C., and Murphy, K. J. (1990). Performance pay and top management incentives. The Journal of Political Economy, 98(2): 225-264.
23. Khanna, T., and Palepu, K. (1997). Why focused strategies may be wrong for emerging markets. Harvard Business Review, 75(4): 41-51.
24. Khanna, T., and Palepu, K. (2000a). Is group affiliation profitable in emerging markets? An analysis of diversified Indian business groups. The Journal of Finance, 55(2): 867-891.
25. Khanna, T., and Palepu, K. (2000b). The future of business groups in emerging markets, long-run evidence from Chile. Academy of Management Journal, 43(3): 268-285.
26. Khanna, T., and Rivkin, J. (2001). Estimating the performance effects of business groups in emerging markets. Strategic Management Journal, 22(1): 45-57. 27. Kim, H., Hoskisson, R. E., Tihanyi, L., and Hong, J. (2004). Evolution and
restructuring of diversified business groups in emerging markets: The lessons from chaebols in Korea. Asia Pacific Journal of Management, 21: 25-48. 28. Kuppuswamy, V., and Villalonga, B. (2010). Does diversification create value in
the presence of external financing constraints? Evidence from the 2008-2009 financial crisis, Harvard Business School Working Paper, No. 1569546, http:// ssrn.com/ abstract=1569546
29. Lang, L. H. P., and Stulz, R. M. (1994). Tobin’s q, corporate diversification, and firm performance. Journal of Political Economy, 102: 1248-1280.
30. Lee, K. T., Hooy, C. W., and Hooy, G. K. (2012). The value impact of international and industrial diversifications on public listed firms in Malaysia. Emerging Markets Review, 13(3): 366-380.
31. Lee, K., Peng, M. W., and Lee, K. (2008). From diversification premium to diversification discount during institutional transitions. Journal of World Business, 43(1): 47-65.
32. Lewellen, W. G. (1971). A pure financial rationale for the conglomerate merger. The Journal of Finance, 26(2): 521-537.
33. Li, M., and Wong, Y. (2003). Diversification and economic performance: An empirical assessment of Chinese firms. Asia Pacific Journal of Management, 20(3): 243-265.
34. Lins, K., and Servaes, H. (1999). International evidence on the value of corporate diversification. The Journal of Finance, 54(6): 2215–2239.
35. Lins, K., and Servaes, H. (2002). Is corporate diversification beneficial in emerging markets? Financial Management, 31(2): 5–31.
36. Majd, S., and Myers, S. C. (1987). The effects of taxation on capital accumulation. In M.Feldstein (Ed.), Tax asymmetries and corporate tax reform. Chicago, IL:
37. Maksimovic, V., and Phillips, G. (2007). Conglomerate firms and internal capital markets. In B.E. Eckbo (Ed.), Handbook of corporate finance. Amsterdam, North Holland: Elsevier.
38. Mansi, S. A., and Reeb, D. M. (2002). Corporate diversification: What gets discounted? The Journal of Finance, 57(5): 2167–2183.
39. Marinelli, F. (2010). The shareholder value and diversification puzzle, IESE Business School Working Paper, No. 853, http://ssrn.com/abstract=1645206 40. Martin, J. D., and Sayrak, A. (2003). Corporate diversification and shareholder
value: a survey of recent literature. Journal of Corporate Finance, 9: 37-57. 41. Meyer, M. A., Milgrom, P., and Roberts, D. J. (1992). Organizational prospects,
influence costs, and ownership changes. Journal of Economics and Management Strategy, 1(1): 9-35.
42. Miller, D. J. (2006). Technological diversity, related diversification, and firm performance. Strategic Management Journal, 27(7): 601–619.
43. Morck, R., and Yeung, B. (1991). Why investors value multinationality? Journal of Business, 64: 165-187.
44. Nachum, L. (2004). Geographic and industrial diversification of developing country firms. Journal of Management Studies, 41(2): 273-294.
45. Palich, L. E., Cardinal, L. B., and Miller, C. C. (2000). Curvilinearity in the diversification-performance linkage: An Examination of over three decades of research. Strategic Management Journal, 21: 155–174.
46. Peng, M.W., and Delios, A. (2006). What determines the scope of the firm over time and around theworld? An Asia Pacific perspective. Asia Pacific Journal of Management, 23(4): 385–405.
47. Ramaswamy, K., Li, M., and Petit, B. S. P. (2004). Who drives unrelated diversification? A study of Indian manufacturing firms. Asia Pacific Journal of Management, 21(4): 403-423.
48. Saloner, G. (1987). Predation, mergers, and incomplete information. RAND Journal of Economics, 18: 165–186.
49. Scherer, F. M. (1980). Industrial market structure and economic performance. Chicago, IL: Rand McNally.
50. Servaes, H. (1996). The value of diversification during the conglomerate merger wave. The Journal of Finance, 51(4): 1201–1225.
51. Shleifer, A., and Vishny, R. W. (1992). Liquidation values and debt capacity: A market equilibrium approach. The Journal of Finance, 45: 379-396.
52. Singh, M., Nejadmalayeri, A., and Mathur, I. (2007). Performance impact of business group affiliation: An analysis of the diversification-performance link in a developing economy. Journal of Business Research, 60(4): 339–347.
53. Stein, J. C. (1997). Internal capital markets and the competition for corporate resources. The Journal of Finance, 52: 111-133.
54. Teece, D. J. (1980). Economies of scope and the scope of the enterprise. Journal of Economic Behavior and Organization, 1(3): 223-247.
55. Teece, D. J. (1982). Towards an economic theory of the multiproduct firm. Journal of Economic Behavior and Organization, 3(1): 39-63.
56. Whited, T. M. (2001). Is it inefficient investment that causes the diversification discount? The Journal of Finance, 56(5): 1667-1691.
57. Villalonga, B. (2003). Research roundtable discussion: the diversification discount, Social Science Research Network Working Paper, No. 402220, http:// ssrn.com /abstract=402220.
58. Villalonga, B. (2004a). Does diversification cause the ‘diversification discount’? Financial Management, 33(2): 5–27.
59. Villalonga, B. (2004b), Diversification discount or premium? New evidence from the Business Information Tracking Series. The Journal of Finance, 59(2): 479-506.
60. Williamson, O. E. (1975). Markets and hierarchies: Analysis and antitrust implications. New York, NY: Collier Macmillan Publishers.
61. Wulf, J. (2009). Influence and inefficiency in the internal capital market. Journal of Economic Behavior and Organization, 72(1): 305-321.
62. Yiu, D., Bruton, G., and Lu, Y. (2005). Understanding business group performance in an emerging economy: Acquiring resources and capabilities in order to prosper. Journal of Management Studies, 42(1): 183-206.
63. Yucel, E., Ozmen, M., and Onal, Y. B. (2012). Firma çeşitlendirmesinin etkilerinin Berger ve Ofek yöntemiyle incelenmesi. BDDK Bankacilik ve Finansal Piyasalar, 6(2): 147-184.
64. Yurtoglu, B. B. (2000). Ownership, control and firm performance of Turkish listed firms. Empirica, 27(2): 193-222.