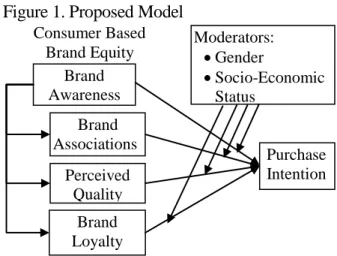
Effect of Consumer Based Brand Equity on Purchase Intention in Consumer Industries: Considering Socioeconomic Status and Gender as Moderating Effects
Tam metin
Şekil
Benzer Belgeler
Open during the summer months, offering exercise andf refreshment, a separate children’s pool and Poolside Cabanas for rent.. Pool Bar and Terrace Restaurant provide drinks and
yüzyıl ortalarında İdil-Ural bölgesinde artık kendi dillerinde bir gazete çıkarma ihtiyacı aydınlar arasında güçlü bir istek ve vazife hâline gelmiş; ama, Rus hükûmeti
Diğer taraftan DEHB belirti düzeyi ile negatif korele şekilde intihar girişimi öyküsü olan BB tanılı hastaların işlevsellik düzeyleri anlamlı olarak düşük
A- aşama 8.1, çanak yaprak taslaklarının görülmeye başlandığı ilk çiçek taslakları, B- aşama 8.2, çanak yaprak halkası ve taç yaprak taslakları olan çiçek taslağı,
Karl Popper became a very instrumental figure for Colin Rowe and Fred Koetter in Collage City to ground their criticism of the utopian and totalitarian character of orthodox
the city of Mersin owed its character to its relationship to the sea and its trade relations, and although he proposed a new port area on the eastern extension of the city,
Bunlara ilave olarak canlı farklı bir metalin biyolojik kullanılabilirliliğine maruz kaldığında yeni metal vücut dokularındaki önceden birikmiş metal elementinin
Araştırmadan elde edilen bulgular diyabetli hastalarda şişman lık oranının fazla görüldüğünü genellikle şişman hastaların diyet uy gulamadıklarını,
