THE ANALYSIS OF INTERLOCKING DIRECTORS VIA HYPERGRAPHS
¨
OMER AKG ¨ULLER1, MEHMET ALI BALCI1,§
Abstract. Since the dawn of the modern era, the associations that link companies to-gether in the gathering and control networks have been interconnected. At the level of corporate governance, companies are linked by common stock directors, joint sharehold-ers and joint directors (interlocking directors). Although often depicted as atomic, indi-vidual, unconnected market actors are actually embedded in such networks. In this study, we examine the network characteristics of interlocking directors of Turkish firms listed in ISO 500 and Borsa Istanbul Stock Exchange. To capture the higher order relations, we use hypergraphs to model interlocking directors and their relations. By introducing a simple graph representation based on the connectedness of agents in a hyper-network, we also give the community structure that is a cluster of densely connected nodes. The results we obtain in this study indicate that companies of Turkish market operating in global scale have central positions in their interlocking director network.
Keywords: Director network, hypergraphs, hyper networks, network community AMS Subject Classification: 05C65, 90C35, 94C15
1. Introduction
In financial markets, one of the observed and challenging patterns is the interlocking directors. An interlocking director is identified as the individual who affiliates with more than one board of a company [31]. With the help of developments in the network analysis, the network of interlocking directors has become subject to many researches [16, 12, 29, 27]. The first studies of the interlocking directors are back to 30s [1]. Later studies suggest that the interlocking directors can be considered within three models. The first model is the reciprocity theory of interlocking directors [5]. In this model it is shown that connecting companies to one another reduces the external uncertainties [23]. For instance, a risk caused by a supplier can be reduced by directors in cross relation. The second model is the resource-based theory [21]. In this model, a risk can be reduced by interlocking the boards and borrowers. Finally, the third model is the class hegemony theory [11, 7]. In the class hegemony theory, the boards of companies are formed dominantly by the ascendant individuals in the society. Reciprocal and resource-based theories are effective to study
1
Mu˘gla Sıtkı Ko¸cman University, Faculty of Science, Department of Mathematics, Mu˘gla, Turkey. e-mail: [email protected]; ORCID: https://orcid.org/0000-0002-7061-2534.
e-mail: [email protected]; ORCID: https://orcid.org/0000-0003-1465-7153. § Manuscript received: April 18, 2019; accepted: May 22, 2019.
TWMS Journal of Applied and Engineering Mathematics, Vol.11, No.1© I¸sık University, Department of Mathematics, 2021; all rights reserved.
the networks properties of interlocking directors, since they allow to treat family-owned business in which heredity identity of boards are strictly kept.
In order to study statistical patterns in networks, the scale free characteristic called small-world property, which suggests that degree distribution follows a power law, emerges as a powerful tool. In the case of interlocking director network, the small-world property is observed in many countries’ cases such as US [20, 5, 9], UK [20, 9], European Union [20, 17, 33, 9], South Africa [13], and South Korea [24]. However, there is still a debate on degree distributions may follow Weibull distribution and mixture of Weibull distribution and power law [8, 22, 32, 35, 10].
In this study, we aim to model interlocking directors of Turkish companies by using hypergraphs. Hypergraphs are generalization of simple graphs in which an edge does not have to contain only two vertices. Such edges are called hyperedges. Hyperedges involve higher dimensional information rather than the edges of simple graphs [30, 4, 40, 28, 19]. Besides, the degree distributions can be found for both vertices and hyperedges. Therefore, this let us to analyze the network more deeply. The most common method to obtain a interlocking director network is bipartite graphs. Hypergraphs emerge as more powerful tools to capture higher order relations in a system. Besides, to our best knowledge there are no researches on interlocking director networks using hypergraphs. Since our aim is to determine how companies are connected through the boards of directors and which companies are dominant in the market, we determine vertices as Turkish companies and hyperedges as the directors. There are several simple graph representations of hypergraphs [38, 2, 3] by including the higher order relations. In this study, we also use clique-complex representation of a higher graph first presented in [3] to find densely connected companies. By using this representation, we are allowed to determine most dominant companies.
Rest of the paper is organized as follows: In Section 2, we present some basics on hypergraphs and their simple graph representations. Besides, we give the definitions of degree distributions and clustering coefficients for vertices and hyperedges. Moreover, we define new global and semi-global measures for hypergraph statistics. The data we used in this study is also detailly discussed in Section 2. In Section 3, we present the experimental results we obtain for hypergraph model and simple graph representations. Finally, in Section 4, we present a detailed discussion on our results and give conclusions.
2. Material and Methods
2.1. Hypergraphs and Representations. Hypergraphs are generalization of graphs in such way that allowing edges contain more than two vertices. Hypergraphs are being widely studied since last few decades as efficient tools to represent and model complex concepts and structures. Specifically, an undirected hypergraph H = (V, E) is consisting of tuple where V is set of vertices and E is set of hyper-edges. Each hyper-edge e ∈ E may contain arbitrarily many vertices; thus e ⊂ PV. By this definition, a hypergraph can be considered as a set system. Throughout this study we only consider undirected hypergraphs. We strongly recommend readers to [15] for details on directed hypergraphs. An undirected simple graph is a special case for a hypergraph, in which the cardinality of a hyper-edge is restricted to two.
For a hypergraph H = (V, E), the degree dV(v) of v ∈ V is the number of hyper-edges containing v. By following same fashion, the degree dE(e) of a hyper-edge e ∈ E can be defined as the number of vertices belongs to e. It is straightforward that if dE(e) = 2 for all e ∈ E, then H is a simple graph. The vertex degree distributions of a simple graph give us a glimpse into the structure of a network modelled by respected graph. The degree distributions are also helpful to distinguish different types of networks [25]. However,
the degree distribution ignores how vertices are connected for a simple graph. In the hypergraph setting, an edge degree may be different than two. Therefore, it is possible to determine hyper-edge distributions. By counting how many vertices and edges have each degree, we can form the vertex degree distribution PdV(v)(k), defined by
PdV(v)(k) = fraction of vertices in H with the degree k (1)
and the hyperedge degree distribution PdE(e)(k), defined by
PdE(e)(k) = fraction of hyperedges in H with the degree k. (2)
The more details on degree distributions for hypergraphs can be found in [39].
The correlation between the vertex and hyperedge connectivity let us to define more hypergraph statistics. In [14], the most common clustering coefficient for simple graphs is extended to hypergraph setting. The set of hyperedges that contain v ∈ V is called the neighborhood of v and denoted by N (v). Similarly, the neighborhood of the hyperedge e ∈ E is the union of the neighborhoods of the vertices contained in e and denoted by N (e). Then, the hypergraph clustering coefficient CCV(u, v) for the pair of vertices u, v ∈ V is defined by
CCV(u, v) = |N (u) ∩ N (v)|
|N (u) ∪ N (v)|. (3)
The CCV determines how hyperedges are overlapped. By the analogy, it is possible to determine the hypergraph clustering coefficient CCE(ei, ej) for the pair of hyperedges
ei, ej ∈ E by
CCE(ei, ej) =
|N (ei) ∩ N (ej)|
|N (ei) ∪ N (ej)|
. (4)
Beside the presented local measures, one may ask to identify global or semi-global measures for hypergraph statistics. Before presenting a global measure for ensemble of hyper-paths, we need to give some basic definitions. For a hypergraph H = (V, E), the sequence of vertices and hyperedges v1, e1, v2, e2, . . . , vk−1, ek, vk is called a hyper-walk
between the vertices v1, vk∈ V for 1 ≤ i ≤ k − 1. AH = AAT − DVis called the adjacency
matrix of H for A is the |V | × |E| type binary matrix in which entries are defined by A(i, j) = 1 if vi ∈ ej, AT is the transpose of A, and DV is the diagonal matrix whose
entries are degrees of corresponding vertices. In order to express the relation between the powers of AH and the hyper-walks, we present the following theorem.
Theorem 2.1. Let H = (V, E) be a hypergraph with the adjacency matrix AH and vi, vj ∈
V . Then, the number of hyper-walks from vi to vj of length k in H is the entry in position
(i, j) of the matrix AkH.
The global measure we present for a hypergraph is similar to Katz index [18], and can be formulated as KH(vi, vj) = ∞ X k=1 βk L <k> ij , (5)
where L<k>ij is the set of all hyper-walks with length k connecting vi and vj, and β is a
free parameter. By a direct result of Theorem 2.1,
KH(vi, vj) = βAH(i, j) + β2A2H(i, j) + β3A3H(i, j) + · · · . (6)
To ensure the convergence of the series expansion in the Equation 6; β must be lower than the reciprocal of the largest eigenvalue of AH.
The second measure we extend for hypergraphs in this study is a semi-global one and called local random walk (LRWH). When a random walker is initially put on vertex vi
with the initial density vector ~πvi(0), density vector evolves as ~πvi(t+1) = P
T~π
vi(t), where
P is the transition probability matrix. Then, each entry of P is
p(i, j) =X e∈E a(vi, e) dV(v i) a(vj, e) dE(e) (7)
where a(u, e) are the entries of the |V | × |E| matrix A. Moreover, P = DV−1ADE−1AT for DE is the diagonal matrix of edge degrees. Hence, LRWH is defined by
LRWH(vi, vj) = qvip(vi, vj) + qvj(vj, vi), (8)
where qv is the initial configuration function.
Due to huge corpus of methods and algorithms, even though there may be a loss of information, the simple graph representation of hypergraphs is a very effective analysis tool. The most common representation is regarding to bipartite graphs. A bipartite graph is subclass of simple graphs such that the set of vertices decomposed into two disjoint sets in a way that none of two vertices are within the same set are adjacent [37]. For a hypergraph H = (V, E), its bipartite graph representation GB = (V1∪ V2, EB) is tuple
with V1 = V , V2 = E, and EB is the set of dyadic relations of hyper-edge inclusions. The
second representation we use in this study is related to the connectivity of the vertices through hyper-edges. Let H = (V, E) be a hypergraph. Then; since each ei ∈ E involves
arbitrarily many vertices, there exist such a simple graph GCi = (ei, ECi) such that each
vertices in eiare adjacent. Therefore, the Boolean sum of GC = GC1L · · · L GCmemerges
as a simple graph representation of H regrading to hyper-connectivity of vertices.
In the studies of interlocking director networks it is common to use bipartite graphs to represent relations. This representation has two distinct vertex subsets as companies and directors. Since there always exist a GB = (V ∪ E, EB) for all H = (V, E), we may
conclude that interlocking director networks can also be expressed by a hypergraph. Since the aim of our study to analyse the characteristics of Turkish companies through their interlocking directors, we choose the set of vertices as companies and the set hyper-edges as directors in board in the hypergraph representation.
In network analysis, a number of different characteristics such as small-world prop-erty, heavy-tailed degree distributions, different topological structures occur commonly. Another common characteristic is the community structure. Community structure of a network is a cluster of densely connected vertices. The community structures of net-works expressed with simple and hyper-graphs are extensively studied. In our study, we use the GC representation of the hypergraph and determine the communities by using
Girwan-Newman algorithm. This algorithm identifies edges in a network that lie between communities by maximizing the modularity index, and then leave them behind to obtain non-overlapping vertex clusters [26]. The modularity index for GC then is defined by
Q = NC X i=1 Ek m − 1 4m2 X j∈Vk di(j) 2 , (9)
where Ek is the number of edges in the k-th module, NC is the total number of modules,
m is the total number of edges and d(j) is the vertex degree.
2.2. Data Set. After the new Turkish Commercial Code was introduced, changes related to the obligations of companies regarding their board of directors have been done by extinguishing the restriction of three members in board of directors. Also, it is mandatory to have a board of directors for a joint stock company.
The data set for this study comprise the affiliations of directors in the top 500 Industrial Organizations (ISO 500) and the companies operating in BIST (Borsa ˙Istanbul Stock Exchange Market). The data was collected from the web site of Turkey Public Disclosure Platform (KAP). Directors’ names were double-checked to be verified. Besides, by using the public web-sites of each company, we identified if the directors are the same person.
As a final result, we obtained 870 distinct companies and 3926 distinct directors. The average number of board of directors is 1.28553 and the standard deviation is 0.806805 with skewness of 4.73304 and kurtosis of 34.1799 for analysed companies.
3. Experimental Results
The H = (V, E) hypergraph model for the interlocking directors of Turkish companies is formed with |V | = 870 and |E| = 3926. The degree distribution of the vertices and hyper-edges are presented in Figure 1.
0.0 0.2 0.4 0.6 0.8 1.0 0.0 0.2 0.4 0.6 0.8 1.0 PdE Weibull 0.0 0.2 0.4 0.6 0.8 1.0 0.0 0.2 0.4 0.6 0.8 1.0 PdV Weibull
Figure 1. Hyper-edge and vertex degree distributions for the formed hypergraph
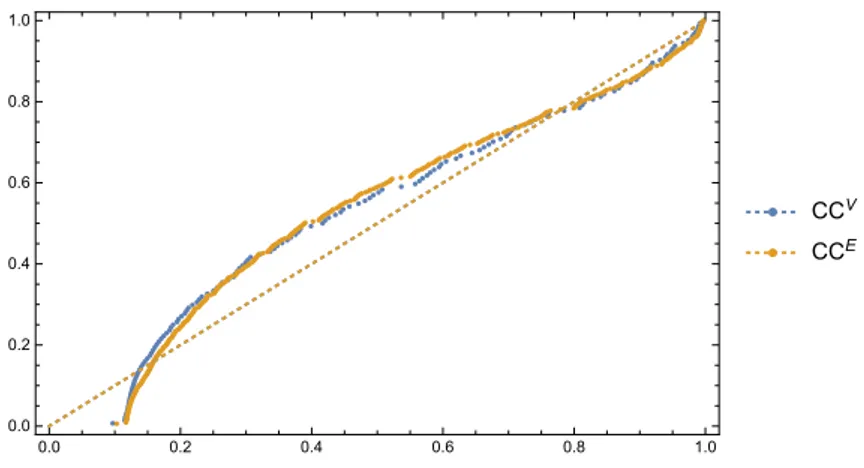
Clustering coefficients for both vertices and hyper-edges are determined respect to the ratio of the intersection and union of topological neighboring. In Figure 2, we present the probability plot of CC values of the hypergraph respect to normal distribution. The clustering coefficients are pretty close to normal distribution, hence the hypergraph model serves as a powerful tool.
0.0 0.2 0.4 0.6 0.8 1.0 0.0 0.2 0.4 0.6 0.8 1.0 CCV CCE
Figure 2. Probability plot of CCV and CCE for the formed hypergraph
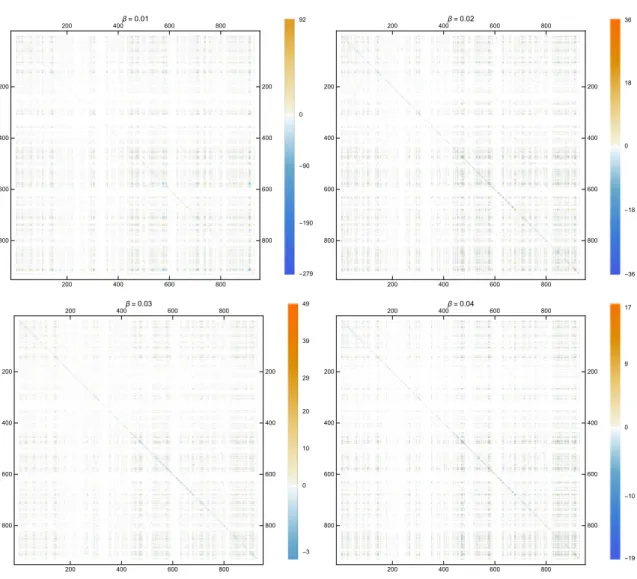
The Katz indices for the formed hypergraph H is presented in Figure 3. For the con-vergence, β parameter needs to be lesser than the reciprocal of the largest eigenvalue of the adjacency matrix. Since the computational complexity of the largest eigenvalue is too
200 400 600 800 200 400 600 800 200 400 600 800 200 400 600 800 β = 0.01 -279 -190 -90 0 92 200 400 600 800 200 400 600 800 200 400 600 800 200 400 600 800 β = 0.02 -36 -18 0 18 36 200 400 600 800 200 400 600 800 200 400 600 800 200 400 600 800 β = 0.03 -3 0 10 20 29 39 49 200 400 600 800 200 400 600 800 200 400 600 800 200 400 600 800 β = 0.04 -19 -10 0 9 17
Figure 3. Katz indices for different β parameters
high, we estimate the β parameter as to be lesser than the reciprocal of the greatest vertex degree.
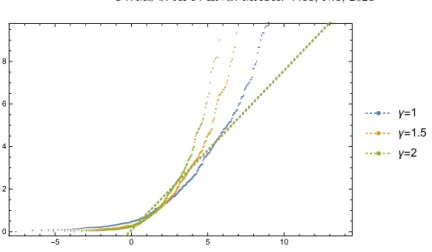
In order to express semi-global similarity measure, we present local random walk dis-tributions by setting qv = (dV(v))/γ for γ ∈ R. The quantile plot of LRW measure is
presented in Figure 4 for γ = 1, 1.5, 2. The lesser γ values let the shorter hyper-paths to be more important.
By using the higher order relations encoded in hypergraph model we are able to obtain two different simple graph representations, namely GB and GC. The simple graph model
of GC is represented in Figure 5 as it is a clique-complex. GC has one big component and
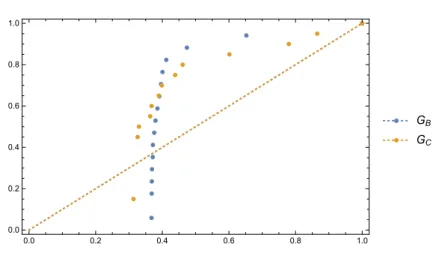
clique components with lesser vertex number. The vertex distributions of GB and GC are
presented in Figure 6. As in the degree distributions of hypergraph model, these degree distributions of GB and GC both follow Weibull Distribution.
GC representation of H encodes the information how the companies are connected
through their boards of directors. Therefore, GC involves clusters called graph
commu-nities. In order to determine communities in GC, we use the modularity maximization
method. The total number of the obtained communities is 491. The biggest component of GC involves 9 different communities in itself. The rest are emerge from the connected
-5 0 5 10 0 2 4 6 8 =1 =1.5 =2
Figure 4. LRW indices for different γ parameters
Figure 5. The GC representation of the hypergraph model
lesser components. Since we aim to analyse the flow of information through the board of directors, we restrict further cluster analysis on the communities of the biggest component. In the literature, the most common filtration of complicated data sets are minimum spanning trees (MST) and planar maximally filtration graphs (PMFG). The common idea underlying these two approaches is to filter the dense weight matrix while maintaining global constraints on the topology of the resulting network by preserving the least and most likely possible subgraph. In particular, in the MST approach, the edges with the largest weights (eg, correlations) are preserved when the sub-graph is spherically limited as a spanning tree. Similarly, in PMFG filtering, the largest weights (eg, the greatest correlation coefficients) are maintained to be the triangulation of a sub-graphical sphere obtained as a result of filtering. The result is that PMFG filtering contains more infor-mation than MST, since n − 1 in the MST filtering of a network with |V | = n vertices has 3n − 6 edges in PMFG filtering [36]. Even though our resulting communities are un-weighed, we use PMFG filtration to capture maximally relations among vertices in order
0.0 0.2 0.4 0.6 0.8 1.0 0.0 0.2 0.4 0.6 0.8 1.0 GB GC
Figure 6. Vertex degree distributions of GB and GC
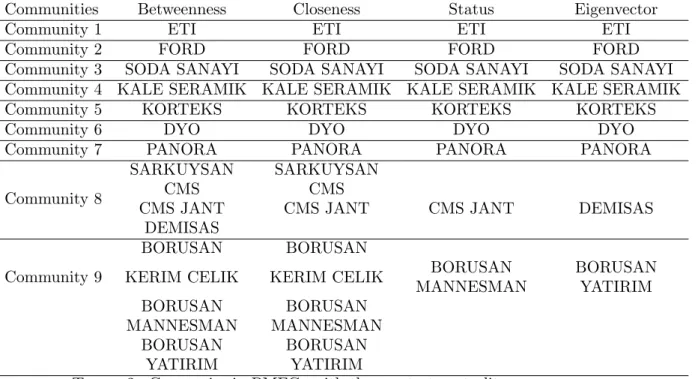
to measure centralities. Then, we are able to determine the most effective vertices by centrality measures. In Table 1, we present simple graph centrality measures and metrics for the each community of the biggest component and in Table 2, we present companies with the greatest centrality scores.
Community Closeness Betweenness CC Status Eigenvector
Community 1 0.522431 23.7255 0.284576 0.00982351 0.0196078 Community 2 0.531984 16.6757 0.341905 0.0170813 0.027027 Community 3 0.53307 16.1667 0.35731 0.0179859 0.0277778 Community 4 0.547403 11.1154 0.413555 0.0325587 0.0384615 Community 5 0.587231 5.53333 0.516787 0.105353 0.0666667 Community 6 0.61201 4. 0.57672 0.202357 0.0833333 Community 7 0.699327 2. 0.646561 0.4195 0.111111 Community 8 1. 0. 1. 8.07196 × 10¹⁵ 0.25 Community 9 1. 0. 1. 8.07196 × 10¹⁵ 0.25
Table 1. Graph centrality metrics for PMFG filtrations. The metrics are mean closeness centrality, mean betweenness centrality, mean clustering coefficient, mean status centrality, and mean eigenvector centrality, respec-tively.
4. Conclusions
The corporate governance between the chief executive officers and shareholders is most effected by a board of directors of a company. Board of directors are known to be parties managing the major decisions related to the company’s policies. In the case of interlocking directors, this management of the policies may be the subject to cross-firm relations. In the case of economic stress such as price fluctuations or supply-demand risks, cross-firm relations may need to be analyzed. Henceforth, the network theory and statistical analyses methods emerge as powerful analytical methods.
In this study, we present a hypergraph representation of the interlocking director net-work of Turkish companies. Our analysis involves 870 companies and 3926 distinct direc-tors. Our results on degree distributions indicate that both vertex and hyperedge degrees follow Weibull Distribution for Turkish companies. Beside the degree distribution, we
Communities Betweenness Closeness Status Eigenvector
Community 1 ETI ETI ETI ETI
Community 2 FORD FORD FORD FORD
Community 3 SODA SANAYI SODA SANAYI SODA SANAYI SODA SANAYI
Community 4 KALE SERAMIK KALE SERAMIK KALE SERAMIK KALE SERAMIK
Community 5 KORTEKS KORTEKS KORTEKS KORTEKS
Community 6 DYO DYO DYO DYO
Community 7 PANORA PANORA PANORA PANORA
Community 8
SARKUYSAN SARKUYSAN
CMS CMS
CMS JANT CMS JANT CMS JANT DEMISAS
DEMISAS
Community 9
BORUSAN BORUSAN
KERIM CELIK KERIM CELIK BORUSAN
MANNESMAN BORUSAN YATIRIM BORUSAN MANNESMAN BORUSAN MANNESMAN BORUSAN YATIRIM BORUSAN YATIRIM
Table 2. Companies in PMFGs with the greatest centrality scores.
present a new index called Katz index for hypergraphs in this study. Katz index can be seen as the global similarity measure. For the lesser β values respect to the largest eigen-value of the adjacency matrix of the hypergraph model, the similarity of the hyperedge formations tends to get higher.
Even hypergraph models encode higher order relations, it is possible to represent them with simple graphs. In this study we consider two different simple graph representation of the hypergraph model. First representation is bipartite graph in which vertices and hyperedges of H form distinct vertex set of GB, and edges of the bipartite representation
are formed by the hyperedge inclusion. The second representation we consider is respect to hyper-connectivity of the companies in the hypergraph model. GC representation has
the vertex set as the companies and has clique-complex structure. Degree distributions of GB and GC representations both follow Weibull Distribution.
Since GC has the clique-complex structure, it involves clusters by definition. Hence,
in order to analyze clusters, we use the High Modularity method to determine commu-nities in GC. The central vertices, that are the leading companies in each community,
are determined and the relations of Turkish companies through their board of directors are presented. The central vertices regarding to aforementioned centrality measures are emerge as the companies which are operating in global markets. Therefore, the realization of such companies significate the effectiveness of the method we present.
References
[1] A’Berle A., Means G. C. The modern corporation and private property, New York: Macmillan Co. 396, 1934
[2] Ausiello G., D’Atri A., Sacca D. (1986) Minimal representation of directed hypergraphs. SIAM Journal on Computing, 15(2), 418-431.
[3] Balcı M. A., Atmaca S. P., Akg¨uller ¨O. (2016) Hyperpath Centers. In Advanced Computational Methods for Knowledge Engineering (pp. 129-137). Springer, Cham.
[5] Caldarelli G., Catanzaro M. (2004) The corporate boards networks, Physica A, 338, 98–106.
[6] Caldarelli G., Scale-Free Networks. Complex Webs in Nature and Technology, Oxford University Press, 2007
[7] Caswell J. A. (1984) An institutional perspective on corporate control and the network of interlocking directorates. Journal of Economic Issues, 18(2), 619-626.
[8] Chang H., Govindan R., Jamin S., Shenker S. J., Willinger W. (2004) Towards capturing representative AS-level Internet topologies. Computer Networks, 44(6), 737-755.
[9] Conyon M., Muldon M. (2006) The small world of corporate boards, Journal of Business and Finance, Account, 33(9–10), 1321–1343.
[10] Dimitropoulos X., Krioukov D., Vahdat A., Riley G. (2009) Graph annotations in modeling complex network topologies. ACM Transactions on Modeling and Computer Simulation (TOMACS), 19(4), 17.
[11] Drago C., Millo F., Ricciuti R., Santella P. (2015) Corporate governance reforms, interlocking direc-torship and company performance in Italy. International Review of Law and Economics, 41, 38-49. [12] Du J., Lu J., Guo Y. (2015) Relationship between technological diversification of social network
and technological innovation performance: Empirical evidence from China. Science, Technology and Society, 20(1), 60-88.
[13] Durbach I. N., Parker H. (2009) An analysis of corporate board networks in South Africa. South African Journal of Business Management, 40(2), 15-26.
[14] Estrada E., Rodr´ıguez-Vel´azquez J. A. (2006) Subgraph centrality and clustering in complex hyper-networks. Physica A: Statistical Mechanics and its Applications, 364, 581-594.
[15] Gallo G., Longo G., Pallottino S., Nguyen S. (1993) Directed hypergraphs and applications. Discrete applied mathematics, 42(2-3), 177-201.
[16] Heemskerk E. M. (2011) The social field of the European corporate elite: a network analysis of interlocking directorates among Europe’s largest corporate boards. Global networks, 11(4), 440-460. [17] Heemskerk E. M., Schnyder G. (2008) Small states, international pressures, and interlocking
direc-torates: the cases of Switzerland and the Netherlands. European Management Review, 5(1), 41-54. [18] Katz L. (1953) A new status index derived from sociometric analysis. Psychometrika, 18(1), 39-43. [19] Klamt S., Haus U., Theis F. (2009) Hypergraphs and cellular networks. PLoS computational biology,
5(5), e1000385.
[20] Kogut B. (Ed.) The Small Worlds of Corporate Governance, MIT Press, Cambridge 2012
[21] Lang J. R., Lockhart D. E. (1990) Increased environmental uncertainty and changes in board linkage patterns. Academy of Management Journal, 33(1), 106-128.
[22] Leskovec J., Horvitz E. (2014) Geospatial structure of a planetary-scale social network. IEEE Trans-actions on Computational Social Systems, 1(3), 156-163.
[23] Mizruchi M. S., Schwartz M.. The structural analysis of business: An emerging field. Intercorporate Relations, New York: Cambridge University Press. 1987
[24] Nam H. J., An Y. (2018) The Effect of Interlocking Directors Network on Firm Value and Performance: Evidence from Korean-Listed Firms. Global Economic Review, 47(2), 151-173.
[25] Newman M. E. (2003) The structure and function of complex networks. SIAM review, 45(2), 167-256. [26] Newman M. E. (2006) Modularity and community structure in networks. Proceedings of the national
academy of sciences, 103(23), 8577-8582.
[27] O’Hagan S. B., Green M. B. (2004) Corporate knowledge transfer via interlocking directorates: a network analysis approach. Geoforum, 35(1), 127-139.
[28] Purkait P., Chin T. J., Sadri A., Suter D. (2017) Clustering with hypergraphs: the case for large hyperedges. IEEE transactions on pattern analysis and machine intelligence, 39(9), 1697-1711. [29] Rice M. D., O’Hagan S. B., Tiwari C., Lyons D. I., Green M. B., Oppenheim V. (2018) Defining the
Record of High-Growth Firms by Metropolitan Region: What Happens to the Inc. 500?. Papers in Applied Geography, 4(2), 137-156.
[30] Ritz A., Avent B., Murali T. M. (2017) Pathway analysis with signaling hypergraphs. IEEE/ACM transactions on computational biology and bioinformatics, 14(5), 1042-1055.
[31] Roy W. C. (1983). The unfolding of the interlocking directorate structure of the United States. Amer-ican Sociological Review, 248-257.
[32] Seshadri M., Machiraju S., Sridharan A., Bolot J., Faloutsos C., Leskove J. (2008) Mobile call graphs: beyond power-law and lognormal distributions. In Proceedings of the 14th ACM SIGKDD interna-tional conference on Knowledge discovery and data mining (pp. 596-604). ACM.
[33] Sinani E., Stafsudd A., Thomsen S., Edling C., Randøy T. (2008) Corporate governance in Scandi-navia: comparing networks and formal institutions. European Management Review, 5(1), 27-40.
[34] Stearns L. B., Mizruchi M. S. (1986) Broken-tie reconstitution and the functions of interorganizational interlocks: A reexamination. Administrative Science Quarterly, 522-538.
[35] Toivonen R., Kovanen L., Kivel¨a M., Onnela J. P., Saram¨aki J., Kaski K. (2009). A comparative study of social network models: Network evolution models and nodal attribute models. Social networks, 31(4), 240-254.
[36] Tumminello M., Aste T., Di Matteo T., Mantegna R. N. (2005) A tool for filtering information in complex systems. Proceedings of the National Academy of Sciences, 102(30), 10421-10426.
[37] Voloshin V. I., Introduction to graph and hypergraph theory. Nova Science Publ., 2009
[38] Wagner A., Fell D. A. (2001) The small world inside large metabolic networks. Proceedings of the Royal Society of London B: Biological Sciences, 268(1478), 1803-1810.
[39] Wong P., Althammer S., Hildebrand A., Kirschner A., Pagel P., Geissler B., Strack N. (2008) An evo-lutionary and structural characterization of mammalian protein complex organization. Bmc Genomics, 9(1), 629.
[40] Zhou D., Huang J., Sch¨olkopf B. (2007) Learning with hypergraphs: Clustering, classification, and embedding. In Advances in neural information processing systems (pp. 1601-1608).
Mehmet Ali Balcı received his BSc and PhD degrees from Department of Mathe-matics at Ege University in 2006 and 2013, respectively. He is an associated professor in the Department of Mathematics at Mu˘gla Sıtkı Ko¸cman University. His main re-search interests are graph theory, hypergraph theory, mathematical modelling, and complex networks.
¨
Omer Akg¨uller received his BSc from Department of Mathematics at Ege University in 2007, MSc and PhD degrees at Mu˘gla Sıtkı Ko¸cman University in 2010 and 2016, respectively. He is an assistant professor in the Department of Mathematics at Mu˘gla Sıtkı Ko¸cman University. His main research interests are hypergraph theory, complex networks, and discrete differential geometry.