TARIM BİLİMLERİ DERGISI 2008, 14 (4) 326-333 ANKARA ÜNİVERSİTESİ ZİRAAT FAKÜLTESI
Yield and Competition Indices of Intercropping Cotton
(Gossypium hirsutum
L.) Using Different Planting Patterns*
Muhammad Aasiml Ejaz Muhammad Umer2 Abdul Karim2
Geliş Tarihi: 03.06.2008 Kabul Tarihi: 01.08.2008
Abstract: The study reports comparative bioeconomic efficiency of different cotton based intercropping systems using high yielding cotton cv. NIAB 78 of Pakistan in 80 cm spaced rows and 120/40 cm spaced rows with cowpea and sorghum as intercrops. Land equivalent ratio showed 32-46 % advantage over sole cropping in both planting patterns. Values of Area time equivalent ratio showed 5-13 % advantage in cotton+cowpea and 9-23 % disadvantage in cotton+sorghum intercropping. Agressivity and competitive ratio showed dominancy of cotton over intercrops while intercrops were more dominant than cotton in actual yield loss values. Values of AYL showed an advantage of 32.1 % to 116.3 % from intercropping due to recovery made by intercrops. Intercropping advantage values showed intercropping disadvantage (-3.865 to -151.035) from intercropping due to price diffference of the component crop which meant that intercrops failed to compensate. Monetary advantage index values were also positive showing a definite yield advantage. Intercropping with cowpea reduced the yield of cotton, however, it seemed more appropriate for intercropping with cotton in both 80 cm and 120/40 cm spaced rows.. 120/40 cm spaced rows spacing seemed better compared to single row spacing for easy handling of intercrops and sole cotton, therefore, it is recommended for mechanical farming in Pakistan.
Key Words: competition indices, cotton, cowpea, sorghum, intercropping, planting pattern
De
ğ
i
ş
ik Ekim Modelleri Kullan
ı
larak Birlikte Ekilen Pamu
ğ
un
(Gossypium hirsutum
L.) Verim ve Rekabet Endeksleri
Öz: Bu çalışmada pamuğa dayalı ekim deseni sisteminde, Pakistan'da yaygın olarak yetiştirilen ve 80 cm ve 120/40 cm'lik sıra aralıklarında NIAB 78 pamuk çeşidi ile börülce ve sorgum beraber ekilerek biyoekonomik etkinliği karşılaştırılmıştır. Alan eşdeğer oranının birlikte ekimde yalın ekime göre % 32-46 oranında avantaj sağladığı görülmüştür. Area time değerlerinin pamuk+börülce ekiminde % 5-13 avantajli, pamuk+sorgum ekiminde ise % 9-23 dezavantajlı olduğu görülmüştür. Agresiviti ve Kompetetif oranı bakımından pamuk diğer bitkilere göre dominant görülmüştür. Ancak diğer bitkiler pamuğa göre asil verim kayıplarında daha dominant görülmüşlerdir. Birlikte ekimdeki AYL değerleri % 32.1 - 116.3 oranında düzelme avantajı göstermiştir. Birlikte ekim avantaj değerleri, (-3.865; -151.035) oranında negatif bulunduğundan ve fiyat değişikliklerinden dolayı amaca uygun olmadığı görülmüştür. Parasal avantaj endeks değerleri bakımından da yine kesin bir verim artışı görülmüştür. Börülce ile birlikte ekimde pamuk verimi düşmüştür ancak, pamuk ile birlikte ekimde 80 ve 120/40 cm'lik sıra aralığı sisteminde bu bitki en uygun görülmüştür. Pakistan'da makineli tarım için yalnızca pamuk ve birlikte ekimin kolay işlenmesinde kolaylık sağladığından dolayı 120/40 cm'lik sıra aralığı 80 cm'lik sıra aralığına göre tavsiye edilmiştir.
Anahtar Kelimeler: Rekabet indeksleri, pamuk, börülce, sorgum, birlikte ekim, ekim deseni
Introduction
In recent years, trends in agricultural production systems has changed towards achieving high productivity and promote sustainability over time. Farmers are developing different crop production systems to increase productivity and sustainability since ancient times. This includes crop rotation, relay
cropping and intercropping of major crops with other crops. However, several factors like cultivar selection, seeding ratios, planting pattern and competition between mixture components affect the growth of species in intercropping (Caballero et al. 1995, Carr et al. 2004).
*Summarised from the MSc. (Hons) Agri. thesis
°Department of Agronomy, Faculty of Agriculture, University of Agriculture, Faisalabad, Pakistan
Cotton (Gossypium hirsutum L.), is a major contributor of gross domestic produce (GDP) of Pakistan. It accounts for 10.5 ` )/0 of the value added in agriculture and about 2.4 % to GDP (Anonymous 2005). In addition to provision of raw material to the local textile industry, the surplus lint cotton is exported. Cotton was grown over an area of 2989 thousand hectares during 2003-04 growing season with a total production of 10048 thousand bales (Anonymous 2005) and plays an important role in the economy of Pakistani farmers. Shortage of fodder is another problem especially with small farmers (Abdullah and Chaudhary 1996), which demands a simultaneous increase in the production of cotton and fodders to meet the problem.
To solve the problem efficiently, cotton-based intercropping seems a promising strategy. Woodhead et al. (1994) reported intercropping as a well established practice with over 12 million hectares in South Asia only. Though intercrops reduce seed-cotton yield of the associated seed-cotton by 8-31% yet total crop productivity and net return per unit area are higher in intercropping than sole cotton (Mohammad et al. 1991). Different cotton based intercropping systems have been reported to increase farm income by 30- 40°/0 (Saeed et al. 1999), but magnitude of such agro-economic advantages depend upon the type of intercrop (Rao 1991). Conventional planting of cotton is done in close spaced 80 cm spaced rows which does not permit convinient easy handling of the major and intercrops. Sometimes farmers use widely spaced multi row strips giving more yield compared to conventional single row planting (Deshpande et al. 1989), which facilitates intercropping as well.
Higher yields have been reported when competition between the two species of the mixture is lower than competition within the same species (Vandermeer 1990). Interplant competition usually includes competition for soil water, available nutrients, and solar radiation (Buxton and Fales 1993). Competition can also have a significant impact on the growth rate of the different species used in intercropping (Dhima et al. 2007). Several indices such as land equivalent ratio, area time equivalent ratio relative crowding coefficient, competitive ratio, agressivity, actual yield loss, intercropping advantage and monetary advantage index have been developed to describe competition and economic advantage of intercropping compared to sole cropping (McGilchrist 1965, Willey 1979, Banik 1996, Ghosh 2004 ).
The present study include intercropping of a high yielding Pakistani cotton cv. NIAB 78; with short nodes, hairy leaves, long staple length, and early
maturing habit (150-160 days to mature). with cowpea and sorghum as intercrops for fodder with the objectives (i) to estimate the effect of competition among the different species at different planting patterns, (ii) to check the different competition indices in these intercropping systems, (iii) to find out the suitable planting pattern for intercropping system of cotton cv. NIAB 78 without affecting the productivity and easy handling, (iv) to asses the best system for resource management with respect to productivity, competition and economic parameters.
Material and Methods
The experiment was carried out at the Agronomic Research Station, University of Agriculture, Faisalabad, Pakistan during 1997 in randomized complete blok design with split plot arrangements and four replications in plots measuring 7 x 4.8 m. The cotton cv. NIAB-78 (hereafter called cotton) was sown on May 27, 1997 keeping sowing distance of 80 cm and 120/40 cm spaced rows followed by intercropping with cowpea (Vigna ungulculata) cv. P 76 (hereafter called cowpea) and sorghum (Sorghum vulgare L.) cv. BR 319 (hereafter called sorghum) as fodder crop in between the rows using single row hand drill. The intercrops were sown with line to line distance of 15 cm as intercrops and sole crops. Two lines of each
intercrop were sown in 80 cm spaced (10 per plot)
while three rows in 120 cm spaced rows system (9 per plot). The plant population of cotton was maintained at 20 cm. Both cv. NIAB 78 and intercrops were also sown alone to measure the Land Equivalent Ratio (LER) and Area Time Equivalent Ratio (ATER) (Table 3). All agronomic operations and practices were kept same and uniform for both intercropped and sole system. Sorghum was harvested 40 days after sowing, while cowpea was harvested 70 days after sowing.
The land equivalent ratio (LER) was used as criterion for measuring efficiency of intercropping advantage using the resources of environment compared with monocropping (Mead and Willey 1980). When the value of LER is greater than one, the intercropping favors the growth and yield of the species. When LER is lower than one the intercropping negatively effects the growth and yield of crops grown in mixtures (Caballero et al. 1995). Land Equivalent Ratio (LER) was calculated by the following formula.
LER= {La+Lb} La = (Yab/YaA)
328 TARIM BILIMLERI DERGISI 2008, Cilt 14, Sayı 4
where La and Lb are the LERs for the individual crops, Yab and Yba are the individual crop yields in intercropping and Yaa and Ybb are the individual crop yields in sole cropping.
Area time equivalent ratio provides more realistic comparison of the yield advantage of intercropping over monocropping in terms of time taken by component crops in the intercropping systems. ATER was calculataed by formula
Area time equivalent ratio (ATER) = LER x Dc / Dt (Heibsch 1980)
Where LER is land equivalent ratio of crop, Dc is time taken by crop, Dt is time taken by whole system,
Relative crowding coefficient (RCC or K) is the measure of relative dominance of one species over the other in intercropping (De Wit 1960). The K was calculated as
K = (K cotton x K intercrop)
K cotton = {Yab Zba} / {(Yaa Yab) Zab } K intercrop = {Yba Zab} /{ (Ybb — Yba)Zba } Where Zab is sown proportion of cotton in intercropping, Zba is sown proportion of intercrop in
intercropping, Yab is the yield of cotton in
intercropping, Yba is the yield of intercrop in
intercropping, Yaa is the yield of cotton in
monocropping and Ybb is the yield of intercrops in intercopping. When the product of two coefficients (K cotton x K intercrop) is greater than one, there is a yield advantage, if the value of K is one there is no yield advantage and if less than one there is no yield advantage and the system has disadvantage.
Agressivity (A) indicates the relative yield increase in "a" crop is greater than of "b" crop in an intercropping system (McGilchrist 1965). The agressivity can be derived from the following formula.
A cotton = {Yab / (Yaa X Zab)} — {Yba / (Ybb X Zba)}
If the value of A is zero, both crops are equal. İf
the value of A is positive then cotton is dominant over intercrops. If the value is negative then intercrops are dominant species over cotton. Similarly, agressivity of intercrops can also be calculated by the Formula.
A intercrops = {Yba / (Ybb X Zba) } — {Yab / (Yaa X Zab)}
Competitive ratio gives better measure of competitive ability of the crops and is also
advantageous as an index over K and A (Willey and Rao, 1980). The CR simply represents the ratio of individual LERs of the component crops and takes into account the proportion of the crops in which
CR cotton (LER cotton / LER intercrops) (Zba / Zab )
CR intercrops = (LER intercrops / LER cotton) (Zab / Zba )
Banik et al. (2000) reported that actual yield loss (AYL) index gave more precise information about the competition than the other indices between and within the component crops and the behaviour of each species in the intercropping systems, as it is based on yield per plant. The AYL is the proportionate yield loss or gain of intercrops compared to sole crop. Partial actual yield loss also represents the proportionate yield loss or gain of each species grown as intercrops compared to pure stand. The positive or negative values of AYL indicate the advantage or disadvantage of the intercropping. AYL can be calculated according to following formula (Banik 1996).
AYL = AYL cotton+ AYL intercrops
AYL cotton = { [(Yab / Xab) / (Ya / Xa)] — 1 } AYL intercrops = { [(Yab / Xab) / (Ya / Xa)] — 1 } Another index used in intercropping is intercropping advantage used by Banik et al. (2000) and Dhima et al. (2007) by the following formula.
IA cotton = (AYL cotton) X (P cotton)
IA intercrops = (AYL intercrops) X (P intercrops) Where P cotton is the commercial value of cotton
(470 $ ton-1) and P intercrops is the commercial value
of intercrops (15 $ ton-1) at the time of experiment
(1997).
All the competition indices donot provide any information of the economic advantage of the intercropping system. To calculate the economic advantage Monetary advantage index (MAI) was calculated as:
MAI = (value of combined intercrops) x (LER — 1) / LER
The higher the MAI value the more profıtable is
the cropping saystem (Ghosh 2004).
Each .treatment was replicated 4 times and contained 10 plants in all experiments. The data was analyzed by comparing means using one-way ANOVA and the post hoc tests were performed using Tukeysb test and LSD test.
Results
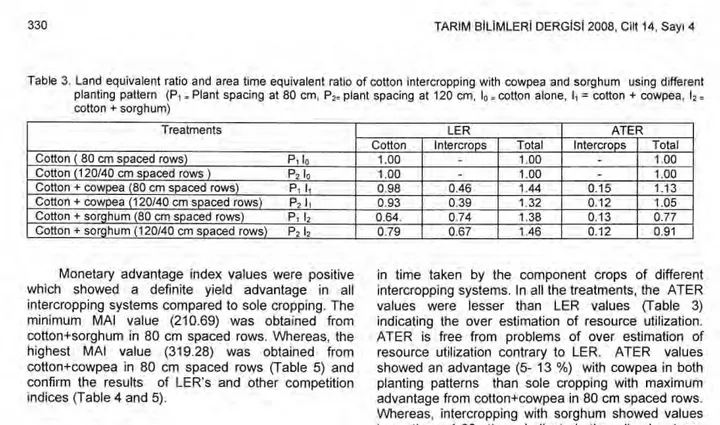
Partial LER of intercropped cotton was more than intercrops in both planting patterns with maximum LER (0.98) when cotton was intercropped with cowpea in 80 cm spaced rows followed by 120/40 cm spaced rows (0.93). Maximum partial LER of both intercrops were recorded in 80 cm spaced rows. Partial LER of sorghum (0.74) was maximum in 80 cm rows (table 3) followed by sorghum (0.67) in 120/40 cm spaced rows. Combined maximum LER was obtained in cotton+sorghum (1.46) at 120/40 cm spaced rows followed by cotton +cowpea (1.44) raised in 80 cm spaced single row.
Partial ATER values was found maximum in 80 cm spaced rows compared to 120/40 cm spaced rows with both intercrops. Maximum partial ATER value was recorded in cotton+cowpea (0.15) followed by cotton+ sorghum (0.13) in 80 cm spaced rows. Partial ATER in 120/40 cm spaced rows was found similar in both cotton+cowpea and cotton+sorghum. Total ATER values of was more than one in cotton+cowpea and less than one in cotton+sorghum (Table 3).
Partial K values of cotton was more than intercrops. Partial K values of cotton+cowpea was less than one. While, cotton+sorghum had found values more tahn one. Total K values were also more than one (4.969-35.724) (Table 4) with maximum from cotton+cowpea in 80 cm spaced rows (35.724) and (8.547) in 120/40 cm spaced rows, which also
indicating the defınite yield advantage due to
intercropping.
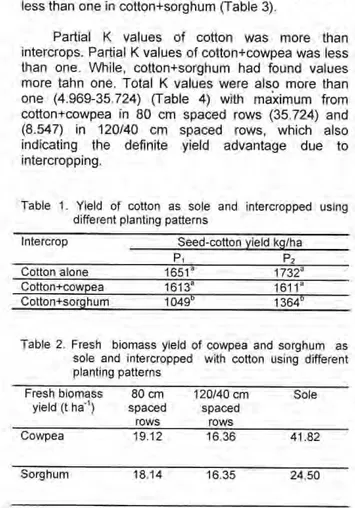
Table 1. Yield of cotton as sole and intercropped using different planting patterns
Intercrop Seed-cotton yield kg/ha
PI P2
Cotton alone 1651' 1732 a
Cotton+cowpea 1613a 1611 a Cotton+sorghum 1049" 1364"
Table 2. Fresh biomass yield of cowpea and sorghum as sole and intercropped with cotton using different planting patterns
Fresh biomass 80 cm 120/40 cm Sole yield (t ha -1 ) spaced spaced
rows rows
Cowpea 19.12 16.36 41.82
Sorghum 18.14 16.35 24.50
Maximum partial A value (0.117) for cotton was recorded in cotton+cowpea intercropping in 80 cm spaced rows followed by the same system (0.112) in 120/40 cm spaced rows planting patterns which meant that planting pattern had little effect on the agressivity when intercropped cotton with cowpea. Partial A value of cotton with sorghum was maximum (0.057) in 120/40 cm spaced rows followed by 80 cm spaced rows (0.032).
Partial CR values of cotton was recorded higher in 120/40 cm sapced rows with both intercrops. On the other hand, minimum partial values for intercrops was less in 120/40 cm spaced rows (Table 4). Maximum partial CR value for cotton (3.577) was recorded for cotton +cowpea in 120/40 cm spaced rows followed by the same in 80 cm spaced rows (3.551). On the other hand, there was a very little difference in the partial CR values of cowpea which indicated almost same competition to cotton in both planting patterns.
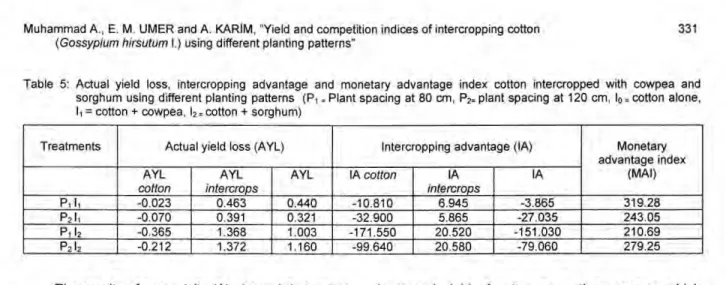
Results of AYL showed that intercrops were more dominant than cotton in intercropping as: Values of partial AYL of cotton was negative whereas intercrops had positive values (Table 5) probably due to the negative effects of intercrops on cotton. Intercropping with cowpea decreased the cotton yield of 2.3 % (AYL cotton = -0.023) in 80 cm spaced rows and 7.0 %
(AYL cotton = -0.070) in 120/40 cm spaced rows.
Intercropping with sorghum resulted in 36.5 % yield loss (-0.365) in 80 cm spaced rows and 21.2 % (- 0.212) yield reduction in 120/40 cm spaced rows compared to sole cotton. However, there was increase in intercrops yield in association with cotton. Cowpea showed 46.3 % (0.463) in 80 cm spaced rows and 39.1 % (0.391) yield advantage in 120/40 cm spaced
rows compared to sole cropping. Partial AYLintercrops
values showed more yield advantage from intercropping of sorghum over sole cropping. Sorghum got 136.8 % (1.368) more yield advantage in 80 cm spaced rows and 137.2 % (1.372) yield advantage in 120/40 cm spaced rows compared to sole cropping. Total values of AYL showed an advantage of 32.1 % to 116.3 % from intercropping compared to sole cropping due to recovery made by intercrops.
Intercropping advantage values indicates the disadvantage of the system as the total IA values were in negative. Similarly, partial IA values for cotton was found negative. Maximum negative value for cotton was recorded in cotton with sorghum (-171.550) in 80 cm spaced row followed by the same -99.640) in 120/40 cm spaced rows. Partial IA values for intercrops were positive meant intercrops got certain advantage due to intercropping with cotton. Maximum partial IA values for intercrops were found in sorghum in both planting pattern with little difference.
330 TARIM BILIMLERI DERGISI 2008, Cilt 14, Sayı 4
Table 3. Land equivalent ratio and area time equivalent ratio of cotton intercropping with cowpea and sorghum using different planting pattern (Pi = Plant spacing at 80 cm, P2. plant spacing at 120 cm, 10= cotton alone, Il= cotton + cowpea, 12 =
cotton + sorghum)
Treatments LER ATER
Cotton Intercrops Total Intercrops Total
Cotton ( 80 cm spaced rows) Pılo 1.00 1.00 - 1.00
Cotton (120/40 cm spaced rows ) P2 1 0 1.00 - 1.00 - 1.00
Cotton + cowpea (80 cm spaced rows) Pı 11 0.98 0.46 1.44 0.15 1.13 Cotton + cowpea (120/40 cm spaced rows) P2 1 1 0.93 0.39 1.32 0.12 1.05
Cotton + sorghum (80 cm spaced rows) Pı 12 0.64. 0.74 1.38 0.13 0.77
Cotton + sorghum (120/40 cm spaced rows) P2 12 0.79 0.67 1.46 0.12 0.91
Monetary advantage index values were positive which showed a definite yield advantage in all intercropping systems compared to sole cropping. The minimum MAI value (210.69) was obtained from cotton+sorghum in 80 cm spaced rows. Whereas, the highest MAI value (319.28) was obtained from cotton+cowpea in 80 cm spaced rows (Table 5) and confirm the results of LER's and other competition indices (Table 4 and 5).
Discussion
Land equivalent ratio (LER) reflects the extra advantage of intercropping system over sole cropping system. Partial LER for cowpea was lower than 0.5 which indicated advantage of cowpea for cotton in intercropping. While, partial LER for sorghum was more than 0.5, it indicated disadvantage for cotton in intercropping (Chen et al. 2004) and (Dhima et al. 2007). On the other hand, total LER was more than sole which showed an advantage of intercropping over sole system in terms of the use of environmental resources for plant growth. (Mead and willey 1980) also reported the higher land equivalent ratio over sole cropping system. The results indicates that 32 to 46 % area would be required by a sole cropping system to recover the yield of intercroping system (Miyda et al. 2005).
Area time equivalent ratio (ATER) provides more realistic comparison of the yield advantage of intercropping over sole cropping in terms of variation
in time taken by the component crops of different intercropping systems. In all the treatments, the ATER values were lesser than LER values (Table 3) indicating the over estimation of resource utilization. ATER is free from problems of over estimation of resource utilization contrary to LER. ATER values showed an advantage (5- 13 %) with cowpea in both planting patterns than sole cropping with maximum advantage from cotton+cowpea in 80 cm spaced rows. Whereas, intercropping with sorghum showed values less than 1.00 thus indicated the disadvantage. Intercropping with sorghum resulted in 9-23 ` )/0 disadvantage with maximum disadvantage from cotton+sorghum in 80 cm spaced rows. Higher ATER values of cotton+cowpea have also been reported by Khan et al. (2001) and (Khan and Khaliq 2004).
The values of relative crowding coefficient (K) for cotton was more than one and also more than intercrops, indicated that cotton was more competitive than intercrops. Partial K values for cotton intercropped with cowpea was more than cotton+ sorghum in both planting patterns. As the K value for cotton was very high in cotton+cowpea intercropping, the Kvalue for cowpea was below 1.00, indicating more competitive effect of cotton on cowpea. The K value of cotton intercropped with sorghum was also more than sorghum (Table 4) and the K value for sorghum was also more than 1.00 but less than cotton showed that cotton was again more competitive than sorghum. Khan et al. (2001) also reported more more K value for cotton intercropping with legumes over non legume fodders.
Table 4: Relative crowding coefficient, agressivity and competitive ratio of cotton intercropped with cowpea and sorghum using different planting Patterns Plant spacing at 80 cm, P2_ plant spacing at 120 cm, 10. cotton alone, I, = cotton + cowpea,12.cotton + sorghum)
Treatments Relative crowding coefficient (K) Agressivity (A) Competitive ratio (CR) K cotton K intercrops K A cotton A intercrops CR cotton CR intercrops
P, 11 70.745 0.505 35.724 0.117 -0.117 3.551 0.282
P211 19.971 0.428 8.547 0.112 -0.112 3.577 0.280
P1 1 2 2.904 1.711 4.969 0.032 -0.032 1.442 0.694
Table 5: Actual yield loss, intercropping advantage and monetary advantage index cotton intercropped with cowpea and
sorghum using different planting patterns (P, = Plant spacing at 80 cm, P2= plant spacing at 120 cm, lo. cotton alone,
= cotton + cowpea,12.cotton + sorghum)
Treatments Actual yield loss (AYL) Intercropping advantage (IA) Monetary
advantage index (MAI) AYL cotton AYL intercrops AYL IA cotton IA intercrops IA P, li -0.023 0.463 0.440 -10.810 6.945 -3.865 319.28 P2 11 -0.070 0.391 0.321 -32.900 5.865 -27.035 243.05 P112 -0.365 1.368 1.003 -171.550 20.520 -151.030 210.69 P2 1 2 -0.212 1.372 1.160 -99.640 20.580 -79.060 279.25
The results of agressivity (A) showed that cotton was the dominant species with positive values in the intercropping systems over the intercrops which had negative A values (Table 4). The higher A value of cotton with cowpea was due to the late harvesting of cowpea than sorghum. (Khan and Khaliq, 2004) also reported the lesser A values of cotton when intercrops were harvested earlier. The dominant behaviour of cotton having positive A values when grown in association with other intercrops were also reported by Khan and Khaliq (2004).
The similar trend of dominant behaviour of cotton to its associated intercrops by K and A was also observed for CR. Values for competitive ratios for intercropped cotton was higher than intercrops which revealed that cotton was more comOtitive than intercrops. Intercropped cotton had higher competitive ratios with cowpea in both planting patterns compared to sorghum. Competitive ratio for intercropped cotton with both intercrops was higher in 120/40 cm spaced rows plantation which showed better competition of cotton with intercrops compared to 80 cm spaced rows. However, difference between CR values of cotton and sorghum was lesser, indicating more competition between two crops compared to cotton and cowpea (Table 4). Khan et al. (2001) also reported that cotton was more competitive than cowpea and sorghum and partial CR values for sorghum was also higher than cowpea in both planting patterns.
The actual yield loss (AYL) index give more precise information about intercropping than the other indices on the inter- and intra-specific competetion and behaviour of the component crops. Quantification of yield loss or gain due to association with other species or variation of plant population could not be obtained through partial LER's whereas partial AYL shows yield loss or gain by its sign and as its value (Dhima et al. 2007). Partial AYL of cotton was negative whereas intercrops had positive values (Table 5) probably due to the negative effects of intercrops on cotton. Results further showed that intercropping with sorghum
decreased yield of cotton more than cowpea which might be due to the exhaustive effect of sorghum and early shading in the early growth stage of cotton.
Intercropping advantage (IA) is also an indicator of the economic feasibility of intercropping systems. The values of IA followed the same trend with AYL values. The values of partial IA showed that intercropping had economic disadvantage for cotton having negative values and advantage from intercrops having positive values in intercropping. Maximum economic disadvantage for cotton was observed with sorghum in 80 cm spaced rows due to more yield loss of cotton in this system. Partial values of IA for intercrops showed yield advantage having positive values with maximum advantage from sorghum. However, the IA values were almost same in both planting pattern which indicated no effect of planting pattern. Regardless of economic intercropping advantage from intercrops, total IA values showed intercropping disadvantage (-3.865 to -151.035) (table-5) from intercropping. The negative values of IA was due to price diffference of the component crop (cotton 470 $ per ton, intercrops 15 $ per ton) which means that intercrops failed to compensate.
Monetary advantage index values were positive which showed a definite yield advantage in all intercropping systems compared to sole cropping. These results also support the findings of (Ghosh 2004) who found that when the LER and K were higher there was also significant economic benefit expressed with higher MAI values.
Conclusion
Results obtained from competition indices showed a significant advantage advantage from intercropping for exploiting the resources of the environment compared to sole cropping which attributed to better economics and land use efficiency. Competition indices like LER, ATER, K, A, and MAI values were maximum for cotton+cowpea in 80 cm
332 TARIM BILIMLERI DERGISI 2008, Cilt 14, Sayı 4
spaced rows which indicating the better system for cotton intercropping. Values of ATER showed 9-23 % disadvantage from intercropping with sorghum in both planting patterns. The results of agressivity (A) showed that cotton was the dominant species with positive values in the intercropping systems over the intercrops.
Values for CR for intercropped cotton was higher than its associate crops; indicating that cotton was more competitive than intercrops. Intercropped cotton had higher competitive ratios with cowpea in both planting patterns compared to sorghum.
Results of AYL showed that intercrops were more dominant than cotton in intercropping probably due to the negative effects of intercrops on cotton. Intercropping with sorghum decreased yield of cotton more than cowpea which might be due to the exhaustive effect of sorghum and early shading in the early growth stage of cotton. However, total values of AYL showed an advantage of 32.1 % to 116.3 % from intercropping compared to sole cropping due to recovery made by intercrops. IA values showed intercropping disadvantage (-3.865 to -151.035) from intercropping due to price diffference of the component crop which means that intercrops failed to compensate. Monetary advantage index values were also positive showing a definite yield advantage.
Cowpea also reduced the cotton yield but showed almost the same growth as found in sole cotton and seemed more appropriate crop for the development of sustainable crop production with a limited use of external inputs with cotton in both single and 120/40 cm spaced rows spacing systems. However, 120/40 cm spaced rows spacing seemed better than single row spacing due to easy handling of intercrops and cotton and values of competition indices. This system can be used for mechanical farming in Pakistan.
References
Abdullah, M. and M.T. Chaudhary. 1996. Improved Fodder and Seed Production in Central Irrigated Punjab (Pakistan). In: Proceedings of National Conference on Production, Improvement and Utilization of Fodder Crops in Pakistan. PARC/FAO. Islamabad.
Banik, P. 1996. Evaluation of wheat (T. aestivum) and legume intercropping under 1:1 and 2:1 row replacement series system. J. Agron. Crop Sci. 176: 289-294.
Banik, P., T. Samsal, P. K. Ghosal and D.K. Bagchi. 2000. Evaluation of mustard (Brassica Compestris var. Toria) and legume intercropping under 1:1 and 1:2 row replacement series system. J. Agron. Crop Sci. 185: 9-14.
Buxton, C.L. and S.L. Fales. 1993. Plant environment and quality. In: Fahey, Jr., G. C. (Ed.) Forage Quality, Evaluation and Utilization. ASA, CSSA and SSSA, Madison, WI.
Caballero, R., E.L. Goicoechea and P.J. Hernaiz. 1995. Forage yield and quality of common vetch and oat sown at varying seed ratios and seeding rates of common vetch. Field Crops Res. 41: 135-140.
Carr, P.M., R.D. Horsley and W.W. Poland. 2004. Barley, oat and cereal-peamixtures as dryland forages in the Northern Great Plains. Agron. J. 96: 677-684.
Chen, C., M. Westcott, K. Neill, D. Wichman and M. Knox. 2004. Row configuration and nitrogen application for barley-pea intercropping in Montana. Agron. J. 96: 1730-1738.
Deshpande, R.M., S.G. Kharche and H.N. Rawankar. 1989. Studies on intercropping with legumes in relation to planting pattern of hybrid cotton. PKV Res. J. 13:100- 104.
De Witt, C.T. 1960. On competition. Verslag Landbouw-Kundige Onderzoek 66: 1-28.
Dhima, K.V., A.S. Lithourgidis, I.B. Vasilakoglou and C.A. Dordas. 2007. Competition indices of common vetch and cereal intercrops in two seeding ratio. Field Crops Res. 100: 249-256.
Anonymous, 2005. (ESP). Ministry of Finance, Govt of Pakistan. Annual report, Islamabad, Pakistan.
Ghosh, P.K. 2004. Growth, yield, competition and economics of groundnut/cereal fodder intercropping systems in the semi-arid tropics of India. Field Crops Res. 88: 227- 237.
Hiebsch, C.K. 1980. Principles of intercropping. "Effect of N fertilization and crop duration on equivalency ratios in intercrops versus monoculture comparisons." PhD Thesis. North Carolina State University, Raleigh, N. C., USA.
Khan, M.B., M. Akhter and A. Khaliq. 2001. Some competition functions and economics of different cotton based intercropping systems. Int. J. Agri. Bio. 3: 428-431. Khan, M.B. and A. Khaliq. 2004. Studies on intercropping
summer fodders in cotton. J. Res. Sci. 15: 325-331. McGilchrist, C.A. 1965. Analysis of competition experiments.
Biometrics 21: 975-985.
Mead, R. and R.W. Willey. 1980. The concept of land equivalent ratio and advantages in yields for intercropping. Exp. Agric. 16: 217-228.
Miyda, A., K. Bhattacharjee, S. S. Ghose and P. Banik. 2005. Deferred seeding of blackgram (Phaseolus mungo L.) and rice ( Olyza sativa L.) field on yield advantages and mothering of weeds. J. Agron. Crop Sci. 191: 195-201. Mohammad, M.K., G.M.S. El-din and A.A. Hosny. 1991.
Evaluating three patterns of intercropping cotton and forage cowpeas. Ann. Agric. Sci. Moshotor. 29: 1269- 84.
Rao, V.P. 1991. A study on intercropping of cotton with grain legumes under rainfed conditions. J. Res. APAU. 19: 73-74.
Saeed, M., M.R.M. Shahid, A. Jabar, E. Ullah and M.B. Khan. 1999. Agroeconomic assessment of different cotton-based inter-relay cropping systems in two geometrical patterns. Int. J. Agri. Bio. 4: 234-237. Vandermeer, J.H. 1990 (Eds.) Intercropping Agroecology.
McGraw-Hill New York
Willey, R.M. 1979. Intercropping, its importance and research needs, competition and yield advantages. Field Crop Absts. 32: 1-10.
Willey, R.W. and M.R. Rao. 1980. A competitive ratio for quantifying competition between intercrops. Exp. Agric. 16: 117-125.
Woodhead T., R. Huke and E. Huke. 1994. Areas, location and on-going collaborative research for the rice-wheat system in Asia, Bangkok, Thailand. FAO Bullet in, pp. 68-97
Correspondence Adress Muhammad Aasim
Department of Field Crops, Faculty of Agriculture, University
of Ankara, 06110 Dışkapı, Ankara, Turkey
E-mail: [email protected] Fax: +90-312-3179815