COMPARING THE MOST COMMONLY USED CLASSICAL METHODS FOR DETERMINING THE RIDGE PARAMETER IN RIDGE REGRESSION
Alper Sinan1, Aşır Genç2
1Sinop University ,Faculty of Sciences and Literature, Department of Statistics, Sinop/Turkey, [email protected]
2Selcuk University, Faculty of Science, Department of Statistics, Konya/Turkey, [email protected]
ABSTRACT
Multicollinearity is a most common problem in multiple regression models. Many different methods are developed to solve the problem of multicollinearity. Ridge regression estimation is a popular one of these methods. And the mostly investigated matter of this method is determining the ridge parameter; therefore, various procedures are developed for determining the ridge parameter in ridge regression. In this study, we compared the commonly used methods for choosing the ridge parameter in an actual data set taken from General Directorate of Turkish Highways and Turkish Statistical Institute. We calculated the ridge parameter by the methods which are known as ridge trace, ordinary ridge estimator and an iterative method for ordinary ridge estimator. We indicated the good and worst aspects of these methods in terms of mean square error (MSE), variance inflation factors (VIF) and the other multicollinearity statistics. According the results of this study, we found that, the ridge trace method is more useful then others when it is evaluated together with the statistics of model.
Keywords: Multicollinearity, ridge regression, ridge parameter 1. 1. INTRODUCTION
The multiple linear regression between a dependent variable( ) and a group of independent variables ( ) is given as;
= + (1)
Where, is a × 1 vector of observations on dependent variable, is a × matrix of observations on independent variables, is a × 1 vector of unknown paremeters which are called as regression coefficients and is a × 1 vector of random errors which are assumed as ~ (0, ).These dimensions of and are demonstrable when the model doesn’t includes constant patameter. But, if the model in equation (1)
includes constant parameter, a vector of ones must be added to the matrix and then will have + 1 columns, so will have + 1 rows with constant parameter. Ordinary least squares(OLS) estimator which is the most common unbiased estimator for parameter is obtained as;
= ( ′ ) ′ (2)
Note that, when the variables are standardized, ′ matrix is the correlation matrix between independent variables. Multicollinearity can be defined as the existance of highly correlated two or more columns in matrix. It is clear that, if an exact multicollinearity exists between independent variables, ′ matrix will be singular. Hence OLS estimates can not be found. The mathematical notation of the exact multicollinearity is in equation (3).
∑ = 0 (3)
When the correlation between independent variables is strong but not exact, it can be shown as;
∑ ≈ 0 (4)
where, is an any constant ( ≠ 0). The stuation defined in equation (4) can be denominate as strong multicollinearity. In this case, OLS estimates can be found but in this case multicollinearity causes some important problems in the estimation. Firstly it can dramatically impact the accuracy of tests on individual regression coefficients. A variable can be found insignificant, even though the variable is important. The variance of will be very high and also the confidence intervals of regression coefficients will
makes the estimation of parameters unreliable. Because of these effects, multicollinearity is known as a serious problem for multiple regression(Alin 2010).
2. 2. DIAGONISTICS OF MULTICOLLINEARITY
The effects of multicollinearity can also be used for detecting the multicollinearity problem in a multiple regression. But there are many other methods for detecting multicollinearity. The mostly used basic method is to examine the correlation matrix of independent variables. High values of correlation matrix can be seen as a sign of multicollinearity. But there can still be multicollinearity even when all correlations are low. The determinant and eigenvalues of correlation matrix can also be used to detect multicollinearity as a simple method. When the determinant and the smallest eigenvalue is closed to zero, then multicollinearity can be exist. Furthermore, some other most common and useful diagnostics of multicollinearity are; Variance inflation factors (VIF) and Condition number (K).
Variance inflation factor is a very popular diagnostic for detecting multicollinearity. VIF’s are the diagonal elements of the inverse of ( ′ ) matrix when the variables are standardized. Otherwise it can be formulate as;
= 1 − for = 1, … , (5)
where, is the multiple coefficient of determination in a regression of the i th independent variable on all other independent variables. If any of is higher than 10, multicollinearity exists in data and if any of is higher than 30, it is assumed that a strong multicollinearity exists in data (Gujrati 2004).
Another diagonistic for multicollinearity is condition number or condition index which is derivatived from the eigenvalues of correlation matrix. The condition number( ) is defined as the ratio of the largest eigenvalue to the smallest eigenvalue. Thus it can be formulated as;
= ⁄ (6)
Generally if < 100 , there is no problem with multicollinearity, if 100 < < 1000 , there is a moderate multicollinearity and if is higher than 1000, there is a strong multicollinearity between independent variables. The square root of is known as condition index. √ around 10-30 states to moderate multicollinearity and higer values states to strong multicollinearity(Belsley 1991).
Because multicollinearity causes serious problems in estimating the regression coefficients, it is important to find different methods to deal with it. Ridge regression which propsed by Hoerl and Kennard (1970) is a well known method used in the case of multicollinearity.
3. 3. RIDGE REGRESSION
The main idea of ridge regression is based on adding a constant to the diagonal of ′
Matrix. This constant is known as ridge parameter (k). Therefore the parameter estimator of ridge regression is given as;
= ( ′ + ) ′ (7)
where k is a non-negative constant. When k=0 the ridge regression gives the same estimation with OLS method. As k increases the ridge regression gives biased
estimations but these estimators have smaller variance then OLS estimators. The mean square error of is given as;
= +
p i p i i i i i k k k 1 1 2 2 2 2 2 ) ( ˆ (8)where, is the ith eigenvalue of ′ matrix and is OLS estimator of . It is clear that the first term of the sum given in equation (8) is a decreasing function of k and the second term is an increasing function of k (El-Dereny and Rashwan 2011).
3.1. Determining The Ridge Parameter
The most important case in ridge regression is determining the ridge parameter. Researchers have been suggested different methods for determining k. Fistly, Hoerl and Kennard(1970) suggested Ridge Trace for determining k. Ridge trace is an easily applicaple method. It is obtained by plotting ’s versus k values which are usually taken in the interval of [0,1]. While k increases the values of ’s will stabilize. And k can be chosen as the smallest value which stabilizes all the ’s. Hoerl et al.(1975) suggested another method fo determining ridge parameter.. According to the method k can be taken as;
ˆ ˆˆ 2 p k (9)
where, p is the number of independent variables. and ˆ are the estimations which are obtained from OLS estimation. Based on this estimation, Hoerl and Kennard suggested an iterative method for determining the ridge parameter. According to this method, iteration starts from a point as;
ˆ ˆˆ 2 0 p k (10)
And k ’s can be calculated from equation (11).i
1 1
2 ˆ ˆ ˆ i R i R i k k p k (11) Note that; the inequalities which are given in (12) and (13), are available for this iteration procedure.
ˆR ki
ˆR
ki
ˆR
ki1
ˆR
ki1
, i1,2,... (12) ,... 2 , 1 , 1 k i ki i (13)The changes in the values of k , is used to terminate the iteration procedure. Such that;i the iteration will stop, if;
1 1 i i i k k k (14)
where, is a constant which have small enough and positive value. And then, ˆR
ki can be used as the estimation of . Otherwise the procedure will continue until the inequality in 14 will be provided. The terminating rule can be shown in terms of
i R k ˆ as;
2 1 1 1 1 ˆ ˆ i R i R k k (15)The iteration procedure will stop when the percentage of reduction in ˆR
ki values is higher than 2 1 1 1 and ˆR
ki estimation can bu used as the eventual estimation of . Hoerl and Kennard(1976) suggested a method for choosing . According to theirsimulation studies, can be chosen as;
30 , 1 20 T (16) where;
p X X trT (Montgomery and Peck 1992).
4. 4. RESULTS
The multiple regression model which was built for investigation of the factors influencing demand for automotive industry, is given as;
n i X X X X X X Yi 0 1 i12 i2 3 i3 4 i4 5 i5 6 i6 i , 1,2,...,
where, Y: the amount of car production, X : population,1 X : total lenght of2
highways(km), X : traffic accidents,3 X : Gross national income (GNİ) per capita,4
5
X : avarage price of cars, X : petrol price. The results of multiple regression analysis6
are given in table 1 and table 2.
Table 1. Anova table of multiple regression model
Model S. S. df M S F p val.
Regression 0,910 6 0,152 23,467 0,00
Errors 0,090 14 0,006
From the table 1, model is significant at a level less than 0.05 (p value < 0.05). As a result, there exists a statistically significant trend between dependent variable and independent variables.
Table 2. Summary statistics for multiple regression Model Standardized Coefficients
t p val. VIF Std. Error 1,155 0,363 3,181 0,007 20,424 0,841 0,290 2,897 0,012 13,037 -1,512 0,480 -3,148 0,007 35,691 0,950 0,282 3,365 0,005 12,353 -0,113 0,122 -0,922 0,372 2,308 -0,261 0,178 -1,469 0,164 4,903 R Square( ) = 0,910
From the table 2, it is seen that, individual parametersfor and are insignificant. That paradox between F ant t tests would point out the presence of multicollinearity. The correlation matrix (XX ) is given below to invastigate the basic diagnostic of multicollinearity. 1,00000 0,26289 -0,63982 0,82121 71229 , 0 0,76142 0,26289 -1,00000 0,32696 0,03141 -39501 , 0 0,08482 0,63982 0,32696 1,00000 0,73576 25517 , 0 0,87929 0,82121 0,03141 -0,73576 00000 , 1 0,80515 0,92623 71229 , 0 39501 , 0 25517 , 0 0,80515 1,00000 0,58728 0,76142 0,08482 0,87929 0,92623 0,58728 1,00000 X X
The determinant and eigenvalues of the matrix are calculated as; Det
XX
0,000301,
1
3,888 2 1,473 3 0,3994 0,181 5 0,039 6 0,018. As it is seen in the matrix, the determinant and the smallest eigenvalue is closed to zero, the correlation
between and is closed to 1 and also the correlations between - , - and - are high enough to be interpreted as a sign of multicollinearity. To make a definite decision, the VIF’s and condition number must be investigated. VIF’s can be seen in table 2 and condition number is calculated as 212,01 from the eigenvalues. According to 3th VIF value and condition number a problem of multicollinearity exist in data ( VIF > 30, > 100 ). We applied ridge regression to eleminate this problem. First step of ridge regression is to determine ridge parameter. The ridge trace plot which calculated in the interval of [0, 0.3] is given in figure 1.
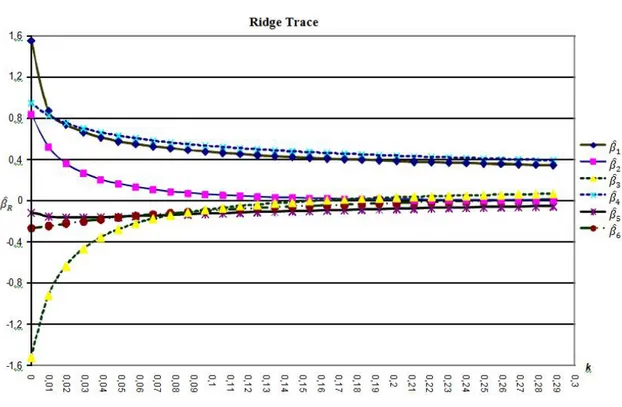
Note that, the point k=0,05 stabilizes all parameters except . That point might be thought as the wrong choice for k on first sight. Because k must be chosen as a value which stabilizes all parameters. So that point can be seen as an incorrect choice for k. It is clear that all parameters exactly become paralel to x-axis at point: k=0,13. But there can be found a smaller value of k from the plot. So k should be chosen as 0,08. Because all parameters become almost paralel at that point, and the smaller value of k should be preferred. The VIF values , , condition numbers and MSE of model should be considered while interpretting the ridge trace, because of these contradictions. These statistics are given in table 3.
Figure 1. Ridge Trace Plot
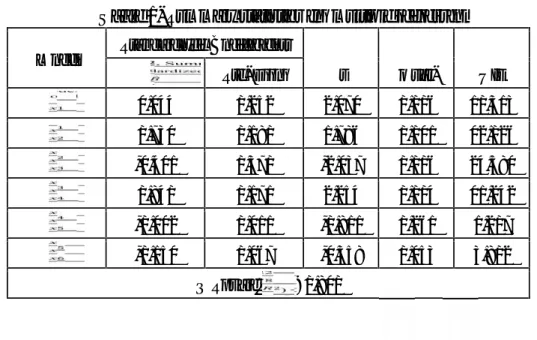
Table 3. Statistics for k values of Ridge Trace
k VIF VIF VIF VIF VIF VIF K MSE
0,05 7,5812 4,8457 9,8717 5,7511 1,7084 3,4900 57,62 0,81 0,013 0,08 5,6603 3,7057 6,9496 4,4280 1,5525 3,0404 40,35 0,79 0,014 0,13 4,0323 2,7475 4,6881 3,2465 1,3707 2,5255 27,08 0,76 0,016
According to the table 3, best choice for k is 0,05. Because, all of these statistics shows; the problem of multicollinearity is eleminated and the model with k=0,05 has higher and minimum MSE between these three values.
The ridge parameter calculated as 0,007 by the method which proposed by Hoerl et al.(1975). Another method of determining the ridge parameter is the iterative method of Hoerl and Kennard(1976). The terminating rule is determined by two different ways. First, which is used in the terminating rule, was chosen as 0,03 as a rule of thumb and then calculated from the equation 16, as = 0,603. And k calcuated as 0,0277 for = 0,03 and 0,0162 for = 0,603. The steps of iteration are given in table 4.
Table 4. Iteration steps of Hoerl and Kennard method Step ki 1 1 i i i k k k 0 5,3116 0,007 _ 1 3,1366 0,0123 0,757 2 2,392 0,0162 0,301 3 2,0063 0,0193 0,187 4 1,7905 0,0216 0,105 5 1,6716 0,0231 0,095 6 1,5680 0,0247 0,043 7 1,5216 0,0254 0,041 8 1,4778 0,0262 0,040 9 1,4368 0,0269 0,037 10 1,3981 0,0277 0,029
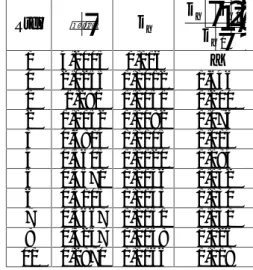
The results for determined k values are given in table 5. According to the results the most suitable choice for k is 0,027. Because it has the smallest VIF’s and condition number is under the upper limit( < 100). and MSE are acceptable values for the model. For other k values condition number (K) diagnostic shows that, the problem of multicollinearity can’t be eleminated exactly.
Table 5. Statistics for k values
k VIF VIF VIF VIF VIF VIF K MSE
0,007 16,137 10,193 25,971 10,571 2,1419 4,5947 153,72 0,89 0,008 0,0162 12,825 8,0689 19,173 8,9169 1,9997 4,2739 113,04 0,85 0,010 0,0277 10,314 6,5036 14,484 7,4852 1,8754 3,9555 85,05 0,83 0,011
5. DISCUSSION
The most common problem of ridge regression is determining the ridge parameter(k). There are many methods for determining k. In this study, we tried to show that; ridge parameter must be chosen very attentively. The basic method for determining ridge parameter is known as ridge trace. İt is shown that, ridge trace method must be interpretted carefully. If the researcher decide the value of the ridge parameter from the ridge trace plot, without investigating the statistics of the model, k should be chosen as a
wrong value as shown in the results section. The results of the method suggested by Hoerl et al.(1975) and the iterative method of Hoerl and Kennard(1976) are investigated in the results section too. It is shown that, the non-iterative method was not sufficient to solve the problem of multicollinearity. The iterative method was more succesful and useful than the non-iterative method when the terminating rule of iteration was determined appropriately. But it is not very easy to determine it appropriately. According to the results of this study; the best results to solve the multicollinearity problem was obtained by using ridge trace plot in ridge regression. Another important point is that; application of this method is more easily than others. But it is important that, the ridge trace plot and the statistics of the model must be interpretted as a whole to make the right decision.
REFERENCES
Alin, A., (2010), Multicollinearity, WIREs Comp. Stat. 2010 2 370–374 DOI: 10.1002. John Wiley & Sons, New York
Belsley DA., (1991), Conditioning diagnostics collinearity and weak data in regression, New York: John Wiley & Sons.
El-Dereny, M. And Rashwan,N.I., (2011), Solving Multicollinearity Problem Using Ridge Regression Models, Int.J.Contemp. Math.Sciences, Vol.6, No.12:585-600
Gujrati, D. N., (2004), Basic econometrics, 4th edition, Tata McGraw-Hill, New Delhi. Hoerl, A. E. and Kennard, R. W., (1970), Ridge regression: Biased estimation for nonorthogonal problems, Technometrics, 12: 55-67
Hoerl, A. E. and Kennard, R. W., (1976). Ridge regression: Iterative estimation of biasing parameter, Commun. Stat.- Theo. Meth, 5: 77-88.
Hoerl, A. E., Kennard, R. W. and Baldwin, K. F., (1975), Ridge regression: some simulations, Commun. Stat.-Theo. Meth., 4: 105-123.
Marquardt, D.W. and Snee, R.D., (1975), Ridge Regression in practise, The American Statistician, Vol.29, No.1.
Montgomery, D.C. and Peck, E.A., (1992), Introduction to Linear Regression Analysis, 2nd ed, John Wiley and Sons, New York.
Sinan, A., (2003), Ridge Estimation in Linear Regression and an application, Master’s Thesis, Graduate school of Natural and Applied Sciences, Dep.of Statistics, Konya