Health Sciences
ABSTRACT
Objective: This study was conducted to determine of nutritional intake and dietary behaviors in overweight/obese and non-obese university students.
Methods: The sample of this descriptive comparative study consisted of 220 students randomly selected among the university students who were divided into two groups as overweight / obese and non-obese. Data were collected using a daily nutrition log, anthropometric measurements and questionnaire.
Results: Of the 220 students admitted to our study, 110 were overweight/obese and 110 were non-obese. Obesity was correlated with the reason for skipping meals, smoking, amount of physical activity (p<0.05). Overweight/obese students have a high scores of Perceived Health Status scale and a low Self-Efficacy to Regulate Eating Habits scale (p=0.00). The scores of the Health Promotion Lifestyle Profile Nutrition scale and the Perceived Health Status scale of the non-smoking students were significantly high (p<0.05). The Health Promotion Lifestyle Profile Exercise scale was significantly higher in the students with high frequency of physical activity (p=0.00). Overweight/obese students had high daily energy, fat, cholesterol, and sodium intake, while all students consumed insufficient amounts of key nutrients like fiber, folate, and calcium (p=0.00).
Conclusions: These results emphasize the need to provide students health promotion programs should be implemented at universities to and raise young people’s awareness about making healthy choices that will affect their future.
Keywords: Nutrition, obesity, university students
Ayse Dost ¹ , Melek Nihal Esin ² , Hilal Hizli Guldemir ³ 1 Nursing Department; Health Sciences Faculty, Istanbul Medipol University, İstanbul. 2 Public Health Nursing Department; Florence Nightingale Nursing Faculty, İstanbul.
3 Nutrition and Dietetics Department; Health Sciences Faculty, Kutahya Health Sciences University, Kutahya, Turkey. Correspondence Author: Ayse Dost
E-mail: [email protected]
Received: 15.06.2020 Accepted: 26.10.2020
Comparison of Nutritional Intake and Dietary Behaviors in
Overweight/Obese and Non-Obese University Students: A
School-Based Study
1. INTRODUCTION
Attending university is a time marked by many important changes in a young person’s life, such as the first separation from family, a new education environment, and the transition to real life. Difficulties adapting during this period also lead to changes in one’s personal life, professional education, and health behaviors. A young person’s health attitudes and behaviors affect the individual themselves specifically, as well as their family and the community in general. For these reasons, reaching the younger population, which represents a key section of society that can easily adopt healthy behaviors, gains even more importance (1-4).
University life is also among the most risky periods in terms of acquiring negative health behaviors. Studies indicate that poor dietary habits such as consuming large amounts of fast food and low amounts of fruits and vegetables and skipping breakfast are common among young adults, 80% of the students had irregular eating patterns and half of the students ate two main meals a day. Students who engage
in such behaviors are at increased risk of weight gain and development of noncommunicable diseases (NCD) in the future (2, 5-11).
For individuals to be able to acquire healthy dietary habits, it is first necessary to examine their healthy dietary and exercise behaviors and evaluate cognitive factors such as how they perceive their own health and how important they consider health (12).
Although there are studies in the literature on the dietary or lifestyle habits of university students, few have included a detailed analysis of students’ daily food and beverage consumption using a scientific and reliable dietary program and offered suggestions to improve nutrition levels. The present study was conducted to determine of nutritional intake and dietary behaviors in overweight/obese and non-obese university students.
2. METHODS
2.1. Study Design and Setting
This comparative descriptive study was conducted at a university in Istanbul, Turkey between January and February 2020. Approval of the Istanbul Medipol University Non-Interventional Research Ethics Committee (10840098-604.01.01-E.5011) and written permission from the institution were obtained before the study. The consent form given to participants by the researchers provided sufficient explanation of the objective and contents of the study, usability of study results, anonymity, protection of personal information, and possible benefits, and stated that there were no potential disadvantages from participating in the study. The participants were instructed to fill out a self-reported questionnaire. After explaining in detail that all data would be stored by the researcher and not shared with any third parties, written informed consent was obtained from the students and all data were secured.
2.2. Participants
The study universe comprised 5451 students studying at a foundation university and enrolled in a formal education program. The sample of this descriptive comparative study consisted of 220 students randomly selected among the students who were divided into two groups as overweight / obese (110 students) and non-obese (110 students), taking into account their body mass index (BMI) [BMI ≥25: overweight / obese; BMI <25: non-obese] who applied to a health screening at university.
2.3. Measures
A data collection tool consisting of 3 parts was used in this study. The first part included questions regarding the students (age, sex, income, tobacco use, daily water consumption, physical activity level) and their body mass index (BMI) calculated from height and weight values obtained by measuring by researchers; the second part included the daily nutrition log, and the third part included assessments of healthy eating behaviors and cognitive factors: Perceived Health Status Scale, Importance of Health Scale, Nutrition and Exercise Scales of the Health-Promoting Lifestyle Profile (HPLP) and Self-Efficacy to Regulate Eating Habits Scale (13-15).
2.4. Data Analysis
Data were analyzed using SPSS (Statistical Package for Social Sciences) for Windows 22.0 software and the basic version of the BeBIS 8.0 program. Normal distribution of data were tested by Shapiro-Wilk. Number, percentage, mean, and standard deviation were used as descriptive statistical methods. Independent Samples Student’s t-Test was used for pairwise group comparisons and One-Way ANOVA with Scheffe or Tamhane’s tests was used for the comparisons
between more than two groups. Relationships between grouped variables were evaluated using chi-square analysis. BeBIS 8.0 is a program that analyzes the content of food consumed in Turkish society. The foods and measures used in the program were based on the consumption in the Turkish population. All food (and drinks) consumed are recorded in this software and the individual’s daily consumption of energy, macro – and micronutrients, fiber, and cholesterol can be determined. The program has been used in numerous studies conducted by dietitians and researchers (16). Before entering data into the software, the age and sex tab specific to each individual was selected. The individual’s daily intake was then entered and the ingredients of the food and their amounts were derived using standard recipes. From this, each individual’s average daily intake of energy, protein, carbohydrate, fat, fiber, and nutrients was determined. The daily nutrition logs were entered into the BeBIS program by two specialists familiar with the software to prevent data entry errors.
3. RESULTS
The overweight/obese students in the study had a mean BMI of 29.19±2.32 (25.40–34.30) kg/m2 and mean age of
19.25±1.47 (18–28) years; the non-obese students had a mean BMI of 22.20±2.00 (18.50–24.60) kg/m2 and mean
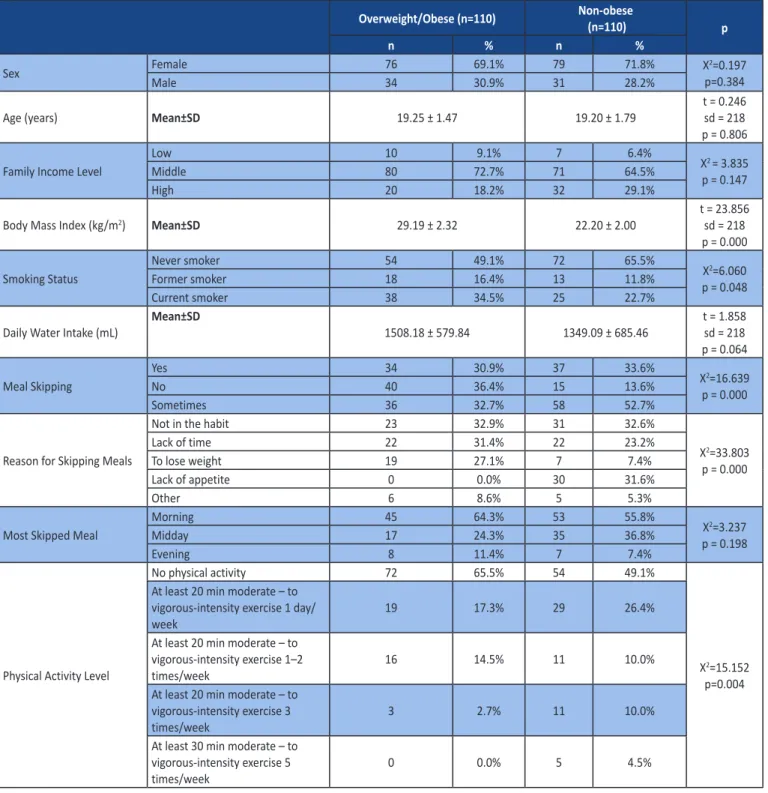
age of 19.20±1.79 (17–29) years. Of the overweight/obese students, 69% were female and 72.7% were at the middle-income level; of the non-obese students, 71.8% were female and 64.5% were middle-income. Current smokers comprised 34.5% of the overweight/obese group and 22.7% of the non-obese group. The proportion of students who stated they engage in no physical activity was 65.5% in the overweight/ obese group and 48.2% in the non-obese group (Table 1). When asked about skipping meals, 30.9% of the overweight/ obese students responded “yes” and another 32.7% responded “sometimes”. The reason cited for skipping meals was not being in the habit for 32.7%, not having time for 29.1%, and wanting to lose weight for 27.3%; 63.6% stated that they most often skip breakfast (Table 1).
Among the non-obese students, 34.5% stated “yes” to the question of skipping meals, while 51.8% responded “sometimes”. Reason cited for skipping meals was not being in the habit for 30.0%, lack of appetite for 27.3%, and wanting to lose weight for 7.3% of this group; 57.3% stated that they most often skip breakfast (Table 1).
There were no significant differences between overweight/ obese and non-obese participants in terms of sex, age, most skipped meal, or daily water intake (p>0.05). A significant correlation was observed between smoking and obesity (X2=6.060; p=0.048). The proportion of current and former
smokers was higher among the overweight/obese students compared to the non-obese students. There was also a significant correlation between obesity and skipping meals (X2=16.639; p<0.000). Skipping meals was more common
Furthermore, obesity was correlated with the reason for skipping meals (X2=33.803; p<0.000). Not being in the habit
and lack of time were more commonly cited as reasons for skipping meals by overweight/obese students compared to non-obese students, while wanting to lose weight and lack of appetite were expressed more by non-obese students than overweight/obese students.
Obesity was also found to be significantly correlated with amount of physical activity (X2=15.152; p=0.004). Higher
proportions of overweight/obese students reported doing no physical activity, engaging in at least 20 min of moderate – to vigorous-intensity exercise 1–2 times a week, and engaging in at least 20 min of moderate – to vigorous-intensity exercise 3 times a week compared to non-obese students. In contrast, more non-obese students reported engaging in at least 20 min of moderate – to vigorous-intensity exercise 1 day a week or at least 30 min of moderate – to vigorous-intensity exercise 5 times a week compared to overweight/ obese students (Table 1).
Table 1. Descriptive Characteristics of Overweight/Obese and Non-obese Students
Overweight/Obese (n=110) Non-obese (n=110) p
n % n %
Sex FemaleMale 7634 69.1%30.9% 7931 71.8%28.2% Xp=0.3842=0.197
Age (years) Mean±SD 19.25 ± 1.47 19.20 ± 1.79 t = 0.246sd = 218 p = 0.806 Family Income Level
Low 10 9.1% 7 6.4%
X2 = 3.835
p = 0.147 Middle 80 72.7% 71 64.5%
High 20 18.2% 32 29.1%
Body Mass Index (kg/m2) Mean±SD 29.19 ± 2.32 22.20 ± 2.00 t = 23.856sd = 218
p = 0.000 Smoking Status Never smokerFormer smoker 5418 49.1%16.4% 7213 65.5%11.8% Xp = 0.0482=6.060
Current smoker 38 34.5% 25 22.7%
Daily Water Intake (mL) Mean±SD 1508.18 ± 579.84 1349.09 ± 685.46 t = 1.858sd = 218 p = 0.064 Meal Skipping Yes 34 30.9% 37 33.6% X2=16.639 p = 0.000 No 40 36.4% 15 13.6% Sometimes 36 32.7% 58 52.7%
Reason for Skipping Meals
Not in the habit 23 32.9% 31 32.6%
X2=33.803 p = 0.000 Lack of time 22 31.4% 22 23.2% To lose weight 19 27.1% 7 7.4% Lack of appetite 0 0.0% 30 31.6% Other 6 8.6% 5 5.3%
Most Skipped Meal
Morning 45 64.3% 53 55.8%
X2=3.237
p = 0.198 Midday 17 24.3% 35 36.8%
Evening 8 11.4% 7 7.4%
Physical Activity Level
No physical activity 72 65.5% 54 49.1%
X2=15.152
p=0.004 At least 20 min moderate – to
vigorous-intensity exercise 1 day/
week 19 17.3% 29 26.4%
At least 20 min moderate – to vigorous-intensity exercise 1–2
times/week 16 14.5% 11 10.0% At least 20 min moderate – to
vigorous-intensity exercise 3
times/week 3 2.7% 11 10.0% At least 30 min moderate – to
vigorous-intensity exercise 5
times/week 0 0.0% 5 4.5%
HPLP: Health-Promoting Lifestyle Profile; p: Significance level; SD:Standard deviation; t: Student t-test; X2: Chi-square analysis; %: Percentage
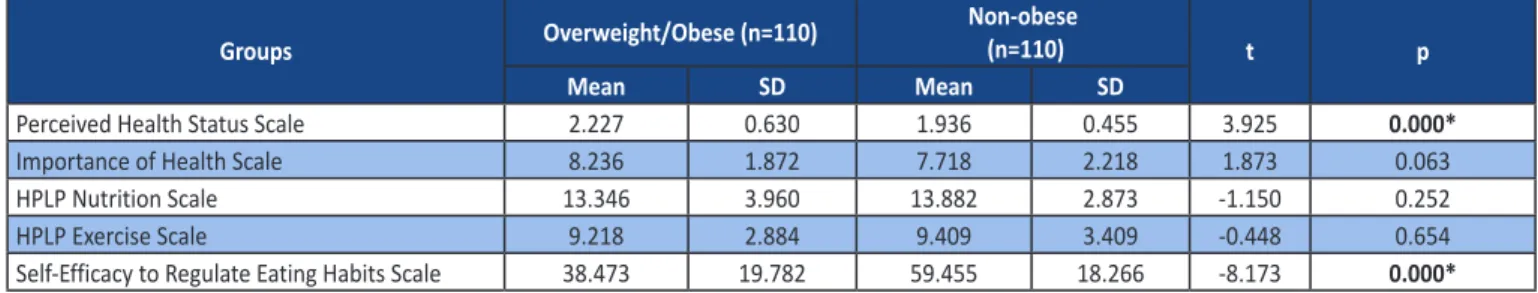
Mean score on the Importance of Health Scale was 8.23±1.87 (1–10) for the overweight/obese students and 7.71±2.21 (1–10) for non-obese students. Mean scores for the HPLP Nutrition and Exercise scales were 13.46±3.96 (6–24) and 9.21±2.88 (5–20) for the overweight/obese students and
13.88±2.87 (6–24) and 9.40±3.40 (5–20) for the non-obese students, respectively. Mean score on the Self-Efficacy to Regulate Eating Habits Scale was 49.05±18.70 (0–100) for overweight/obese students and 52.95±25.5 (30–100) for non-obese students (Table 2).
Table 3. Comparison of the Nutrition Behaviors of Students Perceived Health
Status Scale Importance of Health Scale HPLP Nutrition Scale HPLP Exercise Scale Self-Efficacy to Regulate Eating Habits Scale
Variables n Mean±SD ValueTest Mean±SD ValueTest Mean±SD ValueTest Mean±SD ValueTest Mean±SD ValueTest Sex Female 155 2.07±0.55 t=-0.417 p=0.678 8.01±204 t=0.317p=0.752 13.36±3.34 t=-1.155p=0.268 9.14±3.08 t=-1.223p=0,224 48.25±21.28 t=0.317p=0.752 Male 65 2.11±0.62 7.91±2.13 13.95±3.66 9.73±3.33 50.71±22.78 Smoker status Never smoker 126 2.00±0.57 F=3.465 p*=0.033 8.10±1.92 F=0.419 p=0.658 14.13±3.50 F=5.369 p*=0.005 9.33±3.20 F=0.214 p=0.808 50.17±19.00 F=0.587 p=0.557 Former smoker 30 2.30±0.47 7.80±2.34 13.32±3.15 9.53±2.34 45.66±26.35 Current smoker 64 2.11±0.57 7.86±2.23 12.42±3.20 9.10±3.38 48.10±24.55 Meal Skipping Yes 72 2.13±0.47 F=0.792 p=0.454 7.97±2.22 F=1.284 p=0.279 12.83±3.13 F=2.196 p=0.114 8.97±2.99 F=0.441 p=0.644 47.78±19.80 F=3.033 p=0.050 No 54 2.13±0.63 8.32±1.79 13.67±4.23 9.37±3.43 43.7±21.84 Sometimes 94 2.03±0.59 7.76±2.08 13.95±3.11 9.40±3.02 52.72±22.77
Physical Activity Level
No physical activity 125 2.13±0.55 F=2.396 p=0.051 7.69±2.22 F=2.956 p=0.061 13.27±3.25 F=0.998 p=0.410 8.31±.2.83 F=12.439 p*=0.000 48.02±21.88 F=2.090 p=0.752 At least 20 min moderate – to vigorous-intensity exercise 1 day/week 46 2.15±0.56 8.22±1.78 13.56±3.87 9.74±2.53 50.00±21.66 At least 20 min moderate – to vigorous-intensity exercise 1–2 times/ week 27 2.00±0.62 9.07±1.33 13.48±3.56 10.07±2.45 42.96±19.38 At least 20 min moderate – to vigorous-intensity exercise 3 times/ week 14 1.71±0.47 7.86±1.92 14.64±2.92 12.29±3.07 60.71±23.36 At least 30 min moderate – to vigorous-intensity exercise 5 times/ week 8 1.80±0.45 7.20±2.77 15.60±4.82 14.20±5.12 62.00±22.80
* p<0.05; F: One way AN OVA testi; HPLP: Health-Promoting Lifestyle Profile; SD:Standard deviation; ; t: Student t-test
Table 2. Comparison of the Nutrition Behaviors of Overweight/Obese and Non-obese Students
Groups Overweight/Obese (n=110) Non-obese (n=110) t p
Mean SD Mean SD
Perceived Health Status Scale 2.227 0.630 1.936 0.455 3.925 0.000*
Importance of Health Scale 8.236 1.872 7.718 2.218 1.873 0.063 HPLP Nutrition Scale 13.346 3.960 13.882 2.873 -1.150 0.252 HPLP Exercise Scale 9.218 2.884 9.409 3.409 -0.448 0.654 Self-Efficacy to Regulate Eating Habits Scale 38.473 19.782 59.455 18.266 -8.173 0.000*
Mean score for Perceived Health Status was higher in overweight/obese students (x̄=2.227) than non-obese students (x̄=1.936) (p<0.000). Mean Self-Efficacy to Regulate Eating Habits Scale score was higher in of non-obese students (x̄=59.455) compared to overweight/ obese students (x̄=38.473) (p<0.000). Importance of Health Scale score and HPLP Nutrition and Exercise Scales scores were not associated with obesity status (p>0.05) (Table 2).
The HPLP Nutrition scale scores of non-smoking students were found significantly higher than smoking students (p<0.01). Perceived Health Status scale scores of the students who participated in the “I used but quit smoking” option (x=2.30±0.47) were found to be significantly higher (p<0.05) than all other groups (Table 3).
The HPLP Exercise scale scores of the students who “exercised at least 30 minutes of moderate to severe intensity 5 times a week” (x=14,20±5,12) were found to be significantly higher (p<0,01) than all other groups (Table 3).
In the overweight/obese group, the mean daily energy intake was 2540.96 kcal, 54.00%±8.33% of which came
from carbohydrates, 20.00%±4.18% g from protein, and 26.00%±6.98% g from fat. In the non-obese group, mean daily energy intake was 1357.98 kcal, with 45.20%±11.01% g of this amount from carbohydrates, 16.50%±4.32% g from protein, and 38.12%±8.93% g from fat (Table 4).
Daily energy intake was significantly higher in overweight/ obese students (x̄=1940.916 kcal) than non-obese students (x̄=1357.986 kcal) (p<0.000). The overweight/obese students also had significantly higher intake of protein (x̄=72.977 g), fat (x̄=80.238 g), carbohydrates (x̄=227.119 g), fiber (x̄=20.026 g), cholesterol (x̄=365.598 mg), vitamin A (x̄=1435.077 mcg), vitamin E (x̄=13.455 mg), vitamin B1 (x̄=0.880 mg), vitamin B2 (x̄=1.364 mg), vitamin B6 (x̄=1.235 mg), folate (x̄=288.938 mcg), vitamin C (x̄=105.310 mg), potassium (x̄=2484.272 mg), calcium (x̄=829.160 mg), magnesium (x̄=279.664 mg), phosphorus (x̄=1146.681 mg), iron (x̄=11.025 mg), and zinc (x̄=10.050 mg) when compared with non-obese students (p=0.002 for vitamin A, p<0.000 for others).
There were no significant differences between the groups in protein, fat, and carbohydrate percentages or sodium intake (p>0.05) (Table 4).
Table 4. Daily Nutritional Intake of the Students
Food groups Overweight/Obese (n=110) Non-Obese (n=110) t p
Mean Standard deviation Mean Standard deviation
Energy (kcal) 2533.15 648.328 1357.986 428.827 7.865 0.000* Protein (g) 122.800 29.781 54.548 20.256 5.366 0.000* Protein (%) 20.000 4.188 16.500 4.328 -1.757 0.080 Fat (g) 74.800 29.659 57.877 23.155 6.233 0.000* Fat (%) 26.000 6.983 38.127 8.939 -1.000 0.318 Carbohydrates (g) 334.160 91.961 151.106 62.433 7.172 0.000* Carbohydrates (%) 54.000 8.332 45.209 11.011 1.636 0.103 Fiber (g) 16.820 9.092 14.059 6.122 5.710 0.000* Cholesterol (mg) 365.598 199.348 245.525 162.473 4.897 0.000* Vitamin A (mcg) 1435.077 2164.200 770.037 480.741 3.146 0.002* Vitamin E (mg) 13.455 7.579 8.530 4.419 5.888 0.000* Thiamine (mg) 0.880 0.351 0.626 0.237 6.286 0.000* Riboflavin (mg) 1.364 0.605 0.960 0.495 5.418 0.000* Pyridoxine (mg) 1.235 0.486 0.914 0.377 5.476 0.000* Folate (mcg) 288.938 118.610 212.345 95.938 5.266 0.000* Vitamin C (mg) 105.310 65.186 74.191 48.094 4.029 0.000* Sodium (mg) 4555.310 6984.760 3423.699 5000.842 1.382 0.169 Potassium (mg) 2484.272 940.196 1794.873 590.162 6.514 0.000* Calcium (mg) 829.160 313.191 601.419 259.248 5.875 0.000* Magnesium (mg) 279.664 105.486 204.016 73.590 6.169 0.000* Phosphorus (mg) 1146.681 462.009 836.188 313.958 5.830 0.000* Iron (mg) 11.025 5.108 7.695 2.754 6.018 0.000* Zinc (mg) 10.050 4.040 7.958 3.138 4.289 0.000* *: p<0.05; t: Student t-test
4. DISCUSSION
In this study comparing nutrient intake and dietary behavior of overweight/obese and non-obese university students, we aimed to determine the amount of macro – and micronutrients consumed by obese students. We found that the energy intake of overweight/obese students exceeded the amount consumed by non-obese students and the recommendations stated in the Dietary Guidelines for Turkey (DGT). In the literature, the energy intake of obese individuals was reported as 2229 kcal/day in a study conducted in Brazil, 3056 kcal/day in a similar study conducted in Portugal, and 1745 kcal/day in a study conducted in Chile. At 2535 kcal/ day, the energy intake of the obese individuals in our study group was lower than that of obese individuals in Portugal and higher than that of Brazilian and Chilean individuals (17). The recommended ratios of daily energy intake from carbohydrates, protein, and fats are 50%–60%, 10%–15%, and 25%–30%, respectively. In both groups in our study, the proportion of daily energy intake from carbohydrates was too low, whereas energy intake from fat was too high. Numerous studies have yielded results similar to our findings (6, 18-20). These students’ high fat intake may be related to their consumption of convenience foods such as fast food and chips. Due to reports that consuming a diet high in fat is associated with heart disease, it is not recommended to have more than 30% of daily energy intake from fats (21).
In the present study, cholesterol intake was higher in overweight/obese students compared to non-obese students and DGT recommendations. High cholesterol levels were shown to be strongly associated with cardiovascular disease and are a risk factor for arteriosclerotic disease (22). Consistent with our study, Llanaj et al. also reported high cholesterol intake among overweight/obese university students (6).
Daily intake of vitamins B2, C, and E, iron, and zinc levels of the non-obese students in our study was lower than DGT recommendations. Riboflavin (vitamin B2) deficiency leads to hair loss and lesions of the skin and oral/tongue mucosa. Vitamin E deficiency causes muscle weakness and lethargy. Vitamin C deficiency may lead to a weakened immune system, fatigue, irritability, and muscle pain, and vitamin C is necessary for brain and nervous system function. Zinc deficiency causes immune dysfunction, hair loss, dermatitis, changes in skin structure, and delayed wound healing (20). Iron deficiency may lead to problems such as anemia, anorexia, fatigue, disruptions in epithelial tissue, and pallor (21). Based on these data, students can be advised to consume lean red meat, white meat, fish, and eggs, as well as legumes, nuts, and greens as sources of iron and zinc. Moreover, increasing vitamin C consumption alone can enhance absorption of folic acid, vitamin E, calcium, and iron, which were also found to be insufficient in our students (19). The best source of many vitamins is fresh fruits and vegetables, and an adequate and balanced diet can provide all necessary vitamins (21).
When we evaluated daily nutrient intake, we observed that students in both groups had insufficient intake of fiber, vitamin B1, vitamin B6, folate, potassium, calcium, and magnesium. Researchers also reported in their studies on university students that all students had low fiber, vitamin B1, folate, calcium, and magnesium intake (6, 19, 20, 23). Dietary fiber plays a role in the prevention of conditions such as cardiovascular disease, cancer, and diabetes. Students should increase their consumption of legumes, which have high fiber content, as well as whole wheat products, fresh vegetables, and fruit (22). Nausea, muscle atrophy, and digestive system disorders are observed in vitamin B1 deficiency, while cracked skin, nerve inflammation, and migraines may be observed in vitamin B6 deficiency. Insufficient magnesium intake affects neuromuscular, cardiovascular, and renal systems and is associated with diabetes and hypertension. Low intake results in anorexia, nausea, tachycardia, and muscle weakness (22). Intake of calcium, an important mineral for bone health, was found to be insufficient in the present study and numerous others. Insufficient calcium intake in adolescence and young adulthood is an important risk factor for osteoporosis later in life (20).
In both groups of our study, students’ intake of vitamin A, sodium, and phosphorus was higher than DGT recommendations. Garipagaoglu et al. also reported that all students in their study had higher than recommended intake of sodium and phosphorus. The high phosphorus intake may result from excessive consumption by students living in student housing/dormitories (20). Excess sodium can increase the risk of heart diseases, hypertension and stroke, and may lead to kidney damage (22). Llanaj et al. also observed high sodium intake among the overweight/obese students in their study, similar to our findings (6).
In this study, a significant correlation was observed between smoking and obesity. The proportion of current and former smokers was higher among the overweight/obese students compared to the non-obese students. Similarly, in a cross-sectional study examining the relationship between body mass indexes and eating habits of university students, a significant relationship was found between students’ smoking status and the risk of obesity / overweight(23). According to previous studies, smoking behavior is associated with an increase in fast-food, reduced intake of healthy food components, and adoption of a sedentary lifestyle, all contributing to weight gain(23).
Furthermore, obesity was correlated with the reason for skipping meals. Not being in the habit and lack of time were more commonly cited as reasons for skipping meals by overweight/obese students compared to non-obese students, while wanting to lose weight and lack of appetite were expressed more by non-obese students than overweight/ obese students. Frequent consumption of fast-food has been associated with increased BMI and body fatness in children and adults. Eating regular meals may prevent snacking of energy-rich unhealthy foods between meals.
Obesity was also found to be significantly correlated with physical activity level. Higher proportions of overweight/ obese students reported doing no physical activity, engaging in at least 20 min of moderate – to vigorous-intensity exercise 1–2 times a week, and engaging in at least 20 min of moderate – to vigorous-intensity exercise 3 times a week compared to non-obese students. In contrast, more non-obese students reported engaging in at least 20 min of moderate – to vigorous-intensity exercise 1 day a week or at least 30 min of moderate – to vigorous-intensity exercise 5 times a week compared to overweight/obese students. Similarly, in a study by Konal Korkmaz et al., physical activity levels of overweight and obese students were found to be lower than those of normal weight students (24). Some studies show that physical activity level decreases throughout the period students graduate from high school and move on to college (25).
The overweight/obese students in our study had higher Perceived Health Status scale scores than the non-obese students. However, this suggests that overweight/obese students might show a tendency to shift towards higher levels of obesity because they may not be aware of the effects of excess weight on health; therefore, this may be the ideal timing to warn these students and involve them in a health promotion program. It is believed that individuals with a realistic perception of their health status will pay attention to healthy eating behaviors and will assume the necessary responsibility in preventing obesity.
The non-obese students in our study had higher Self Efficacy to Regulate Eating Habits Scale scores compared to the overweight/obese students. In the literature, a stronger sense of self-efficacy has been associated with better health, greater achievement, and better social integration. Turning the negative experiences of overweight/obese students into positive ones requires helping the individual to determine realistic goals and set targets, followed by the individual monitoring changes in the behaviors identified together. This will increase their self-efficacy in regulating healthy eating behavior (14).
Importance of Health Scale score and HPLP Nutrition and Exercise scales scores were not associated with obesity status. Contrary to the findings of the research, in the studies of Tedik and Hacıalioğlu, Konal Korkmaz and their friends, a relationship was found between the obesity status of the students and the physical activity and nutrition scale scores of the students, and the scores of the obese students were lower than the other students (24, 26).
HPLP Nutrition Scale scores of non-smoking students were found to be higher than other students. Similarly, in the studies of Özkan and Yılmaz, Cihangiroğlu and Deveci, the Nutrition Scale score of non-smoking students was higher than other students (27, 28).
The Perceived Health Status scale score of non-smoking students was found to be higher than other students. In the study conducted by Taşpınar et al., Parallel to the findings
of the research, individuals who smoke were perceived their health more negatively and their fatigue levels were found higher than non-smokers (29). It can be said that as the importance given to health increases, individuals develop positive behaviors to increase their well-being potential, and they adopt and apply health-enhancing behaviors more for a healthy life (30).
HPLP Exercise Scale scores of the students who exercised at least 30 minutes of moderate-intensity intensity 5 times a week were found to be significantly higher than all other groups. Similarly, in the study conducted by Alkan et al. with university students, the HPLP Exercise Scale scores of the students with high physical activity level were found to be higher than the other groups (31). In the study of Yalcinkaya et al., The group who exercised 3-4 days or more a week got higher scores in all sub-dimensions of physical activity and overall total (32).
Strengths and Limitations
Strengths of this study are that it focused on the evaluation and comparison of overweight/obese and non-obese students in terms of healthy eating habits, evaluated daily nutritional intake using the BeBIS 8.0 program, and utilized both anthropometric measurements and qualitative data collection tools.
The study was performed at a single university with 220 students selected by nonprobability sampling. Therefore, the inability to generalize our results to all students is the limitation of this study.
5. CONCLUSION
This study comparing nutrient intake and dietary behavior of overweight/obese and non-obese university students showed that overweight/obese students had high fat and cholesterol consumption. Both groups had higher than recommended vitamin A, sodium, and phosphorus intake, while fiber, vitamin B1, vitamin B6, folate, potassium, calcium, and magnesium intake was insufficient. Vitamin B2, C, and E, iron, and zinc levels were also low among non-obese students. Non-obese students had higher nutrition self-efficacy scores compared to overweight/obese students. Health promotion programs should be provided about energy requirements, essential nutrients, the food groups that provide these nutrients and their recommended amounts, balanced menu selection, nutritional problems and practical solutions, portion control, and food label literacy in order to promote adequate and balanced nutrition among university students.
Acknowledgements: We sincerely thank all of the participants
in the present study.
Funding: No funding
Availability of data and materials: National data is available
How to cite this article: Dost A, Esin MN, Hizli Guldemir H. Comparison of Nutritional Intake and Dietary Behaviors in Overweight/
Obese and Non-Obese University Students: A School-Based Study. Clin Exp Health Sci 2021; 11: 20-27. DOI: 10.33808/ clinexphealthsci.753179
REFERENCES
[1] Kliemann N, Croker H, Johnson F, Brown JB. Starting university with high eating self-regulatory skills protects students against unhealthy dietary intake and substantial weight gain over 6 months. Eat Behav 2018; 31:105–112.
[2] Ansari WE, Suominen S, Samara A. Eating habits and dietary intake: is adherence to dietary guidelines associated with importance of healthy eating among undergraduate university students in Finland? Cent Eur J Public Health 2015; 23(4): 306– 313.
[3] Tugut N, Bekar M. Relationship between university students’ perception of health and healthy lifestyle behaviors. Journal of Anatolia Nursing and Health Sciences 2008; 11(3): 17-26 [4] Straker LM, Howie E, Smith K, Fenner A, Kerr D, Olds T, Abbott
R, Smith A. The impact of Curtin University’s activity, food and attitudes program on physical activity, sedentary time and fruit, vegetable and junk food consumption among overweight and obese adolescents: a waitlist controlled trial. PLoS ONE 2014; 9: 1-11.
[5] Atlam DH, Aldemir E, Altıntoprak AE. The prevalence of risky behaviors in university students and their relationship with substance use. Dusunen Adam 2017; 30: 287-298
[6] Llanaj E, Adany R, Lachat C, Hease DM. Examining food intake and eating out of home patterns among university students. PLoS ONE 2018; 13(10): e0197874.
[7] Tanton J, Dodd JL, Woodfield L, Mabhala M. Eating behaviours of British University students: a cluster analysis on a neglected issue. Adv Prev Med. 2015; 2015: 639239
[8] Genena DM, Salama AA. Obesity and Eating habits among university students in Alexandria, Egypt: A cross sectional study.W J N H 2017; 5 (3): 62-68
[9] Hilger J, Loerbroks A, Diehl K. Eating behaviour of university students in Germany: dietary intake, barriers to healthy eating and changes in eating behaviour since the time of matriculation. Appetite 2016; 109: 100-107
[10] Çakır B. Healthy life. Ankara Med J 2017; 17: 179-188. [11] Whatnall MC, Patterson AJ, Chiu S, Oldmeadow C, Hutchesson
MJ. Determinants of eating behaviours in Australian university students: A cross-sectional analysis. Nutrition & Dietetics 2020; 77(3): 331-343.
[12] Karaca T, Aslan S. Determination of health status perceptions and healthy lifestyle behaviors of nursing students. AUHSJ 2019; 10(4): 734-739
[13] Esin MN. Determining and Improving Health Behaviors of Industrial Workers Istanbul University Health Science Institute, Doctoral Thesis. 1997.
[14] Esin MN. Adaptation of the health-promoting lifestyle profile scale to Turkish. Nurs Bull 1999; 12 (45): 87-95.
[15] Sevinç S. Argon G. Turkish validity and reliability of self-efficacy scale in the regulation of nutritional habits in heart patients. EGEHFD 2014; 30(2): 19-33.
[16] Turkey Nutrition ve Health Research (TBSA). Republic of Turkey Ministry of Health Directorate General for Health Research, Field Practice Manual: Ankara; 2010.
[17] Allen KN, Taylor JN, Kuiper R. Effectiveness of nutrition education on fast food choices in adolescents. JOSN 2007; 23(6): 337-341
[18] Gümüş E, İlktaç HY, İkiışık H, Garipağaoğlu M. Evaluation of anthropometric measurements and nutritional status of a group of morbid obese individuals in Istanbul. ESTUDAM 2019; 4(2): 143-53.
[19] Bıyıklı ET, Bıyıklı AE, Çelik B. Evaluation of energy and nutrient intakes of selcuk university medical faculty students. General Med J 2018; 28(1): 28-33.
[20] Garipağaoğlu M, Eliuz B, Esin K, Cagatay P, Nalbant H, Solakoglu Z. Evaluation of nutritional status of first-year medical students. Istanbul Med J 2012; 13(1): 1-8.
[21] Merdol Kutluay T. Collective nutrition service healthy management guide. Ankara: Hatiboğlu Publishing 2015. [22] Aksoy M. Encyclopedic nutrition and diet dictionary. Ankara:
Nobel Medikal Yayıncılık; 2018.
[23] Gunes FE, Bekiroglu N, Imeryuz N, Agirbasli M. Relation between eating habits and a high body mass index among freshman students: a cross-sectional study. J Am Coll Nutr. 2012;31(3):167-174.
[24] Konal Korkmaz E, Ardahan M, Erkin O. The relationship between healthy lifestyle behaviors and obesity in intern nursing students. SSYV 2019; 29 (3): 84-92.
[25] Karaca A, Çaglar E, Deliceoglu G, Bilgili, N. Physical activity with regard to socio-demographic variables and decisional balance perceptions for exercise among university students. JPES 2016; 16(3): 932.
[26] Tedik ES, Hacıalioglu N. Investigation of the relationship between excess weight and healthy lifestyle behaviors in nursing students. UHD 2017; 10: 59-82
[27] Ozkan S, Yılmaz E. The health-promoting lifestyles of nurses working at hospital. Firat Healt J 2008; 3(7): 89-105.
[28] Cihangiroglu Z, Deveci SE. Healthy lifestyle behaviors of Firat University Elazig Health School students and the influencing factors. Firat Med J 2011; 16(2): 78-83.
[29] Taspinar B, Gul C, Taspinar F, Aksoy CC, Afsar E. The perception of dyspnea and fatigue in young adult smokers. SDU Health Sci J 2015; 6 (1): 15-19.
[30] Ayaz S, Tezcan S, Akinci F. Health promotion behavior of nursing school students. C.U. Nurs J 2005; 9(2): 26-34.
[31] Alkan S, Ersoy N, Eskici G, Ersoy G. Assessment of eating attitudes and healthy lifestyle behaviors of females students studying nutrition and dietetics. IJND 2017; 54(1): 1-13. [32] Yalcinkaya M, Gok Ozer F, Yavuz Karamanoğlu. Evaluation of
healthy lifestyle behaviors in health care workers. TAF Prev Med Bull 2007; 6(6).