Analysis of the Wnt/B-catenin/TCF4 pathway using SAGE, genome-wide
and promoter analysis: Identi
fication of BRI3
Ersen Kavak
a,⁎
, Ayaz Najafov
a, Nuri Ozturk
b, Tuncay Seker
a, Kader Cavusoglu
a, Tolga Aslan
a,
Adil Doganay Duru
a, Tahsin Saygili
a, Gerta Hoxhaj
a, Mahmut Can Hiz
a, Durisehvar Ozer Unal
a,
Necla Birgül-
İyison
a, Mehmet Ozturk
b, Ahmet Koman
aa
Department of Molecular Biology and Genetics, Bogazici University, Istanbul, Turkey
b
Department of Molecular Biology and Genetics, Bilkent University, Ankara, Turkey
a r t i c l e i n f o
a b s t r a c t
Article history: The Wnt signaling pathway is involved in many differentiation events during embryonic development and
Received 8 March 2010 can lead to tumor formation after aberrant activation of its components. β-catenin, a cytoplasmic Received in revised form 5 May 2010 component, plays a major role in the transduction of canonical Wnt signaling. The aim of this study was to Accepted 29 May 2010
identify novel genes that are regulated by active β-catenin/TCF signaling in hepatocellular
carcinoma-Available online 9 June 2010
derived Huh7 cells with high (transfected) and lowβ-catenin/TCF activities. High TCF activity Huh7 cells led to earlier and larger tumor formation when xenografted into nude mice. SAGE (Serial Analysis of Gene
Keywords:
Expression), genome-wide microarray and in silico promoter analysis were performed in parallel, to compare
Wnt/TCF4/β-catenin targets
gene expression between low and highβ-catenin/TCF activity clones, and also those that had been rescued
HCC
BRI3 from the xenograft tumors. SAGE and genome-wide microarray data were compared and contrasted. BRI3 HSF2 and HSF2 were identified as novel targets of Wnt/β-catenin signaling after combined analysis and confirming Xenograft experiments including qRT-PCR, ChIP, luciferase assay and lithium treatment.
© 2010 Elsevier Inc. All rights reserved.
1. Introduction
The Wnt/Wingless signaling pathway is known to be important in several biological processes such as development[1], carcinogenesis
[2–4] and stem cell growth [1,5,6]. In mammals, 12 distinct Wnt families exist which induce at least 3 different pathways: Wnt/ β-catenin/TCF pathway, Wnt/Ca2+ pathway and Wnt/planar cell
polarity (PCP) pathway[1,7,8]. The Wnt/β-catenin pathway is the most established one among these pathways. β-catenin is a key regulator of the Wnt/β-catenin signaling pathway, deregulation of which was established in several tumors such as colorectal[9], liver
[10], and breast [11]. It is normally phosphorylated by CK1a and GSK3β and targeted for degradation via the ubiquitin–proteasome pathway with APC and axin acting as scaffold factors. Being able to degradeβ-catenin in the ‘off’ state of the pathway is vital for the cell to remain in its wild-type phenotype, as loss-of-function mutations in the components of the destruction complex or mutations ofβ-catenin, which renders it degradation-resistant, lead to various types of cancers [4]. Considerable amount of data indicates that these deregulations lead toβ-catenin hyperactivation that mimics active Wnt/β-catenin pathway. This may result in aberrant activation of cell
cycle mechanisms which is the major mark of tumor initiation. Tumor-correlation of the Wnt pathway renders the characterization of further Wnt targets all the more important. There are many targets already identified in different contexts such as colon and liver cancers
[12–14]. However, Wnt/β-catenin signaling seems to act through different mechanisms in colorectal and liver cancers. In colorectal cancer, the major mechanism is APC inactivation dependent, where either APC orβ-catenin is mutated in 90% of the cases. Nevertheless, in hepatocellular carcinomas (HCCs), although nuclearβ-catenin accu-mulation is observed in 33–67% of the cases, APC or β-catenin mutations are present in only 20–30%[15]. It has already been shown that expression of canonical Wnt targets such as MMP7 and cyclinD1 does not change duringβ-catenin accumulation in hepatocarcinogen-esis[16]. Further characterization of the Wnt pathway and its targets in liver cancer will provide insight into diagnostic and therapeutic processes of liver cancers as well as further general knowledge about the Wnt pathway.
The human hepatocellular carcinoma cell line Huh7 on which most of this study was performed, is well-differentiated and has an inactive Wnt/β-catenin pathway with no accumulation of endogenous β-catenin in the nucleus[17]. We show in this study that Huh7 cells transfected with mutantβ-catenin (S33Y), lead more rapidly to larger tumors in nude mice when compared to cells transfected with a control plasmid. We then pursue a genome-wide comparative screening approach by using SAGE and microarray techniques in order to identify Wnt/
β-⁎ Corresponding author. Department of Cell and Molecular Biology (CMB), Karolinska Institute, 17177, Stockholm, Sweden.
E-mail address:[email protected](E. Kavak).
0898-6568/$– see front matter © 2010 Elsevier Inc. All rights reserved. doi:10.1016/j.cellsig.2010.05.021
Contents lists available atScienceDirect
Cellular Signalling
j o u r n a l h o m e p a g e : w w w. e l s ev i e r. c o m / l o c a t e / c e l l s i g
and HSF2 as novel targets
microarray
catenin targets in hyperactiveβ-catenin expressing Huh7 cells. In order to evaluate the results, we used in silico promoter analysis as a guide. Finally, we identified BRI3 and HSF2 as novel targets of Wnt/β-catenin signaling in the liver by expression analysis, ChIP analysis, luciferase based promoter assays and lithium treatment.
2. Materials and methods 2.1. Cell lines
Cells were cultured in DMEM containing non-essential amino acids (1% v/v), penicillin–streptomycin (100 U/ml) and 10% FBS unless stated otherwise. Huh7-S33Y and Huh7-Vec: Huh7 cells were transfected with pCI-Neo-mutantβ-catenin (S33Y) expression plasmid, (kindly provided by Dr. B. Vogelstein) or with pCI-Neo vector (Promega) respectively by using the calcium phosphate/DNA-precipitation method. Transfected cells were cultivated in the presence of G-418 geneticin sulfate (500– 800μg/ml; Gibco) for selection, the resistant polyclonal pool was expanded and maintained in culture in the presence of 200μg/ml G-418. Post-tumor cells PT-Huh7-S33Y and PT-Huh7-Vec were rescued from two tumors at last time point as described below and expanded in culture up to 9 passages before RNA analysis.
2.2. Xenograft experiments
Huh7-S33Y and Huh7-Vec cells at passage 5 were cultivated in DMEM without any antibiotics for 48 h before in vivo studies. For tumor formation assay, cells were trypsinized, washed in PBS, counted and prepared in 250μl PBS for injections. Cells were injected subcutaneously and bilaterally (control on one side) into CD-1 nude mice (Charles River). Tumors at the injection sites were collected at different days post-injection to calculate tumor volume and weight, some parts were minced and recultured to obtain post-tumor cell culture samples and the rest was snap-frozen in liquid nitrogen. These experiments were approved by the Bilkent University Animal Ethics Committee.
2.3. RNA isolation, serial analysis of gene expression and microarrays Total RNA was isolated from transfected cells using the guanidine isothiocyanate method. We performed SAGE experiments with Invitrogen's I-SAGE kit (Invitrogen, San Diego, CA, USA) according to the manufacturer's instructions and EMBO's SAGE manual (2005, EMBO congress on SAGE), using 25μg of total RNA for each sample. The kit manual was followed until preparation of 100 bp ditags. After this step, some minor modifications were made as described in the EMBO's SAGE manual. Sequencing was performed using an Amer-sham 96 capillary automatic DNA sequencer.
Microarray experiments were performed in triplicates with 10μg of total RNA for each sample (except for 2 post-tumor samples which were 5μg). Affymetrix U133 2.0 Plus arrays and kits were used to prepare the labeled oligonucleotides, and an Affymetrix washing and scanning station was used to process the samples. Data analysis was done with Microsoft Excel and the GenePattern software of MIT[18]. 2.4. In silico analysis of SAGE and genome-wide microarray data
When comparing SAGE and microarray data, we considered the consensus assignments of SAGE Genie best gene mappings[19]and SAGE Map[20]tag mapping algorithms (referred to as consensus tag mapping) for SAGE tags. Unigene ID values of Affymetrix probe sets were used for microarray probe mappings. Microarray data for a certain probe set was used, when there is at least 1 present call beyond 6 samples (triplicates of 2 samples). Robust microarray analysis (RMA) macro of GenePattern software was used when merging and normalizing microarray data for 6 samples.
1883 tag mappings were obtained among 5190 tags, when consensus tag mapping was used and tags that match to multiple genes were excluded. For tags that match to the same gene, average count was considered. 1726 unambiguous SAGE tag to gene mappings remained after thisfiltering. Of these 1726 genes, 1476 were also present in microarray data. This common set of genes was used while comparing microarray and SAGE values.
2.5. In silico analysis of promoter regions
When forming the union set of genes to be used in promoter analysis for up-regulated genes, we selected the significantly up-regulated genes in SAGE (p valueb0.05 and Huh7-S33Y tags NHuh7-Vec) and excluded the ones which showed down-regulation tendency in microarray data (Huh7-S33Y signalsbHuh7-Vec). Afterwards, we chose genes from microarray data for which Huh7-S33Y/Huh7-Vec ratio is higher than 2 and excluded the ones which were down-regulated according to SAGE (Huh7-S33YbHuh7-Vec). Finally, we considered the union of these two sets, tofind the final union set of up-regulated genes. We applied the same set of rules with opposite thresholds while forming the union set of down-regulated genes.
We used a two-sided Z test in order to assess the significance of the difference of means of the control group and the test group. As the control group, we used the promoters of the genes which are not altered upon hyperactiveβ-catenin over-expression; by using micro-array data (Huh7-S33Y/Huh7-Vec: 1 ± 0.03). We extracted the promoters from Homo Sapiens Promoter Database of Cold Spring Harbor Laboratory (CSHLmpd) [21]. We used the best promoter option while choosing the promoter type and analyzed 5000 bases up- and downstream of the transcriptional start site (TSS).
BRI3 promoter (CSHLmpd promoter id: 119455) and HSF2 promoter (CSHLmpd promoter id: 35771) were extracted from CSHLmpd.
2.6. Promoter plasmids
5′-upstream fragments of HSF2 (Heat shock transcription factor 2) and BRI3 (Brain protein I3) genes were amplified from human genomic DNA (isolated from peripheral blood) using the primers listed inSupplementary Table 11and verified by sequencing. The PCR fragments were cloned intofirefly luciferase reporter vector pGL3-Basic (Promega) NheI and HindIII sites which were designed into the forward and the reverse primers, respectively. pRL-TK (Promega), a Renilla luciferase internal control vector, was used for normalization offirefly luciferase signals.
2.7. Luciferase assays
For co-transfection experiments, HEK293T cells or Huh7 cells were transfected with 100 ngfirefly luciferase reporter plasmid and 10 ng of pRL-TK Renilla luciferase internal control plasmid and promoter activities were stimulated by co-transfecting pcDNA3 or pcDNA3-S33Y-β-catenin or pcDNA3-dnTCF4 or combinations of these plas-mids, 350 ng each. Lipofectamine 2000 reagent (Invitrogen) was used for the transfections and the manufacturer's protocol was followed. Cells were harvested 36 h post-transfection. For Wnt3a-conditioned medium experiments, HEK293T cells were exposed to either L-cell or L-Wnt3a cell-derived conditioned medium for 36 h post-transfection of the reporter plasmids[6]. Cells were then harvested into 100μL 1× Passive Lysis Buffer (Promega). Luciferase activities were measured using Dual Glo™ Luciferase Assay System (Promega), as per procedure provided by the manufacturer.
2.8. Lithium treatment
Huh7 cells were treated with lithium chloride or sodium chloride (25 mM). Cells were harvested at indicated time points by adding 350μL of RLT lysis buffer of RNeasy® Mini Kit (Qiagen) and total RNA was isolated using the RNeasy® Mini Kit (Qiagen) according to the manufacturer's protocol. Quantitative reverse transcriptase mediated PCR (qRT-PCR) reactions were carried out using Fast-start sybGreen kit (Roche, cat# 03003230001), and Roche Lightcycler 1.5. For western blot analysis, the above procedure was repeated, but the cells were harvested at indicated time points by adding 700μL of 1× Triton-HEPES Lysis Buffer [1% Triton X-100, 25 mM HEPES, pH 7.4, 15 mM MgSO4, 4 mM EGTA, 1 mM DTT]. The lysates were sheared
through a 23 ga syringe 5 times and analyzed by Bradford assay for total protein levels. Equal protein amounts (100μg) were resolved on 10% SDS-PAGE and analyzed by western blotting using monoclonal anti-β-catenin antibody 9E10 and anti-β-actin polyclonal antibody. Densitometry analysis was done by ImageJ software.
2.9. ChIP assays
ChIP procedure for Huh7 and #18 glioblastoma cells was performed using the Epigentek ChIP kit (catalog # P-2002). 500,000 Huh7 or #18 cells were used for immunoprecipitation. Sonication was performed to shear genomic DNA (Sonics & Materials, Inc. Model NO: VC 50T). 4 pulses of 12 s with an output power of 40 produced desired fragmentation for Huh7 cells, which was verified by DNA gel electrophoresis (data not shown). Other than sonication, manufac-turarer's instructions were followed. 3μg of mouse monoclonal anti-β-catenin antibody (Santa Cruz, catalogue number SC-7963) was used with 1μg of anti-RNA polymerase II and mouse normal IgG antibody from the kit as controls. PCR was performed from purified DNA fragments by using Fermentas Taq polymerase, starting with an initial denaturation at 94 °C for 5 min, followed by 48 cycles of 30 s at 94 °C, 1 min at 55 °C, 1 min at 72 °C andfinally 5 min of 72 °C.
ChIP by using mouse liver tissues were performed as previously described [22]. Antibodies used for immunoprecipitation were β-catenin antibody (Invitrogen, mAb #44207M) and caspase 8 antibody (Cell Signaling Technologies: Caspase-8 (1C12) Mouse mAb #9746). PCR was performed from purified DNA fragments by using Fermentas Taq polymerase, starting with an initial denaturation at 92 °C for 5 min, followed by 48 cycles of 30 s at 92 °C, 1 min at 55 °C, 2 min at 70 °C and finally 5 min of 72 °C.
2.10. Analysis of publicly available data
Data from mitocheck project was used to assess siRNA mediated knockdown effect on HeLa cells (see www.mitocheck.org and ref
[23]). Microarray data was downloaded from gene expression omnibus (GEO) database of NCBI. Updated probeset definitions[24]
mapping to REFSEQ cDNAs were used while applying RMA macro of apt-probeset-summarize tool (among Affy power tools) to microarray data. Relative gene expression in figures (Figs. 8A and 9A) was calculated as the percentile of the gene expression in ranked data. In
Figs. 8B and 9B, gene expression is the direct output of RMA.
NM_015379 for BRI3 and NM_004506 for HSF2 are being illustrated in
Figs. 8A, B and 9A, B.
2.11. Statistical analysis
t-tests were performed by using Microsoft™ Excel's (Microsoft Office 2002 SP3) t-test function. Equal variances were assumed for all tests. For the analysis of mice xenograft experiments, paired t-test was used.
3. Results
3.1. TCF activation by over-expression of β-catenin leads to larger tumors in nude mice
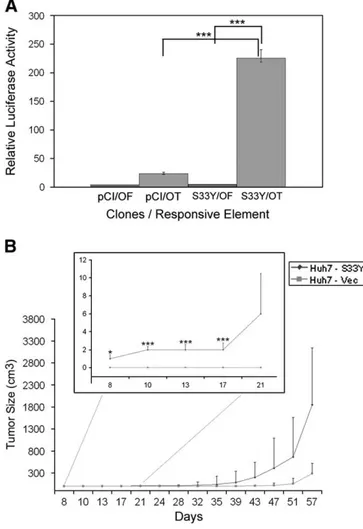
Higher activation of Wnt/β-catenin/TCF signaling in Huh7 cells was obtained by expression of aβ-catenin mutant (S33Y) that is hyperactive as it avoids degradation and accumulates sufficiently to enter the nucleus. Its activity was tested using a TCF-luciferase reporter assay. Hyperactive β-catenin-transfected cells (Huh7-S33Y) displayed more than 10-fold higher TCF activity, when compared to control cells transfected with vector (Huh7-Vec) (Fig. 1A). Upon bilateral subcutaneous injection into immunodeficient nude mice, the (polyclonal) Huh7-S33Y cell line initiated tumors earlier and led to larger tumors when compared to control (Fig. 1B). At the 13th day of tumor size measurement, Huh7-S33Y formed tumors in 80% of the mice, whereas thefirst measurable tumors in controls appeared in only 2 of 10 mice after 28 days. After 60 days, the median tumor size was 6.4 fold more in Huh7-S33Y initiated tumors when compared to Huh7-Vec initiated tumors.
3.2. SAGE and genome-wide microarray analysis of differential expression between high and low TCF activity Huh7 cells
In order to identify new members of the Wnt pathway and study differences between Huh7-S33Y and Huh7-Vec cells possibly affecting
Fig. 1. TCF over-activation by stable over-expression ofβ-catenin leads to larger and earlier onset tumors in nude mice. A, There is more TCF binding in hyperactive β-catenin expressing Huh7 cells (S33Y/OT), when compared to mutant TCF binding site containing controls (S33Y/OF) and empty vector controls (pCI/OF and pCI/OT). Error bars: SD. B, Huh7-pCI-S33Y xenografts (Huh7-S33Y) appear earlier and grow faster than Huh7-pCI-Neo xenografts (Huh7-Vec). Error bars: SE. For (A) and (B)‘*’ indicates pb0.05; ‘***’ indicates p b0.001.
tumorigenic capacity, we performed global gene expression analysis using both SAGE and genome-wide microarray analysis on the same RNA isolations.
In the SAGE experiment, 42,126 and 41,898 tags from hyperactive β-catenin-transfected (Huh7-S33Y) and empty vector transfected control were counted respectively. 431 tags were differentially expressed (p valueb0.05) which unambiguously correspond to 126 down-regulated and 33 up-regulated genes. In the microarray experiments, 96 genes (126 probes) were up-regulated and 121 genes (152 probes) were down-regulated more than 2 fold (p valueb0.05) when median intensity values were considered among triplicate microarray analysis, each from a separate cDNA synthesis. We also performed real-time (qRT-PCR) and RT-PCR for some of the differen-tially expressed genes and showed that there is an acceptable level of concordance between SAGE, microarray and RT-PCR based methods (Fig. 2).
We compared the results of SAGE and microarray data, by using a tendency analysis which compares the common detection of up-regulation, down-regulation or no-change tendencies. For tendency analysis, there were 1476 genes which were comparable between microarray and SAGE data (seeSection 2Materials and methods). With the default set of thresholds, the agreement in up- or down-regulation detection is very low (8% and 16% respectively) but the inverse tendency ratio is lower (3.93%) (Table 1). For 52% of the
Fig. 2. Verification and expansion of SAGE and microarray results by using Q-RT-PCR and RT-PCR. A, Quantitative Real Time PCR data, results were normalized using the geometric average of TF and TPI expression levels because their expression level is very similar in Huh7-Vec and Huh7-S33Y samples according to both SAGE and microarray data. HSF2-α and HSF2-β levels were normalized by geometric mean of s18 and GAPDH expression. Error bars represent SD. Lack of error bars means SDb0.001 B, RT-PCR data for several example genes.
Table 1
SAGE and microarray comparison by using tendency analysis. Up-regulation tendencya Down-regulation tendencyb No-change tendencyc Total Inverse tendencyd Microarray 219 302 955 1476 NA SAGE 89 377 1010 1476 NA SAGE and microarray 23 95 665 783 58 % commone 8.07 16.27 51.15 53.05 3.93
a Up-regulation tendency is defined as pb0.2 and Huh7-S33Y/Huh7-VecN1 for SAGE;
Huh7-S33Y/Huh7-VecN1.15 for microarray.
b Down-regulation tendency is defined as pb0.2 and Huh7-S33Y/Huh7-Vecb1 for
SAGE; Huh7-S33Y/Huh7-Vecb0.87 for microarray.
c No-change tendency is defined as not being in positive or negative tendency. d
Up-regulated according to SAGE and down-regulated according to microarray or vice-versa.
e
The ratio of intersection over the total number of genes in consideration: (genes commonly changed in microarray and SAGE)/[(genes analyzed in microarray) + (genes analyzed in SAGE)−(genes commonly changed in microarray and SAGE)].
Table 2
Number of TCF binding elements (TBEs) in the promoters of up-regulated genes in Huh7-S33Y relative to Huh7-vec when the longer motif– TCFlong– ‘RWWCAAWGG’ is
considered.
Gene region Control; n = 203 Up-regulated in S33Y n = 87
Two-sided Z test T* M* V* T M V SE* Z value* p value ‘−5000 to 0’ 146 0.72 0.71 78 0.90 0.87 0.09 1.96 0.03 ‘−1000 to 0’ 22 0.11 0.11 18 0.21 0.21 0.04 2.82 0.00 ‘−5000 to −4000’ 34 0.17 0.18 21 0.24 0.28 0.05 1.63 0.05 ‘−4000 to −3000’ 32 0.16 0.15 20 0.23 0.20 0.04 1.73 0.04 ‘−3000 to −2000’ 29 0.14 0.14 9 0.10 0.12 0.04 −0.97 0.18 ‘−2000 to −1500’ 16 0.08 0.07 6 0.07 0.09 0.03 −0.34 0.38 ‘−1500 to −1000’ 12 0.06 0.06 4 0.05 0.04 0.03 −0.52 0.31 ‘−1000 to −500’ 12 0.06 0.06 5 0.06 0.05 0.03 −0.06 0.50 ‘−500 to 0’ 10 0.05 0.05 13 0.15 0.17 0.02 4.32 0.00 ‘−500 to 500’ 19 0.09 0.08 20 0.23 0.22 0.03 4.36 0.00 ‘−1000 to 1000’ 44 0.22 0.21 32 0.37 0.35 0.05 3.08 0.00 ‘0 to 500’ 9 0.04 0.04 7 0.08 0.07 0.02 1.64 0.05 ‘0 to 1000’ 22 0.11 0.10 14 0.16 0.14 0.03 1.58 0.07 ‘0 to 5000’ 153 0.75 0.75 59 0.68 0.68 0.09 −0.82 0.21 ‘−5000 to 5000’ 299 1.47 1.46 137 1.57 1.53 0.13 0.79 0.24 *T = Total number of motifs. M = average number of motifs. V = variance of distribution of motif counts. SE = Standard Error of mean. Positive Z value indicates more, negative Z value indicates less TBE in test group.
Table 3
Number of TCF binding elements (TBEs) in the promoters of down-regulated genes in Huh7-S33Y relative to Huh7-vec when the longer motif– TCFlong– ‘RWWCAAWGG’ is
considered.
Gene region Control; n = 203 Down-regulated in S33Y n = 160 Two-sided Z test T M V T M V SE Z value p value ‘−5000 to 0’ 146 0.72 0.71 113 0.71 0.68 0.07 −0.19 0.46 ‘−1000 to 0’ 22 0.11 0.11 14 0.09 0.08 0.03 −0.81 0.21 ‘−5000 to −4000’ 34 0.17 0.18 20 0.13 0.13 0.03 −1.27 0.12 ‘−4000 to −3000’ 32 0.16 0.15 24 0.15 0.13 0.03 −0.25 0.42 ‘−3000 to −2000’ 29 0.14 0.14 21 0.13 0.13 0.03 −0.39 0.38 ‘−2000 to −1500’ 16 0.08 0.07 14 0.09 0.10 0.02 0.41 0.34 ‘−1500 to −1000’ 12 0.06 0.06 18 0.11 0.12 0.02 2.86 0.00 ‘−1000 to −500’ 12 0.06 0.06 9 0.06 0.05 0.02 −0.15 0.46 ‘−500 to 0’ 10 0.05 0.05 4 0.03 0.02 0.02 −1.42 0.08 ‘−500 to 500’ 19 0.09 0.08 9 0.06 0.07 0.02 −1.62 0.05 ‘−1000 to 1000’ 44 0.22 0.21 23 0.14 0.15 0.04 −2.02 0.02 ‘0 to 500’ 9 0.04 0.04 5 0.03 0.03 0.02 −0.80 0.21 ‘0 to 1000’ 22 0.11 0.10 9 0.06 0.05 0.03 −2.12 0.02 ‘0 to 5000’ 153 0.75 0.75 107 0.67 0.70 0.07 −1.24 0.12 ‘−5000 to 5000’ 299 1.47 1.46 220 1.38 1.56 0.10 −1.02 0.16 *T = Total number of motifs. M = average number of motifs. V = variance of distribution of motif counts. SE = Standard Error of mean. Positive Z value indicates more, negative Z value indicates less TBE in test group.
comparable genes, methods point to same tendency (either up-regulation, down-regulation or no-change tendency). For the remain-ing 43% of the genes, one method points to negative tendency and the other method points to no-change tendency, or vice-versa. In other words, for approximately 95% of the genes the methods give non-inverse results. In summary, according to our data, SAGE and microarray do not give contradictory results but variably reveal differential expression for different genes, and it is best to perform them in parallel.
We also did tendency analysis in different abundance classes of genes. The agreement ratios did not change very much, when 3
different sets of abundance subsets were compared. However, the commonality percentage is mildly decreased in the cases of low abundance and middle abundance classes when compared to the high abundance class (Supplementary Tables 2–4). Microarray is more sensitive than 40,000 counts of SAGE tags, as SAGE detected 7.8 fold less genes than microarray, particularly due to the tag mapping problems. For SAGE 1727 tags unambiguously map to one gene, for microarray there are 13,497 genes detected. However, in terms of sensing differential expression, the two methods perform more similarly (approximately same ratio in down-regulated genes while microarray sensed 3 fold more up-regulated genes).
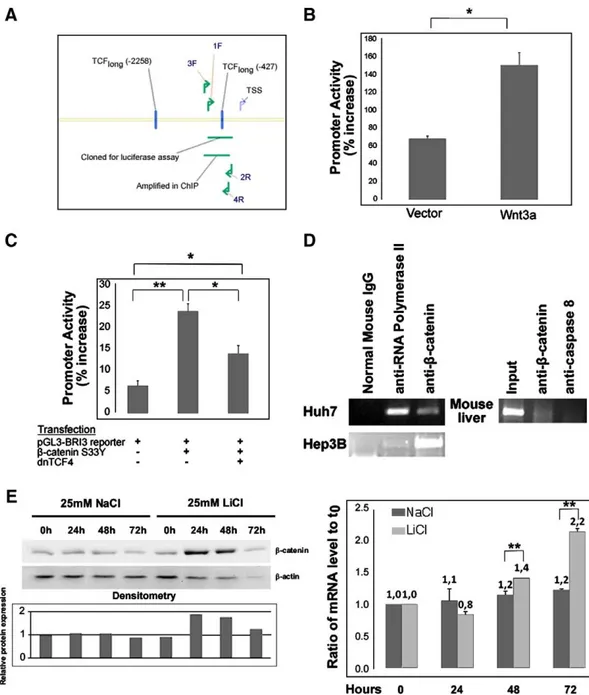
Fig. 3. BRI3 is a target of Wnt/β-catenin/TCF signaling in the liver context. A, Scheme of BRI3 promoter region; 1F stands for forward primer with the unique id 1. 2R is the reverse primer with id 2. Same nomenclature is valid for primers 3F and 4R. As illustrated in the Fig., 1F and 2R primers were used to amplify the region to be used in luciferase reporter assays. 3F and 4R are used to amplify captured genomic DNA by ChIP experiments. B, Luciferase reporter assays: autocrine stimulation of Huh7 cells by Wnt3a leads to up-regulation of BRI3 promoter (Wnt3a) when compared to empty vector control (Vector). Both vector and Wnt3a plasmids were co-transfected with BRI3 promoter reporter vector (pGL3-BRI3). C, Luciferase reporter assays: BRI3 promoter activation by hyperactiveβ-catenin is inhibited by addition of dominant negative TCF4 (dnTCF4) in Huh7 cells. D, Left: ChIP analysis,β-catenin binds to BRI3 promoter in Huh7 and Hep3B cells as revealed by ChIP analysis performed with anti-β-catenin antibody, anti-RNA polymerase antibody or normal mouse IgG. Right: ChIP analysis,β-catenin binds to BRI3 promoter in mouse liver revealed by ChIP analysis performed with β-catenin antibody or anti-caspase 8 antibody. The bands indicate genomic DNA product of BRI3 promoter. E, Lithium treatment: BRI3 mRNA level is increased upon increasedβ-catenin levels (verified by Western Blot in the left panel) due to lithium treatment of Huh7 cells. RNA levels were normalized by using beta-actin (ACTB) RNA levels. Densitometry of the bands in the Western Blot showsβ-catenin/β-actin levels relative to 0th hour. Error bars: SD, (*p valueb0.05; **p valueb0.01). Each graph is representative of at least two independent experiments.
Within the differentially expressed genes, several genes which seem to be novel in the context of the Wnt pathway were identified, in addition to the already known Wnt targets in liver. For instance, Glutamate-ammonia ligase (glutamine synthetase) (GLUL), a known target gene, is 2 fold up-regulated in Huh7-S33Y compared to Huh7-Vec in accordance with previous observations[25]. On the other hand, epidermal growth factor expression did not change (Huh7-S33Y/Huh7-Vec = 0.97 ± 0.17; from 10 different probes) although proposed as a novel liver Wnt target[26]. In agreement with earlier work[16], Wnt/ β-catenin targets in Huh7 cells appear to be largely different from targets in colon carcinoma[14], in spite of some similarities such as DKK1 (microarray data; Huh7-S33Y/Huh7-Vec:2,12) and c-Myc (Fig. 2).
As Huh7 cells have been shown to have a side population which is more tumorigenic and more stem cell-like[27,28], we also rescued the tumor-forming cells (post-tumor cell lines PT-Huh7-S33Y and PT-Huh7-Vec) and reanalyzed their transcriptome profile by using microarrays to check if any substantial changes could be identified related to in vivo subpopulation selection and compared our results to those of Haraguchi et al.[28]who analyzed gene expression profiles of Huh7 side population (i.e. stem) cells. Intersection analysis of the genes up-regulated in Huh7 stem cells and post-tumor cells revealed some genes commonly over-expressed in both cases (Supplementary Tables 5 and 6). When functional ontology distributions of these genes were analyzed, it was seen that, 8 out of 14 were plasma membrane proteins, 7 out of 14 had roles in cell communication and 4 had trans-membrane transporter activity. All of these (partially overlapping) properties might be related to cancer stem cell characteristics such as invasion, metastasis and high drug export ability.
3.3. In silico promoter analysis
To increase the stringency in our search for Wnt pathway-related genes within our microarray and SAGE data, promoter regions of the detected genes were analyzed in terms of TCF binding element (TBE) content similar to a previous approach by Schwartz et al.[29](Tables 2 and 3). In summary, TBEs were counted in promoters of genes that are over or under-expressed upon stableβ-catenin over-expression and compared to promoters in a no-change gene pool. We expanded the previous approach by performing a two-sided Z test and considering two different TCF binding motifs, short TCF binding motif (TCFshort:
‘WWCAAWG’) and long TCF binding motif (TCFlong:‘RWWCAAWGG’).
In order to evaluate the biological significance of this statistical analysis, wefirst used the promoters of already known targets[14]. We saw that there are more TBEs in the‘−1500 to −1000’ region (p value = 0.12), in known target's promoters, regardless of the TCF binding motif we used (Supplementary Tables 7 and 8).
We then defined a union set of genes by merging microarray and SAGE data on which we performed the analysis (seeSection 2Materials and methods). There are different numbers and distribution patterns of TCF binding elements (TBEs) in promoters of the genes that are affected upon hyperactive beta-catenin over-expression in Huh7 cells; when compared to a no-change pool. We observed the most significant differences in‘−1000 to Transcription Start Site (TSS)’ and ‘−1500 to−1000’ regions (Tables 2 and 3). For up-regulated targets, abundance of TBEs in promoter regions has been shown before[29]. However, our analysis hints at a particular pattern for down-regulated targets where there are significantly less TBEs in ‘TSS to +1000’ and there are significantly more TBEs between ‘−1500 to −1000’ (Supplementary Fig. 1) andTable 3. Supporting this general statistical analysis, there is no TCFlongin‘TSS to +1000’ in any of 15 down-regulated genes with TCFlong
in‘−1500 to −1000’.
3.4. Novel Wnt/β-catenin/TCF targets; BRI3 and HSF2
After making a combined study of SAGE, microarray, PCR and in silico promoter data (Supplementary Table 9); some candidate genes
were analyzed in further detail. Among these genes, we showed that BRI3 (Entrez Gene ID: 25798) and HSF2 (Entrez Gene ID: 3298) are novel targets of Wnt/β-catenin/TCF signaling. The selection of HSF2 and BRI3 among other candidates was based on their fold change in Huh7-S33Y/Huh7-Vec and the presence of TCF binding element in
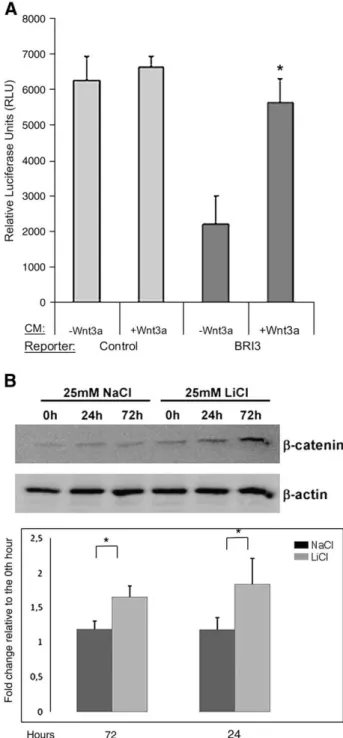
Fig. 4. BRI3 is a target of Wnt/β-catenin/TCF signaling in some of the non-liver contexts. A, Luciferase reporter assays: BRI3 promoter is 2.48 fold more active in 293T cells which are exposed to conditioned medium from Wnt3a secreting cells when compared to non-secreting exposed controls (BRI3). This difference is significant, when compared to the non-significant variation in pGL3-Basic (Control). It should be noted that basal promoter activation of BRI3 is∼20 fold less than that of HSF2 (Fig. 6A) in 293T cells, which points to an overall repression of BRI3 expression in these cells. In this experiment, the presence of the BRI3 promoter in the construct might repress the leaky activity observed in the promoterless empty vector. Upon Wnt3a induction, the BRI3 promoter is activated and the expression levels from the BRI3 construct approximate the leaky expression of the control vector. B, Lithium treatment: BRI3 mRNA level is increased upon increasedβ-catenin levels (verified by Western Blot in the left panel) due to lithium treatment of U373-MG cells. RNA levels were normalized by using beta-actin (ACTB) RNA levels. Error Bars: SD, (*p valueb0.05). Each graph is representative of at least two independent experiments.
their promoters, as well as their potential importance as Wnt targets. BRI3 scored the highest among other selected candidates (
Supple-mentary Table 9) as being 3.0 fold up-regulated in Huh7-S33Y when
compared to Huh7-Vec (p value = 0.002). HSF2 has two isoforms,α andβ; α being the longer isoform which has 18 extra amino acids, with no known domains. HSF2-α and HSF2-β are both up-regulated 2.1 (p valueb0.0001) and 1.3 (p value b0.0001) fold in Huh7-S33Y when compared to Huh7-Vec, respectively (Fig. 2). To analyze targeting of BRI3 and HSF2 after tumor development in mice, primary cell cultures rescued from the tumors that developed in Huh7-S33Y and Huh7-Vec xenografts were analyzed (post-tumor cell lines PT-Huh7-S33Y and PT-Huh7-Vec respectively). BRI3 mRNA increased 2.53 fold in PT-Huh7-S33Y when compared to PT-Huh7-Vec
(p valueb0.0001). HSF2-α and HSF2-β were up-regulated 1.7 (p value= 0.07) and 2.27 (p value= 0.002) fold respectively.
When a comprehensive liver cancer screen (104 liver tumor tissues versus 76 non-tumor liver tissues) with genome-wide microarray analysis by Chen et al. was reanalyzed, HSF2 expression was found to be significantly (1.34 fold, Student's t-test p value: 0.0003) up-regulated in liver cancers when compared to normal liver tissues whereas expression of BRI3 was not detected with that particular array design[30,31]. HSF2 was also up-regulated (1.38 fold, Student's t-test p value: 0.0076) in HCC when compared to normal liver in another large HCC panel (55 HCCs, 15 normal livers)[32], whereas BRI3 was not detectable in that dataset. Previously published Wnt/TCF/β-catenin targets were altered as follows in the latter panel
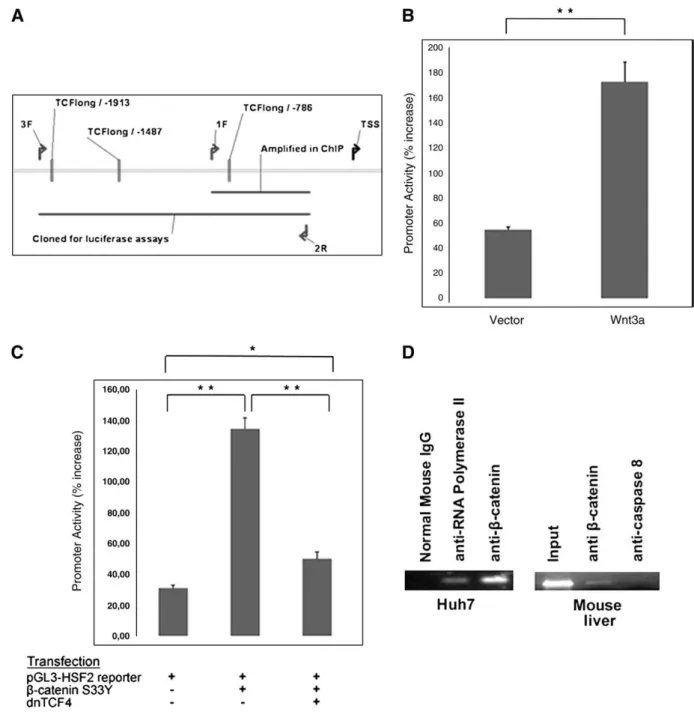
Fig. 5. HSF2 is a target of Wnt/β-catenin/TCF signaling in the liver context. A, Scheme of HSF2 promoter region; 1F stands for forward primer with the unique id 1. 2R is the reverse primer with id 2. Same nomenclature is valid for primer 3F. 3F and 2R primers were used to amplify the region to be used in luciferase reporter assays. 1F and 2R are used to amplify captured genomic DNA by ChIP experiments. B, Luciferase reporter assays: autocrine stimulation of Huh7 cells by Wnt3a leads to up-regulation of HSF2 promoter (Wnt3a) when compared to empty vector control (Vector). Both vector and Wnt3a plasmids were co-transfected with HSF2 promoter reporter vector (pGL3-HSF2). C, Luciferase reporter assays: HSF2 promoter is activated by hyperactiveβ-catenin in Huh7 cells which is inhibited by addition of dominant negative TCF4 (dnTCF4). D, Left: ChIP analysis: β-catenin binds to HSF2 promoter in Huh7 cells as revealed by ChIP analysis performed with anti-β-catenin antibody, anti-RNA polymerase antibody or normal mouse IgG. Right: ChIP analysis: β-catenin binds to HSF2 promoter in mouse liver as revealed by ChIP analysis performed withβ-catenin antibody or anti-caspase 8 antibody. The bands indicate genomic DNA product of HSF2 promoter. Error bars: SD, (*p valueb0.05; **p valueb0.01). Each graph is representative of at least two independent experiments.
(fold stands for median expression in HCC/median expression in normal livers and p value is from Student's t-test): EGFR (fold = 0.97, p = 0.05), TBX3 (fold =−1.25, p −0.0076), SLC1A2 (fold=−0.91, p = 0.0323), GLUL (fold = 1.01, p = 0.001), OAT (fold = 1.01, p = 0.91) and LECT2 (fold = 1.05, p = 1.08e-06).
When we analyzed the −5000 to + 5000 regions of the transcriptional start sites (TSS) of BRI3 and HSF2, we found that BRI3 has 5 TCFshortand 2 TCFlongmotifs between−3225th and 1122nd
positions relative to TSS. HSF2 has 17 TCFshortand 5 TCFlongmotifs
between−4504th and 4695th positions relative to TSS ( Supplemen-tary Table 9andFigs. 3A and 5Afor BRI3 and HSF2, respectively).
Based on the data from preliminary analysis, we aimed at further verifying the targeting of BRI3 and HSF2 by Wnt signaling mainly in liver context by utilizing liver cancer cell line models and mouse liver tissue. In addition to the main focus of liver context, we expanded our analysis to glioblastoma cells for lithium treatment and ChIP experiments and a human embryonic kidney cell line (293T) for Wnt3a stimulation experiments (see below), cell lines where these assays were well established. Our rationale by expanding the experiments to different cell lines was simply to obtain some hints
about the possible general implications of our results. Further experiments may describe a larger picture, however it is known that the Wnt pathway involves different targets in different tissues (such as colon vs. liver[16]), thus a universal pattern is not expected. 3.5. BRI3 and HSF2 promoters are regulated by theβ-catenin/TCF4 complex
Luciferase reporter assay was used to test the effect of over-expression of S33Y-β-catenin and dominant negative TCF4[33]on the activity of BRI3 and HSF2 promoters in Huh7 cells. Over-expression of S33Y-β-catenin resulted in significant increase in promoter activities of both genes and this effect was reduced by addition of dominant negative TCF4 (Figs. 3C and 5C). We then tested promoter activities of BRI3 and HSF2 upon autocrine Wnt3a stimulation of Huh7 cells by transient transfection with a Wnt3a plasmid; which resulted in up-regulation of promoter activities of both genes (Figs. 3B and 5B). We also tested promoter activities of BRI3 and HSF2 upon stimulation with Wnt3a in the 293T cell system described in[6]. This was achieved by exposing 293T cells to conditioned medium from L-cells or L-Wnt3a cells; and
Fig. 6. HSF2 is a target of Wnt/β-catenin/TCF signaling in some of the non-liver contexts. A, Luciferase reporter assays: HSF2 promoter is 1.25 fold more active in Wnt3a exposed 293T cells when compared to non-exposed counterparts (HSF2). This difference is significant, though mild, when compared to the non-significant variation in pGL3-Basic (Control). B, ChIP assays:β-catenin binds to HSF2 promoter in 18kj40 glioblastoma cells revealed by ChIP analysis performed with anti-β-catenin antibody, anti-RNA polymerase antibody or normal mouse IgG. The band corresponds to the PCR product of the genomic DNA HSF2 promoter region captured with antibody. C, Lithium treatment: HSF2-α and HSF2-β mRNA level is increased upon increasedβ-catenin levels (verified by Western Blot in the upper panel ofFig. 4B) due to lithium treatment of U373-MG glioblastoma cells. RNA levels were normalized by using the geometric mean of beta-actin (ACTB) and GAPDH RNA levels. Error bars: SD, (**p valueb0.01; ***p valueb0.005).
directly transfecting the 293T cell lines with the reporter constructs. As expected, the promoter activities were up-regulated in the L-Wnt3a exposed cells, with respect to L-cells (pb0.05, Student's t-test) (Figs. 4A and 6Afor BRI3 and HSF2 respectively). Taken together,β-catenin and TCF4 regulate BRI3 and HSF2 promoters, in vitro.
3.6.β-catenin interacts with BRI3 and HSF2 promoters
We used chromatin immunoprecipitation assay (ChIP) to obtain direct evidence for the proposed interaction between the Wnt/ β-catenin pathway and the control of BRI3 and HSF2 gene expression. PCR analysis of the immunoprecipitated DNA showed that the anti- β-catenin and anti-RNA Polymerase II antibody, but not the normal mouse IgG, pulled-down BRI3 and HSF2 promoter fragments in Huh7. The promoters of BRI3 and HSF2 were also bound by anti-β-catenin but not by anti-caspase-8 antibody in mouse normal liver tissue
(Figs. 3D and 5D). BRI3 promoter was also bound in another liver
cancer cell line Hep3B (Fig. 3D), whereas HSF2 was not (data not shown). We also did ChIP analysis in early passage glioblastoma cells (#18 in[34]) to test BRI3 and HSF2 targeting byβ-catenin in another cell context. HSF2 promoter was bound by β-catenin in #18 glioblastoma cells (Fig. 6B) whereas BRI3 promoter was not (data not shown).
3.7. Inhibition of GSK3β by lithium leads to increased BRI3 and HSF2 mRNA levels
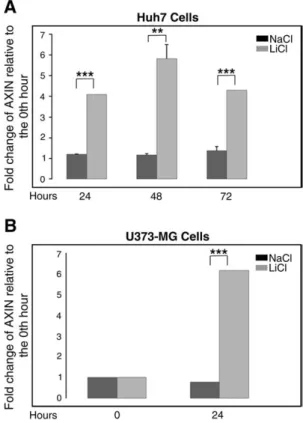
The key kinase of the Wnt pathway GSK3β that phosphorylates β-catenin to initiate its degradation is known to be inhibited by lithium. Cells exposed to lithium salts mimic the activated pathway and as a result of increasedβ-catenin accumulation and nuclear translocation, target gene expression is activated[35]. We treated Huh7 cells with lithium chloride and sodium chloride over 72 h to follow BRI3 and HSF2 mRNA levels concomitantly with accumula-tion of β-catenin protein levels. As it is known that GSK3β is already somewhat inhibited in Huh7 cells[36], we also included U373-MG cells (an established glioblastoma cell line) in this study. BRI3 RNA levels were found to increase together with β-catenin protein accumulation in lithium treated but not sodium treated Huh7 and U373-MG cells (Figs. 3E and 4B), later than AXIN2 RNA which was used as a positive control for lithium treatment, being an established Wnt/TCF/β-catenin target[37](Fig. 7). HSF2 alpha and beta RNA levels increased together with β-catenin protein accumulation in U373 cells (Fig. 6C) but did not significantly change in Huh7 cells (data not shown). Whether this might be due to different GSK3β activities or some other lithium-related sensitivity difference between the cell lines is unknown.
3.8. BRI3 and HSF2 in proliferation and HCC staging
Canonical Wnt/TCF/β-catenin signaling induces cell cycle genes which in turn lead to increased proliferation of the cell. In order to understand physiological relevance of BRI3 and HSF2 targeting of Wnt pathway, we reanalyzed publicly available gene expression data from large cancer (expO project; GEO accession ID: GSE2109, HCC data from GSE6764[38], brain tumor data from GSE4290[39]) and normal tissue screens (GEO accession ID: GSE7307). In order to assess proliferation rate of cells we used a previously established gene expression based metric; Proliferation Index (PI, introduced in ref
[40]) which negatively correlates with doubling time of NCI60 cell lines. Furthermore, we used a recent large siRNA screen on HeLa cells
[23]to assess the effect of BRI3 and HSF2 knockdown on proliferation. When all normal and cancer tissues are considered, BRI3 expression mildly correlates with PI (Spearman R: 0.08, p value: 1e-5). However in a large brain dataset expression of BRI3 increases with occurrence of astrocytoma and correlates with astrocytoma grade (Fig. 8A, Kendall
Tau: 0.278, p value: 3.3e-7). Within this dataset expression of BRI3 correlates with PI (Fig. 8B, Spearman R: 0.56, p value: 4.2e-30) as expected from positive correlation of astrocytoma grade and PI (data not shown). Moreover, siRNA mediated knockdown of BRI3 inhibits proliferation of HeLa cells (Fig. 8C).
HSF2 expression positively correlates with PI (Fig. 9A, Spearman R: 0.26, p value : 2e-39). In concordance with this observation, HSF2 knockout in HeLa cells decrease proliferation rate (Fig. 9C). Finally, HSF2 expression increases with HCC occurrence and progression (Fig. 9B, Kendall Tau: 0.51, p value: 2.5e-8).
4. Discussion
In this study it was shown that mutant β-catenin-transfected TCF4-hyperactive Huh7 cells lead to earlier and larger tumors in nude mice. SAGE, genome-wide microarray analysis and in silico promoter analysis were used in parallel in order to reveal transcriptomic changes and putative Wnt targets. BRI3 and HSF2 were shown to be novel targets of Wnt/TCF/β-catenin signaling.
We compared SAGE and microarray data from identical total RNA by using a tendency analysis approach. Other comparison methods are available such as scaling two data structures into the same dimension and comparing the values, or comparing the folds by using direct values or logs[41]. However, in our opinion, the best method to understand if these methods are giving similar results is to check the tendency of the resulting differences, because neither of the methods gives well correlated fold ratios in comparison to more exact methods such as quantitative real-time PCR (Fig. 2andSupplementary Table 1). On the other hand, SAGE and microarray sense differential expression of different genes. In terms of sensing presence of RNAs, microarray
Fig. 7. AXIN2 is an immediate responder to lithium treatment of Huh7 and U373-MG cells. A, Lithium treatment: AXIN2 mRNA level is increased afterb=24 h upon increased β-catenin levels (verified by Western Blot in the left panel ofFig. 3E) due to lithium treatment of Huh7. RNA levels were normalized by using beta-actin (ACTB) RNA levels. B, Lithium treatment: AXIN2 mRNA level is increased afterb=24 h (verified by Western Blot in the upper panel ofFig. 4B) due to lithium treatment of U373-MG glioblastoma cells. RNA levels were normalized by using beta-actin (ACTB) RNA levels. Error bars: SD, (**p valueb0.01; ***p valueb0.005).
sensed more genes when compared to SAGE, mainly originating from the tag mapping problem, definition of thresholds and the limiting total tag counts in SAGE. It should also be noted that, SAGE vs. microarray debate is quite outdated by the superior sensitivity and specificity of new generation sequencing technologies in gene expression measurement[42].
We also integrated in silico promoter analysis to our SAGE-microarray merged expression data. This enabled us to narrow down the target list rapidly. We did the same promoter analysis in several different datasets other than the merged dataset stated in theResults
section. The results somewhat varied when using SAGE data or microarray data alone, as expected from the overall differences observed when comparing the two techniques. When the most
consistent results as represented by the union dataset are considered; regardless of used motif (TCFshort or TCFlong) genes that are
differentially expressed have significantly different TBE patterns when compared to promoters of non-differentially expressed genes. Identifying a putative pattern which is different for down-regulated genes when compared to up-regulated genes was promising for elucidating how a single stimulus (hyperactiveβ-catenin) can lead to up- and down-regulation simultaneously (Supplementary Fig. 1).
In addition to comparing Huh7-S33Y vs. Huh7-Vec cell popula-tions, we hypothesized that post-tumor cells might resemble Huh7 stem cell-like subpopulations and analyzed the counterparts of these cells which were recultured from the mice xenografts upon tumor formation (PT-Huh7-S33Y vs. PT-Huh7-Vec). Indeed, genes altered
Fig. 8. BRI3 in proliferation. A, BRI3 (NM_015379) expression is higher in astrocytomas and positively correlates with tumor grade. B, BRI3 expression increases with increasing proliferation rate in a large brain tumor dataset (accession ID: GSE4290, N = 341). C, Knocking out BRI3 by siRNA decreases proliferation rate (darker dots together with the bestfit line) of HeLa cells when compared to a pool of negative control siRNAs (lighter line with the error bars). The analysis and the image are adapted fromwww.mitocheck.org. The graph is produced from experiment with LT0090_33-081 and is representative of 2 out of 3 different experiments by using siRNA with ID MCO_0022595. In box plots boxes represent inter-quartile range. Whiskers span 1.5 times inter-inter-quartile range.
upon in vivo passage of Huh7 cells are more similar to those in the stem cell-like side population of Huh7 cells than those altered upon TCF hyperactivation (Supplementary Table 5). Concordant with the stemness characteristics which will facilitate invasion and metastasis of the tumor, several of the post-tumor-enhanced genes were plasma membrane proteins which have roles in cell–cell communication.
Analysis of pre-tumor and post-tumor gene expression data in combination with in silico promoter analysis and literature search
pointed out potential novel Wnt targets among which BRI3 and HSF2 were confirmed through further experiments described above. For functional confirmation experiments, we primarily focused on liver context and therefore work with Huh7, Hep3B and mouse liver. However, working with additional cell lines synergized with the findings performed in the liver context (for a summary, see
Supplementary Table 10). For instance, HSF2 is up-regulated upon
lithium treatment in the glioblastoma cell line U373-MG whereas it is
Fig. 9. HSF2 in proliferation and HCC progression. A, HSF2 (NM_004506) expression is gradually increasing during HCC initiation and progression. B, HSF2 expression increases with increasing proliferation rate among a comprehensive set of cancer and normal samples (accession IDs: GSE2109 and a subset of GSE7307, total N = 2506). C, Knocking out HSF2 by siRNA decreases proliferation rate (darker dots together with the bestfit line) of HeLa cells when compared to a pool of negative control siRNAs (lighter line with the error bars). The analysis and the image are adapted fromwww.mitocheck.org. The graph is produced from experiment with ID LT0077_01-007 and is representative of 3 different experiments by using siRNA with ID MCO_0019857. In box plots boxes represent inter-quartile range. Whiskers span 1.5 times inter-quartile range.
not regulated in Huh7, which might be due to default GSK3β inhibition in Huh7[36]. Overall picture suggests that, both BRI3 and HSF2 are targeted in liver contexts, glioblastoma cells and 293 cells (seeSupplementary Table 10). However, further verification of BRI3 and HSF2 targeting in non-liver contexts is required. Finally, we point to significant correlations between the proliferation rate of cells with the expression levels of BRI3 and HSF2, which suggests physiological relevance for targeting BRI3 and HSF2.
BRI3 is predominantly expressed in brain [43]. Antisense RNA knockdown of BRI3 was shown to promote resistance to TNF induced cell death in the L929 cell line, which suggests a role for BRI3 as a putative oncogene[44]. Therefore, identification of BRI3 as a Wnt target suggests further characterization of its involvement in human cancer.
The heat shock factor protein family is highly conserved through-out evolution. This family confers a wide variety of functions, such as dealing with stress response (HSF1, HSF2 and HSF3), corticogenesis and spermatogenesis (HSF2), cell cycle regulation through c-Myb binding (HSF3) and maintenance of sensory organs (HSF4)[45–47]. HSFs regulate heat shock protein (HSP) gene expression levels through heat shock elements in the promoter regions of HSPs. Several of the HSPs have been related to cancer. For instance, Hsp27 is a prognosis marker for gastric, liver, prostate cancers and osteosarcomas, as well as predicting therapy outcome in breast cancers and leukemia[48]. Hsf2 has shown to regulate and modulate gene expression levels of Hsp27
[49]. Therefore, Wnt signaling can regulate Hsp27 levels through modulating HSF2 levels which suggests a new path for Wnt-cancer relation. Another connection we noted is through PP2A. HSF2 regulates PP2A function, a multiunit phosphatase, by binding on PR65 unit of the enzyme complex[50]. Although whether PP2A inhibits or induces Wnt pathway remains controversial, it is well known that it regulates Wnt pathway through GSK3β and AXIN[4]. This may point to a feedback mechanism between HSF2 and Wnt signaling through PP2A and might be a starting point for further exploration of HSF2–Wnt connection.
To conclude, we showed that high TCF activity Huh7 cells lead to earlier setup and larger tumors in nude mice and at least two genes were identified as novel downstream targets of the Wnt/TCF/β-catenin signaling pathway. Thesefindings, we hope, will help explo-ring Wnt signaling in cancer.
Acknowledgements Author's contributions
Ersen Kavak took part in organization of the study, preparation of the SAGE and microarray data, did the integrative analysis of SAGE, microarray and promoters and wrote the manuscript. Ayaz Najafov did most of the promoter related experiments together with Gerta Hoxhaj and Tuncay Seker. Nuri Ozturk did the initial cell engineering and mice xenograft studies. Remaining authors contributed to preparation and analysis of SAGE libraries. Mehmet Öztürk, Necla Birgül-İyison and Ahmet Koman initiated and supervised the project in their respective laboratories at Bilkent and Boğaziçi Universities with grants from both universities (BAP), and DPT. We would like to thank Dr. B. Vogelstein for the plasmid construct, Dr. X. He for supplying Wnt secreting and non-Wnt secreting L-cells, Dr. Tamer Yagci for the 9E10β-catenin monoclonal antibody, Dr. Can Akcali for in vivo tumor studies, Dr. Monica Nister for supplying #18 early passage glioblastoma cells, Dr. Rickard Sandberg for help with the analysis of public microarray data and Kursat Bayrakceken, Ceyda Bilgir, Melis Dalbay, Burce Ergel, Renin Hazan, Senem Kurtoglu, Osman Selvi and Burcu Sonmez for their contributions within their undergraduate studies.
Funding
This study has been supported with grants from: DPT (State Planning Organization of Turkey), BAP (Bogazici University Research
Projects) and TUBITAK (The Scientific and Technological Research Council of Turkey, 104T027, 105T301 and 106T153)
Accession number
SAGE data and microarray data were deposited to NCBI GEO database with the GEO series accession number GSE11956.
Appendix A. Supplementary data
Supplementary data associated with this article can be found, in the online version, atdoi:10.1016/j.cellsig.2010.05.021.
References
[1] H. Clevers, Cell 127 (3) (2006) 469.
[2] M. van Noort, H. Clevers, Dev. Biol. 244 (1) (2002) 1.
[3] T. Brabletz, A. Jung, T. Kirchner, Virchows Arch. 441 (1) (2002) 1. [4] P. Polakis, Curr. Opin. Genet. Dev. 17 (1) (2007) 45.
[5] T. Reya, H. Clevers, Nature 434 (7035) (2005) 843.
[6] K. Willert, J.D. Brown, E. Danenberg, A.W. Duncan, I.L. Weissman, T. Reya, J.R. Yates, R. Nusse, Nature 423 (6938) (2003) 448.
[7] M. Katoh, Oncol. Rep. 14 (6) (2005) 1583.
[8] A.D. Kohn, R.T. Moon, Cell Calcium 38 (3–4) (2005) 439. [9] S. Segditsas, I. Tomlinson, Oncogene 25 (57) (2006) 7531. [10] P. Laurent-Puig, J. Zucman-Rossi, Oncogene 25 (27) (2006) 3778. [11] L.R. Howe, A.M. Brown, Cancer Biol. Ther. 3 (1) (2004) 36.
[12] H.S. Lee, D.C. Lee, M.H. Park, S.J. Yang, J.J. Lee, D.M. Kim, Y. Jang, J.H. Lee, J.Y. Choi, Y.K. Kang, D.I. Kim, K.C. Park, S.Y. Kim, H.S. Yoo, E.J. Choi, Y.I. Yeom, Biochem. Biophys. Res. Commun. 345 (3) (2006) 1059.
[13] C.A. Renard, C. Labalette, C. Armengol, D. Cougot, Y. Wei, S. Cairo, P. Pineau, C. Neuveut, A. de Reynies, A. Dejean, C. Perret, M.A. Buendia, Cancer Res. 67 (3) (2007) 901.
[14] R. Nusse, Wnt/beta-catenin targets list, 2006.http://www.stanford.edu/∼rnusse/ pathways/targets.html.
[15] H.C. Lee, M. Kim, J.R. Wands, Front. Biosci. 11 (2006) 1901.
[16] W. Prange, K. Breuhahn, F. Fischer, C. Zilkens, T. Pietsch, K. Petmecky, R. Eilers, H.P. Dienes, P. Schirmacher, J. Pathol. 201 (2) (2003) 250.
[17] S. Satoh, Y. Daigo, Y. Furukawa, T. Kato, N. Miwa, T. Nishiwaki, T. Kawasoe, H. Ishiguro, M. Fujita, T. Tokino, Y. Sasaki, S. Imaoka, M. Murata, T. Shimano, Y. Yamaoka, Y. Nakamura, Nat. Genet. 24 (3) (2000) 245.
[18] M. Reich, T. Liefeld, J. Gould, J. Lerner, P. Tamayo, J.P. Mesirov, Nat. Genet. 38 (5) (2006) 500.
[19] P. Liang, Proc. Natl Acad. Sci. U. S. A. 99 (18) (2002) 11547.
[20] A. Lal, A.E. Lash, S.F. Altschul, V. Velculescu, L. Zhang, R.E. McLendon, M.A. Marra, C. Prange, P.J. Morin, K. Polyak, N. Papadopoulos, B. Vogelstein, K.W. Kinzler, R.L. Strausberg, G.J. Riggins, Cancer Res. 59 (21) (1999) 5403.
[21] Z. Xuan, F. Zhao, J. Wang, G. Chen, M.Q. Zhang, Genome Biol. 6 (8) (2005) R72. [22] A.S. Chen-Plotkin, G. Sadri-Vakili, G.J. Yohrling, M.W. Braveman, C.L. Benn, K.E.
Glajch, D.P. DiRocco, L.A. Farrell, D. Krainc, S. Gines, M.E. MacDonald, J.H. Cha, Neurobiol. Dis. 22 (2) (2006) 233.
[23] B. Neumann, T. Walter, J.K. Heriche, J. Bulkescher, H. Erfle, C. Conrad, P. Rogers, I. Poser, M. Held, U. Liebel, C. Cetin, F. Sieckmann, G. Pau, R. Kabbe, A. Wunsche, V. Satagopam, M.H. Schmitz, C. Chapuis, D.W. Gerlich, R. Schneider, R. Eils, W. Huber, J.M. Peters, A.A. Hyman, R. Durbin, R. Pepperkok, J. Ellenberg, Nature 464 (7289) (2010) 721.
[24] M. Dai, P. Wang, A.D. Boyd, G. Kostov, B. Athey, E.G. Jones, W.E. Bunney, R.M. Myers, T.P. Speed, H. Akil, S.J. Watson, F. Meng, Nucleic Acids Res. 33 (20) (2005) e175. [25] A. Cadoret, C. Ovejero, B. Terris, E. Souil, L. Levy, W.H. Lamers, J. Kitajewski, A.
Kahn, C. Perret, Oncogene 21 (54) (2002) 8293.
[26] X. Tan, U. Apte, A. Micsenyi, E. Kotsagrelos, J.H. Luo, S. Ranganathan, D.K. Monga, A. Bell, G.K. Michalopoulos, S.P. Monga, Gastroenterology 129 (1) (2005) 285. [27] T. Chiba, K. Kita, Y.W. Zheng, O. Yokosuka, H. Saisho, A. Iwama, H. Nakauchi, H.
Taniguchi, Hepatology 44 (1) (2006) 240.
[28] N. Haraguchi, T. Utsunomiya, H. Inoue, F. Tanaka, K. Mimori, G.F. Barnard, M. Mori, Stem Cells 24 (3) (2006) 506.
[29] D.R. Schwartz, R. Wu, S.L. Kardia, A.M. Levin, C.C. Huang, K.A. Shedden, R. Kuick, D.E. Misek, S.M. Hanash, J.M. Taylor, H. Reed, N. Hendrix, Y. Zhai, E.R. Fearon, K.R. Cho, Cancer Res. 63 (11) (2003) 2913.
[30] X. Chen, S.T. Cheung, S. So, S.T. Fan, C. Barry, J. Higgins, K.M. Lai, J. Ji, S. Dudoit, I.O. Ng, M. Van De Rijn, D. Botstein, P.O. Brown, Mol. Biol. Cell 13 (6) (2002) 1929. [31] D.R. Rhodes, S. Kalyana-Sundaram, V. Mahavisno, R. Varambally, J. Yu, B.B. Briggs, T.R.
Barrette, M.J. Anstet, C. Kincead-Beal, P. Kulkarni, S. Varambally, D. Ghosh, A.M. Chinnaiyan, Neoplasia 9 (2) (2007) 166.
[32] V.R. Mas, D.G. Maluf, K.J. Archer, K. Yanek, X. Kong, L. Kulik, C.E. Freise, K.M. Olthoff, R.M. Ghobrial, P. McIver, R. Fisher, Mol. Med. 15 (3–4) (2009) 85. [33] V. Korinek, N. Barker, P.J. Morin, D. van Wichen, R. de Weger, K.W. Kinzler, B.
Vogelstein, H. Clevers, Science 275 (5307) (1997) 1784.
[34] D. Hagerstrand, G. Hesselager, S. Achterberg, U. Wickenberg Bolin, M. Kowanetz, M. Kastemar, C.H. Heldin, A. Isaksson, M. Nister, A. Ostman, Oncogene 25 (35) (2006) 4913.
[35] P.S. Klein, D.A. Melton, Proc. Natl Acad. Sci. U. S. A. 93 (16) (1996) 8455. [36] C. Desbois-Mouthon, M.J. Blivet-Van Eggelpoel, E. Beurel, M. Boissan, R. Delelo, A.
[37] E.H. Jho, T. Zhang, C. Domon, C.K. Joo, J.N. Freund, F. Costantini, Mol. Cell. Biol. 22 (4) (2002) 1172.
[38] E. Wurmbach, Y.B. Chen, G. Khitrov, W. Zhang, S. Roayaie, M. Schwartz, I. Fiel, S. Thung, V. Mazzaferro, J. Bruix, E. Bottinger, S. Friedman, S. Waxman, J.M. Llovet, Hepatology 45 (4) (2007) 938.
[39] L. Sun, A.M. Hui, Q. Su, A. Vortmeyer, Y. Kotliarov, S. Pastorino, A. Passaniti, J. Menon, J. Walling, R. Bailey, M. Rosenblum, T. Mikkelsen, H.A. Fine, Cancer Cell 9 (4) (2006) 287.
[40] R. Sandberg, J.R. Neilson, A. Sarma, P.A. Sharp, C.B. Burge, Science 320 (5883) (2008) 1643.
[41] F. van Ruissen, J.M. Ruijter, G.J. Schaaf, L. Asgharnegad, D.A. Zwijnenburg, M. Kool, F. Baas, BMC Genomics 6 (2005) 91.
[42] E.T. Wang, R. Sandberg, S. Luo, I. Khrebtukova, L. Zhang, C. Mayr, S.F. Kingsmore, G.P. Schroth, C.B. Burge, Nature 456 (7221) (2008) 470.
[43] R. Vidal, M. Calero, T. Revesz, G. Plant, J. Ghiso, B. Frangione, Gene 266 (1–2) (2001) 95.
[44] H. Wu, G. Liu, C. Li, S. Zhao, Biochem. Biophys. Res. Commun. 311 (2) (2003) 518. [45] L. Pirkkala, P. Nykanen, L. Sistonen, Faseb J. 15 (7) (2001) 1118.
[46] M. Morange, Handb. Exp. Pharmacol. 172 (2006) 153.
[47] M. Akerfelt, D. Trouillet, V. Mezger, L. Sistonen, Ann. N.Y. Acad. Sci. 1113 (2007) 15. [48] D.R. Ciocca, S.K. Calderwood, Cell Stress Chaperones 10 (2) (2005) 86. [49] D.C. Wilkerson, H.S. Skaggs, K.D. Sarge, Cell Stress Chaperones 12 (3) (2007) 283. [50] Y. Hong, K.D. Sarge, J. Biol. Chem. 274 (19) (1999) 12967.