Adsorption of Copper(II) onto Perlite
Mahir Alkan∗,1and Mehmet Do˘gan†∗Department of Chemistry, Necatibey Education Faculty, and †Department of Chemistry, Faculty of Science and Literature,
Balıkesir University, 10100 Balıkesir, Turkey
E-mail: [email protected], [email protected].
Received February 21, 2001; accepted June 22, 2001; published online October 5, 2001
Perlite samples activated by H2SO4 solutions were utilized as adsorbents for the removal of Cu(II) ions from solutions at dif-ferent pHs, ionic strengths, and temperatures. It has been found that the amount of Cu(II) adsorbed increased with increased pH, whereas it decreased as the ionic strength, temperature, and acid activation increased. Adsorption isotherms correlated reasonably well with the Langmuir adsorption isotherm and Langmuir para-meters of adsorption isotherm (Qmand K ) were found with the aid of the linearized Langmuir isotherm. The entalphy change for Cu2+
adsorption has been estimated as−5.14 ± 1 and 4.38 ± 1 kJ/mol for unexpanded and expanded perlite samples, respectively. Proton sto-ichiometry (x) was calculated from Kurbatov plot using the amount of Cu(II) adsorbed at different pH. The dimensionless separation factor (R) has shown that perlite can be used for removal of Cu(II) ion from aqueous solutions, but unexpanded perlite is more effec-tive. °C2001 Academic Press
Key Words: Copper; perlite; adsorption isotherms; metal ion; proton stoichiometry.
1. INTRODUCTION
The adsorption of heavy metal cations onto oxide surfaces has been the subject of many studies in recent years. The presence of metals in aquatic environments has been known to cause sev-eral health problems in animals and human beings (1, 2). Heavy metal levels in waste water, drinking water, and water used for agriculture must be reduced to a maximum permissible con-centration. Precipitation, ion exchange, solvent extraction, and adsorption on oxides are the conventional methods for the re-moval of heavy metal ions from aqueous solutions (1, 3–6), but due to high maintenance cost these methods do not suit the needs of developing countries (1, 7).
The adsorption process is used especially in the water treat-ment field and investigation has been made to determine good, inexpensive adsorbents. Studies so far have focused on adsor-bents such as alumina (8–10), magnetite (8, 11), pyrolusite (8), rutile (9, 12), zirconia (9), hydrous manganese oxide (13), silica
1To whom correspondence should be addressed.
(14–18), geothite (19–23), heamatite (24), amorphous ferric oxide (25), bentonite (1, 26), activated carbon (27), sphalerite (28, 29), anatase (30, 31), red mud (32, 33), mica (34), illite (35), kaolinite (36), and clay (37).
Perlite is a glassy volcanic rock, commonly light gray, with a rhyolitic composition and 2 to 5% combined water (38). Expanded perlite meets competition from various other indus-trial minerals (39). Commercially, the term perlite includes any volcanic glass that will expand or “pop” when heated quickly, forming a lightweight frothy material. The temperature at which expansion takes place ranges from 760 to 1100◦C; a volume in-crease of 10 to 20 times is common (38). However, this versatile, lightweight material with its low bulk density continues to grow in popularity even though it is by no means the cheapest (39). Along the Aegean coast, Turkey possesses about 70% (70× 109tons) of the world’s known perlite reserves (40). The uses of expanded perlite are many and varied and are based primarily upon its physical and chemical properties. Because of their low thermal conductivity, high adsorption of sound, low bulk density, and fire resistance, perlite aggregate plasters hold many advan-tages over conventional plaster. Over half of the perlite produced goes into the construction industry, in particular as aggregate in insulation board, plaster, and concrete. In cryogenic (extremely low temperature) applications, perlite is used to insulate storage vessels for liquefied gas. Expanded perlite is used as a rooting medium and soil conditioner, and as a carrier for herbicides, insecticides, and chemical fertilizers. Accurately sized perlite is used as an aid in filtering water and other liquids, in food pro-cessing, and in pharmaceutical manufacture. As most perlites have a high silica content, usually greater than 70%, and are adsorptive, they are chemically inert in many environments and hence are excellent filter aids and fillers in various processes and materials. Miscellaneous uses of expanded perlite include fillers or extenders in paints, enamels, glazes, plastics, resins, and rubber, as a catalyst in chemical reactions; as an abrasive; and as an agent in mixtures for oil well cementing (41).
In our previous works, we investigated the electrokinetic properties (42) and surface titration of perlite suspensions (43) and also the adsorption of methylene blue from aqueous solu-tions onto perlite samples (44). In the present study, removal of 280
0021-9797/01 $35.00
Copyright°C2001 by Academic Press All rights of reproduction in any form reserved.
FeO 0.0–0.1
Ba 0.0–0.1
PbO 0.0–0.5
Cr 0.0–0.1
Cu2+ from aqueous solutions by adsorption has been studied.
The effects of solution pH, ionic strength, acid activation, and temperature on Cu2+ adsorption have been evaluated and the
proton stoichiometry and parameters for Langmuir adsorption isotherms have been reported. The results obtained have been applied to a batch design for the removal of Cu2+ ions from
aqueous media using perlite samples.
2. MATERIALS AND METHODS 2.1. Materials
The unexpanded and expanded perlite samples were obtained from Cumaovası Perlite Processing Plants of Etibank (˙Izmir, Turkey). The chemical composition of the perlite found in Turkey in the literature is given in Table 1 (40). The unexpanded and expanded perlite samples were treated as follows (42) before being used in the experiments: the suspension containing 10 g/L perlite was mechanically stirred for 24 h; after about 2 min the supernatant suspension was filtered through a white-band filter paper (8 = 12.5 cm). The solid sample was dried at 110◦C for 24 h, then sieved by a 100-mesh sieve. The particles under 100-mesh were used in further experiments.
TABLE 2
Some Physicochemical Properties of Perlite Samples Used in the Study
CEC Density Specific surface area Zeta potential
Sample Nomenclature (meg/100g) (g/mL) (m2/g) (mV)
Expanded, purified in water EP 33.30 2.24 2.30 −46.8
Expanded, 0.2 M acid-activated EHP(0.2) 38.20 2.10 — −47.1
Expanded, 0.4 M acid-activated EHP(0.4) 43.38 2.04 — −46.3
Expanded, 0.6 M acid-activated EHP(0.6) 54.24 1.93 2.33 −44.0
Unexpanded, purified in water UP 25.97 2.30 1.22 −23.5
Unexpanded, 0.2 M acid-activated UHP(0.2) 32.79 2.32 — −21.8
Unexpanded, 0.4 M acid-activated UHP(0.4) 35.00 2.38 — −22.0
Unexpanded, 0.6 M acid-activated UHP(0.6) 36.56 2.46 1.99 −21.1
unexpanded perlite (UHP(0.6)) were measured by BET N2
ad-sorption. The results are summarized in Table 2 (42). All chem-icals were obtained from Merck.
2.2. Methods
Adsorption experiments were carried out in 100-mL polyethy-lene flasks by shaking 0.5-g perlite samples with various amounts of stock Cu2+ solutions prepared from CuCl
2· 2H2O
and standardized titrimetically at 30◦C, natural solutions pH (6.1 ± 0.3), and constant ionic strength (0.2 M NaCl), except those in which varying conditions of temperature, pH, and ionic strength were investigated. The concentration of Cu2+
solu-tions for both sets of perlite samples was varied in the range of 1.6 × 10⁻⁵–2.4 × 10⁻⁴mol/L. A preliminary experiment re-vealed that about 15 h is required for Cu2+ions to reach the
equi-librium concentration. The flasks were shaken mechanically for 15 h at 30± 0.2◦C. The solution was filtered through Whatmann 42 filter paper. The pH of the solution was measured and consid-ered as the equilibrium pH. Each run was made at least in dupli-cate. A thermostated shaker bath was used to keep the tempera-ture constant. The pH of the solution was adjusted with NaOH or HNO3 solution by using an Orion 920A pH meter with a
combined pH electrode. The pH meter was standardized with NBS buffers before every measurement. The concentration of Cu2+ions in the filtrate was determined by AAS (Unicam 929).
Blanks containing no Cu2+were used for each series of
experi-ments. The amounts of Cu2+adsorbed were calculated from the
3. RESULTS AND DISCUSSION 3.1. Proton Stoichiometry
Several authors have investigated the overall stoichiometry of surface complex formation by measuring the number of hydro-gen ions released per adsorbed metal ion. Since specific adsorp-tion of multivalent caadsorp-tions almost always involves proton ex-change, an important characteristic of the adsorption processes is the number of protons released, or hydroxide ions adsorbed, for each cation adsorbed (45). To identify the appropriate model of adsorption, as a first step it is necessary to determine the sto-ichiometry of the reaction (46), which characterizes the net H+ exchange and varies with pH and the coverage of the surface with adsorbate (47). It has been observed that at concentrations of metal ions lower than 10−4 M, batch titration data yield a very high ratio of protons released M2+ adsorbed. Indeed, all
the published data correlating (CB− CA) with [M2+] are in the
M2+concentration range 10−3–10−4M. Therefore, the
titrimet-ric method is not suitable for determining the stoichiometry of the reaction at low concentrations of metal ions (45). Fokkink and co-workers recently proposed a simple double-layer model for estimating the value of the proton coefficient. They pre-dict a value for x in the range 1 to 2 under most experimental conditions, the particular result being determined primarily by
1pH = (pHpzc− pH), where pHpzcis the point of zero charge
(23, 48). It has been shown by Do˘gan et al. (42) that the perlite samples have no point of zero charge and exhibit negative zeta potential values in the pH range 3–11. Therefore, this method is not suitable for calculating x from experimental data. As an alternative method one may use the mass law expression to de-termine the stoichiometry of the surface interaction and this has proved to be a useful empirical approach (45, 46).
The adsorption of copper(II) can be expressed according to the following equations given by Park et al. (49) and Bourg and Schindler (50): SiOH+ Cu2+*) SiO–Cu++ H+, [1] K1= [SiO–Cu+][H+] [SiOH][Cu2+] ; [2] SiOH+ Cu2++ H2O*) SiO–CuOH0+ 2 H+, [3] K2= [SiO–CuOH0][H+]2 [SiOH][Cu2+] ; [4] 2 SiOH+ Cu2+*) (SiO)2Cu0+ 2 H+, [5] K3= [(SiO)2Cu0][H+]2 [SiOH]2[Cu2+] . [6] If [Cu2+]
adsrepresents the adsorbed amount of copper(II) in
terms of any one of the reactions [1], [3], or [5], the equations below can be written
log[Cu 2+] ads [Cu2+] e = [log K1+ log(SiOH)] + pH [7] or log[Cu 2+] ads [Cu2+] e = [log K2+ log(SiOH)] + 2pH [8] or log[Cu 2+] ads [Cu2+] e = [log K 3+ 2 log(SiOH)] + 2pH, [9] where [Cu2+]
eis the equilibrium concentration of Cu2+ in
so-lution and [SiOH] is the concentration of active site of the surface.
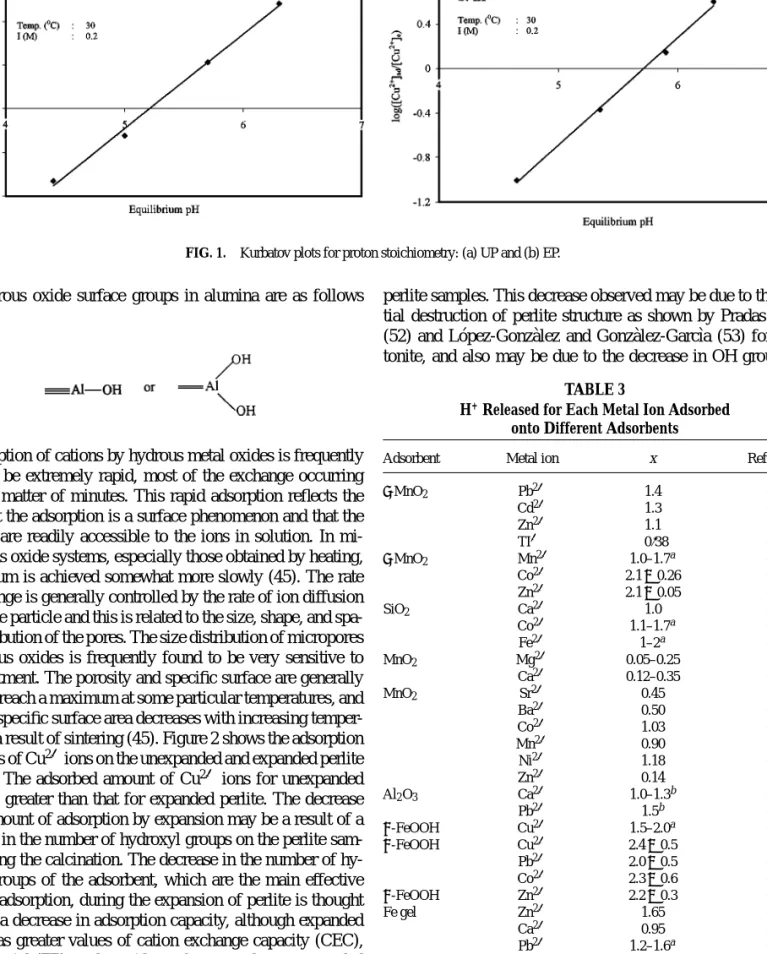
A plot of the left-hand side of Eqs. [7], [8], or [9] versus equilibrium pH of the solution should yield a linear relation-ship, the slope of which gives the stoichiometric coefficient of the reactions [1], [3], or [5] (46). This plot, which is called a Kurbatov plot, is useful for two reasons. First, it is frequently linear for trace divalent cation adsorption. Second, one of these parameters—the slope of the plot—gives an indication of the stoichiometry of the H+–Mn+ exchange reaction if adsorption is at very low surface coverages and low solution concentrations. No other method is suitable for determination of this stoichiom-etry under these conditions (45).
The plots of log([Cu2+]
ads/[Cu2+]e) versus equilibrium pH
are shown in Fig. 1. From the slope of each line in Fig. 1, it has been found that the number of protons released per Cu2+ ion
adsorbed onto perlite samples is 1.08 and 0.98 for unexpanded and expanded perlites, respectively. x values for different adsor-bents and metal ions are given in Table 3. This result indicates that the adsorption of copper(II) from aqueous solution onto perlite surface occurs according to reaction [1]. The fact that the x values are about 1 for Cu2+ion adsorption means that the surface charge becomes increasingly positive, as the Cu2+ions in the solution are adsorbed onto the perlite surface, according to reaction [1].
3.2. Adsorption Isotherms
The surface hydroxyl groups of the adsorbent have the main effect on the adsorption of Cu2+ion onto the perlite, so it would be useful to review the surface hydroxyl groups. The silicon atoms at the surface tend to maintain their tetrahedral coordina-tion with oxygen. They complete their coordinacoordina-tion at room tem-perature by attachment to monovalent hydroxyl groups, form-ing silanol groups. Theoretically, it is possible to use a pattern in which one silicon atom bears two or three hydroxyl groups, yielding silanediol and silanetriol groups, respectively. It is im-probable that silanetriol groups exist at the silica surface. The type of silanol groups are shown below (42–44):
FIG. 1. Kurbatov plots for proton stoichiometry: (a) UP and (b) EP. The hydrous oxide surface groups in alumina are as follows
(42–44):
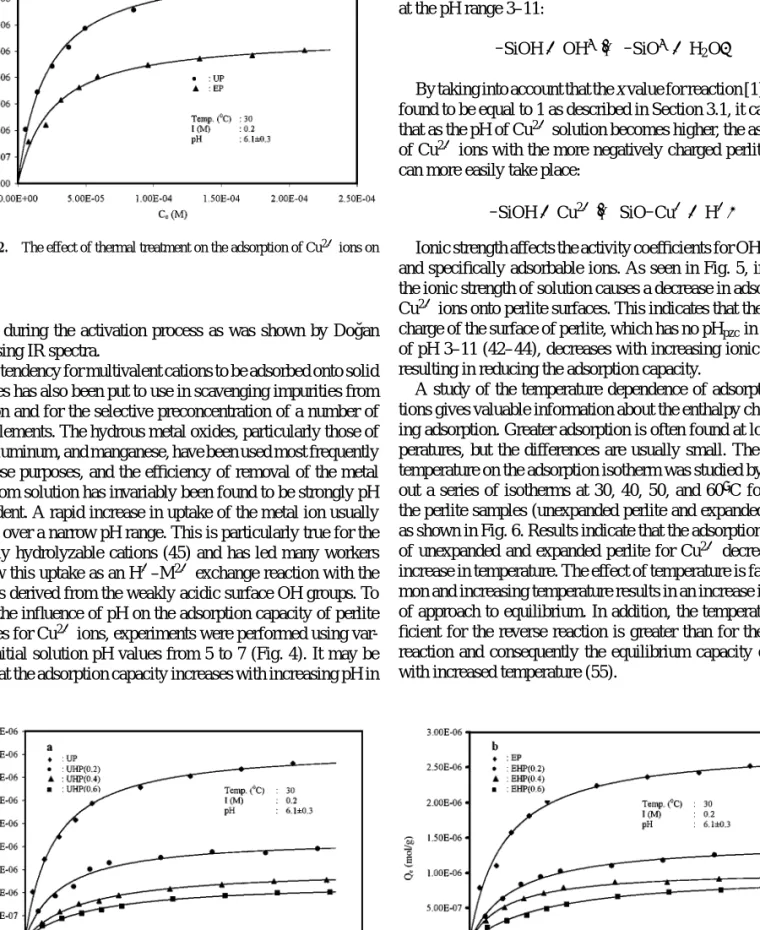
Adsorption of cations by hydrous metal oxides is frequently found to be extremely rapid, most of the exchange occurring within a matter of minutes. This rapid adsorption reflects the facts that the adsorption is a surface phenomenon and that the surfaces are readily accessible to the ions in solution. In mi-croporous oxide systems, especially those obtained by heating, equilibrium is achieved somewhat more slowly (45). The rate of exchange is generally controlled by the rate of ion diffusion within the particle and this is related to the size, shape, and spa-tial distribution of the pores. The size distribution of micropores in hydrous oxides is frequently found to be very sensitive to heat treatment. The porosity and specific surface are generally found to reach a maximum at some particular temperatures, and then the specific surface area decreases with increasing temper-ature as a result of sintering (45). Figure 2 shows the adsorption isotherms of Cu2+ions on the unexpanded and expanded perlite
samples. The adsorbed amount of Cu2+ ions for unexpanded
perlite is greater than that for expanded perlite. The decrease in the amount of adsorption by expansion may be a result of a decrease in the number of hydroxyl groups on the perlite sam-ples during the calcination. The decrease in the number of hy-droxyl groups of the adsorbent, which are the main effective sites for adsorption, during the expansion of perlite is thought to cause a decrease in adsorption capacity, although expanded perlite has greater values of cation exchange capacity (CEC), zeta potential (ZP), and specific surface area than unexpanded perlite (44).
The effect of acid activation on the adsorption of Cu2+ions
onto perlite samples is given in Fig. 3, which indicates that the numbers of adsorbed Cu2+ions slightly decrease with the
con-centration of H2SO4used for the acid activation for both of the
perlite samples. This decrease observed may be due to the par-tial destruction of perlite structure as shown by Pradas et al. (52) and L´opez-Gonz`alez and Gonz`alez-Garc`ıa (53) for ben-tonite, and also may be due to the decrease in OH groups in
TABLE 3
H+Released for Each Metal Ion Adsorbed
onto Different Adsorbents
Adsorbent Metal ion x References
δ-MnO2 Pb2+ 1.4 (45) Cd2+ 1.3 (45) Zn2+ 1.1 (45) TI+ 0.38 (45) δ-MnO2 Mn2+ 1.0–1.7a (45) Co2+ 2.1± 0.26 (45) Zn2+ 2.1± 0.05 (45) SiO2 Ca2+ 1.0 (45) Co2+ 1.1–1.7a (45) Fe2+ 1–2a (45) MnO2 Mg2+ 0.05–0.25 (45) Ca2+ 0.12–0.35 (45) MnO2 Sr2+ 0.45 (45) Ba2+ 0.50 (45) Co2+ 1.03 (45) Mn2+ 0.90 (45) Ni2+ 1.18 (45) Zn2+ 0.14 (45) Al2O3 Ca2+ 1.0–1.3b (45) Pb2+ 1.5b (45) α-FeOOH Cu2+ 1.5–2.0a (45) α-FeOOH Cu2+ 2.4± 0.5 (45) Pb2+ 2.0± 0.5 (45) Co2+ 2.3± 0.6 (45) α-FeOOH Zn2+ 2.2± 0.3 (45) Fe gel Zn2+ 1.65 (45) Ca2+ 0.95 (45) Pb2+ 1.2–1.6a (45) Goethite Cu2+ 1.66 (23) Goethite Cu2+ 1.1 (51) UP Cu2+ 1.08 This study EP Cu2+ 0.98 This study aIncrease with pH. bNo trend with pH.
FIG. 2. The effect of thermal treatment on the adsorption of Cu2+ions on
perlite.
perlite during the activation process as was shown by Do˘gan (54) using IR spectra.
The tendency for multivalent cations to be adsorbed onto solid surfaces has also been put to use in scavenging impurities from solution and for the selective preconcentration of a number of trace elements. The hydrous metal oxides, particularly those of iron, aluminum, and manganese, have been used most frequently for these purposes, and the efficiency of removal of the metal ions from solution has invariably been found to be strongly pH dependent. A rapid increase in uptake of the metal ion usually occurs over a narrow pH range. This is particularly true for the strongly hydrolyzable cations (45) and has led many workers to view this uptake as an H+–M2+exchange reaction with the
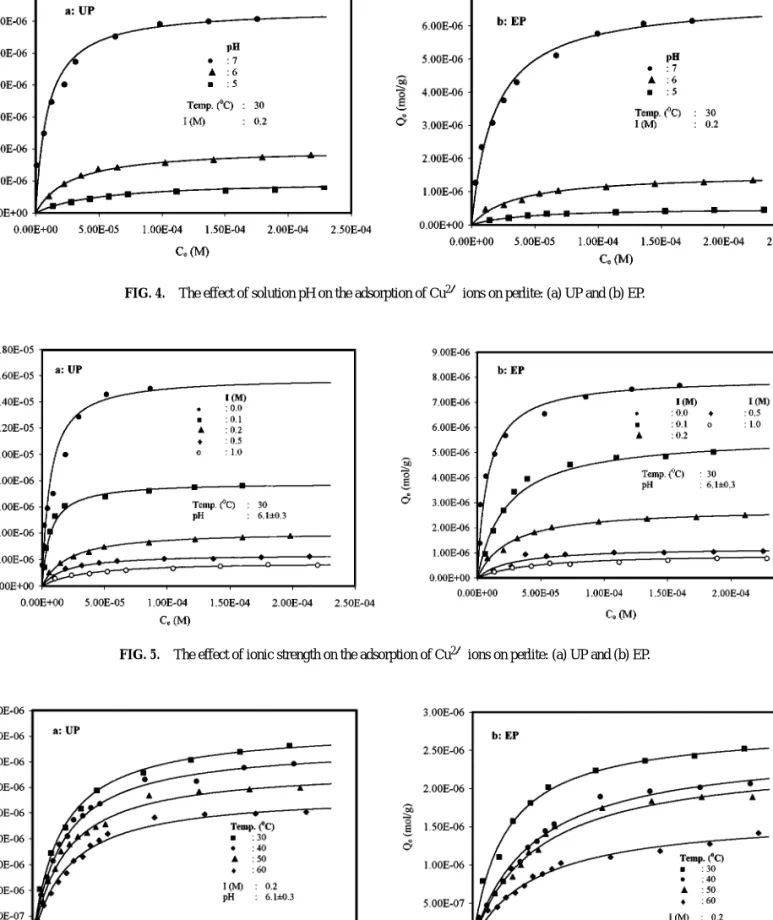
protons derived from the weakly acidic surface OH groups. To study the influence of pH on the adsorption capacity of perlite samples for Cu2+ions, experiments were performed using
var-ious initial solution pH values from 5 to 7 (Fig. 4). It may be said that the adsorption capacity increases with increasing pH in
FIG. 3. The effect of acid activation on the adsorption of Cu2+ions on perlite: (a) UP and (b) EP.
the range of these pH values and that adsorption does not occur below pH 5. It has been shown (42) that the perlite samples have no point of zero charge and exhibit negative zeta potential value at the pH range 3–11:
–SiOH+ OH−*) –SiO−+ H
2O, [10]
By taking into account that the x value for reaction [1] has been found to be equal to 1 as described in Section 3.1, it can be said that as the pH of Cu2+solution becomes higher, the association of Cu2+ ions with the more negatively charged perlite surface can more easily take place:
–SiOH+ Cu2+*
) SiO–Cu++ H+. [1]
Ionic strength affects the activity coefficients for OH−, H3O+,
and specifically adsorbable ions. As seen in Fig. 5, increasing the ionic strength of solution causes a decrease in adsorption of Cu2+ions onto perlite surfaces. This indicates that the negative charge of the surface of perlite, which has no pHpzcin the range
of pH 3–11 (42–44), decreases with increasing ionic strength, resulting in reducing the adsorption capacity.
A study of the temperature dependence of adsorption reac-tions gives valuable information about the enthalpy change dur-ing adsorption. Greater adsorption is often found at lower tem-peratures, but the differences are usually small. The effect of temperature on the adsorption isotherm was studied by carrying out a series of isotherms at 30, 40, 50, and 60◦C for both of the perlite samples (unexpanded perlite and expanded perlite), as shown in Fig. 6. Results indicate that the adsorption capacity of unexpanded and expanded perlite for Cu2+ decreases with increase in temperature. The effect of temperature is fairly com-mon and increasing temperature results in an increase in the rate of approach to equilibrium. In addition, the temperature coef-ficient for the reverse reaction is greater than for the forward reaction and consequently the equilibrium capacity decreases with increased temperature (55).
FIG. 4. The effect of solution pH on the adsorption of Cu2+ions on perlite: (a) UP and (b) EP.
FIG. 5. The effect of ionic strength on the adsorption of Cu2+ions on perlite: (a) UP and (b) EP.
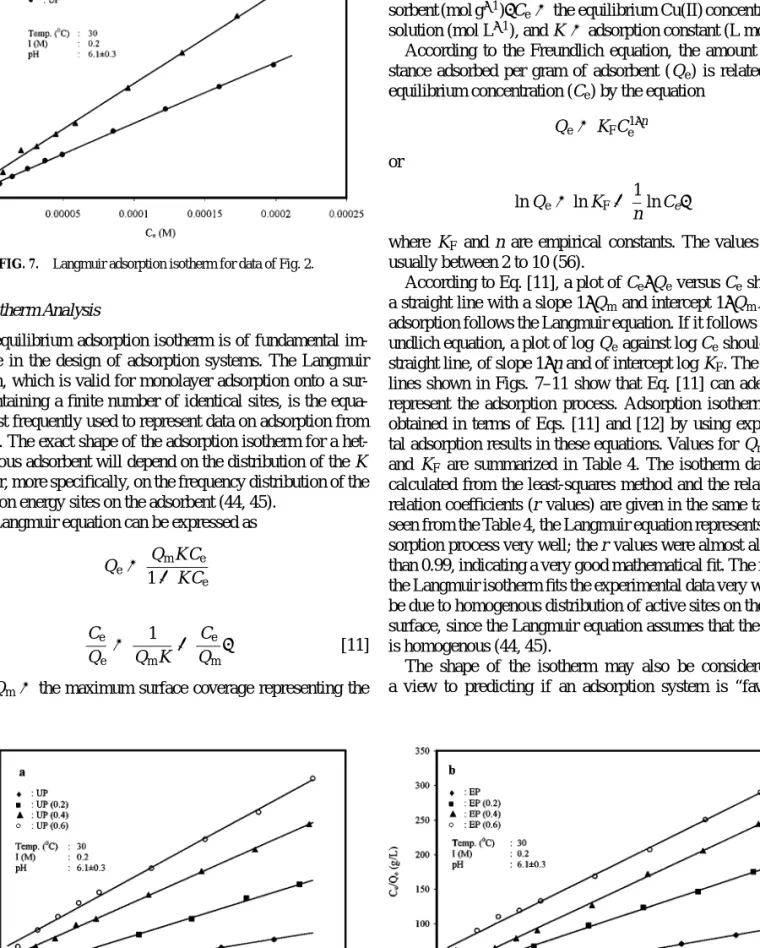
FIG. 7. Langmuir adsorption isotherm for data of Fig. 2.
3.3. Isotherm Analysis
The equilibrium adsorption isotherm is of fundamental im-portance in the design of adsorption systems. The Langmuir equation, which is valid for monolayer adsorption onto a sur-face containing a finite number of identical sites, is the equa-tion most frequently used to represent data on adsorpequa-tion from solution. The exact shape of the adsorption isotherm for a het-erogeneous adsorbent will depend on the distribution of the K values or, more specifically, on the frequency distribution of the adsorption energy sites on the adsorbent (44, 45).
The Langmuir equation can be expressed as
Qe= QmK Ce 1+ K Ce or Ce Qe = 1 QmK + Ce Qm, [11] where Qm= the maximum surface coverage representing the
FIG. 8. Langmuir adsorption isotherm for data of Fig. 3: (a) UP and (b) EP.
formation of a monomolecular layer on the surface of the adsor-bent (mol g−1), Qe= equilibrium Cu(II) concentration on
ad-sorbent (mol g−1), Ce= the equilibrium Cu(II) concentration in
solution (mol L−1), and K= adsorption constant (L mol−1). According to the Freundlich equation, the amount of sub-stance adsorbed per gram of adsorbent (Qe) is related to the
equilibrium concentration (Ce) by the equation Qe= KFCe1/n
or
ln Qe= ln KF+
1
n ln Ce, [12]
where KF and n are empirical constants. The values of n is
usually between 2 to 10 (56).
According to Eq. [11], a plot of Ce/Qeversus Ceshould be
a straight line with a slope 1/Qm and intercept 1/QmK when
adsorption follows the Langmuir equation. If it follows the Fre-undlich equation, a plot of log Qeagainst log Ceshould give a
straight line, of slope 1/n and of intercept log KF. The straight
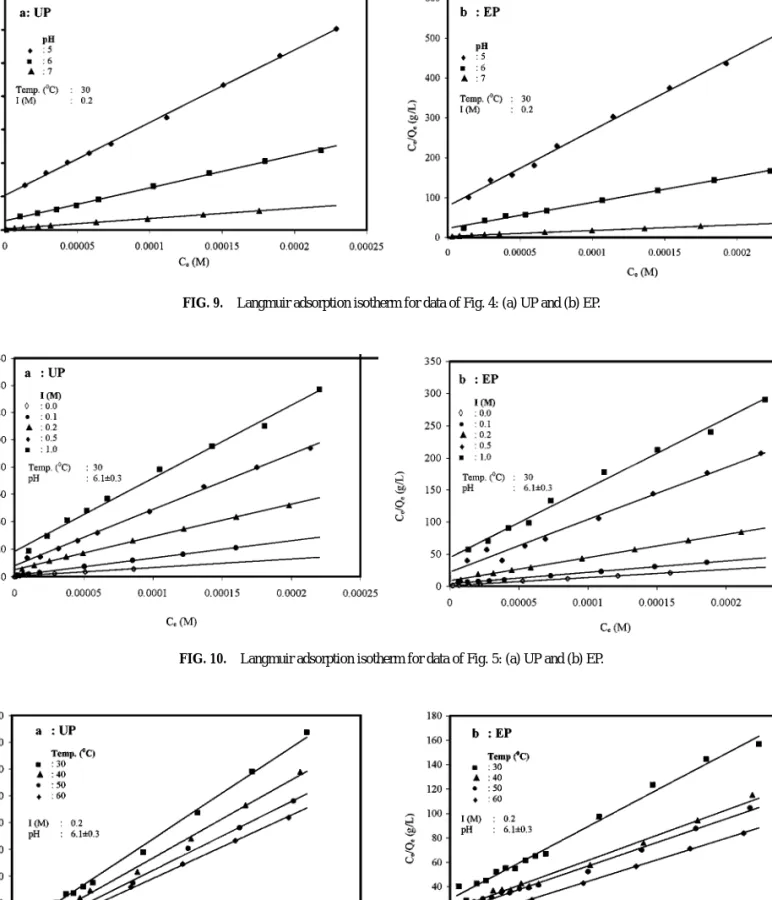
lines shown in Figs. 7–11 show that Eq. [11] can adequately represent the adsorption process. Adsorption isotherms were obtained in terms of Eqs. [11] and [12] by using experimen-tal adsorption results in these equations. Values for Qm, K, n,
and KF are summarized in Table 4. The isotherm data were
calculated from the least-squares method and the related cor-relation coefficients (r values) are given in the same table. As seen from the Table 4, the Langmuir equation represents the ad-sorption process very well; the r values were almost all higher than 0.99, indicating a very good mathematical fit. The fact that the Langmuir isotherm fits the experimental data very well may be due to homogenous distribution of active sites on the perlite surface, since the Langmuir equation assumes that the surface is homogenous (44, 45).
The shape of the isotherm may also be considered with a view to predicting if an adsorption system is “favorable”
FIG. 9. Langmuir adsorption isotherm for data of Fig. 4: (a) UP and (b) EP.
FIG. 10. Langmuir adsorption isotherm for data of Fig. 5: (a) UP and (b) EP.
TABLE 4
Langmuir Isotherm Constants for Perlite Samples
Langmuir isotherm
Freundlich isotherm
Temperature Qm× 106 K× 10−4
Sample (◦C) I (M) pH (mol/g) (L/mol) r n KF× 105 r R
UP 30 0.2 6.1± 0.3 4.17 4.75 0.9996 2.81 8.87 0.9749 0.791–0.096 UHP(0.2) 30 0.2 6.1± 0.3 2.21 3.73 0.9981 2.64 5.44 0.9562 0.733–0.110 UHP(0.4) 30 0.2 6.1± 0.3 1.55 2.26 0.9995 2.26 5.91 0.9754 0.782–0.165 UHP(0.6) 30 0.2 6.1± 0.3 1.26 1.96 0.9982 2.25 4.70 0.9916 0.822–0.207 EP 30 0.2 6.1± 0.3 2.80 4.04 0.9990 2.79 5.82 0.9683 0.759–0.105 EHP(0.2) 30 0.2 6.1± 0.3 1.46 3.16 0.9995 2.57 3.79 0.9552 0.726–0.124 EHP(0.4) 30 0.2 6.1± 0.3 1.04 3.76 0.9994 2.83 2.03 0.9519 0.679–0.105 EHP(0.6) 30 0.2 6.1± 0.3 1.00 1.73 0.9978 2.15 4.30 0.9901 0.810–0.202 UP 30 0.2 5 1.00 1.93 0.9995 2.21 3.80 0.9752 0.791–0.185 UP 30 0.2 6 2.02 3.59 0.9994 2.66 4.79 0.9527 0.725–0.113 UP 30 0.2 7 6.39 10.52 0.9989 3.55 7.83 0.9853 0.912–0.051 EP 30 0.2 5 0.50 2.54 0.9986 2.47 1.47 0.9718 0.733–0.145 EP 30 0.2 6 1.52 2.88 0.9978 2.76 3.02 0.9832 0.759–0.135 EP 30 0.2 7 6.78 5.48 0.9989 2.61 19.52 0.9791 0.853–0.095 UP 30 0.0 6.1± 0.3 15.94 16.13 0.9936 2.97 38.13 0.9021 0.990–0.067 UP 30 0.1 6.1± 0.3 7.91 15.39 0.9998 3.20 14.15 0.9878 0.786–0.039 UP 30 0.2 6.1± 0.3 4.17 4.75 0.9996 2.81 8.87 0.9749 0.791–0.096 UP 30 0.5 6.1± 0.3 2.45 5.15 0.9991 3.00 4.28 0.9197 0.681–0.083 UP 30 1.0 6.1± 0.3 1.86 2.95 0.9967 2.82 3.44 0.9935 0.768–0.133 EP 30 0.0 6.1± 0.3 7.98 12.44 0.9993 3.21 13.66 0.9148 0.803–0.048 EP 30 0.1 6.1± 0.3 5.69 4.38 0.9979 2.25 28.19 0.9305 0.788–0.109 EP 30 0.2 6.1± 0.3 2.80 4.04 0.9990 2.79 5.82 0.9683 0.759–0.105 EP 30 0.5 6.1± 0.3 1.22 3.69 0.9924 2.54 3.50 0.8723 0.683–0.107 EP 30 1.0 6.1± 0.3 1.00 2.25 0.9960 2.52 2.40 0.9698 0.769–0.163 UP 30 0.2 6.1± 0.3 4.17 4.75 0.9996 2.81 8.87 0.9749 0.791–0.096 UP 40 0.2 6.1± 0.3 3.84 4.41 0.9988 2.16 23.17 0.9357 0.774–0.101 UP 50 0.2 6.1± 0.3 3.39 4.15 0.9986 2.15 20.63 0.9372 0.754–0.105 UP 60 0.2 6.1± 0.3 2.89 3.78 0.9984 2.13 17.65 0.9568 0.753–0.111 EP 30 0.2 6.1± 0.3 2.80 4.04 0.9990 2.79 5.82 0.9683 0.759–0.105 EP 40 0.2 6.1± 0.3 2.56 2.15 0.9951 1.89 22.23 0.9805 0.808–0.177 EP 50 0.2 6.1± 0.3 2.41 2.03 0.9944 1.72 34.12 0.9630 0.811–0.185 EP 60 0.2 6.1± 0.3 1.66 2.02 0.9941 1.86 15.58 0.9537 0.809–0.182
or “unfavorable.” The essential characteristic of a Langmuir isotherm can be expressed in terms of a dimensionless separa-tion factor or equilibrium parameter R (57), which is defined by relationship
R= 1
1+ K Ce
. [13]
According to the value of R the isotherm shape may be interpreted as follows:
Value of R Type of adsorption
R> 1.0 Unfavorable
R= 1.0 Linear 0< R < 1.0 Favorable
R= 0 Irreversible
The results given in Table 4 show that the adsorption of Cu2+ ion on the perlite is favorable.
From the adsorption data at various temperatures, the enthalpy change for Cu2+adsorption can be estimated from the van’t Hoff isochore (58, 59): ·∂ ln K ∂T ¸ θ= 1Hads RgT2. [14]
The subscriptθ means that the equilibrium constant at each tem-perature is measured at constant coverage. Under these condi-tions, from the Langmuir equation atθ = 0.5, K = 1/Ceand so
· ln Ce (1/T ) ¸ θ=0.5= 1Hads Rg , [15]
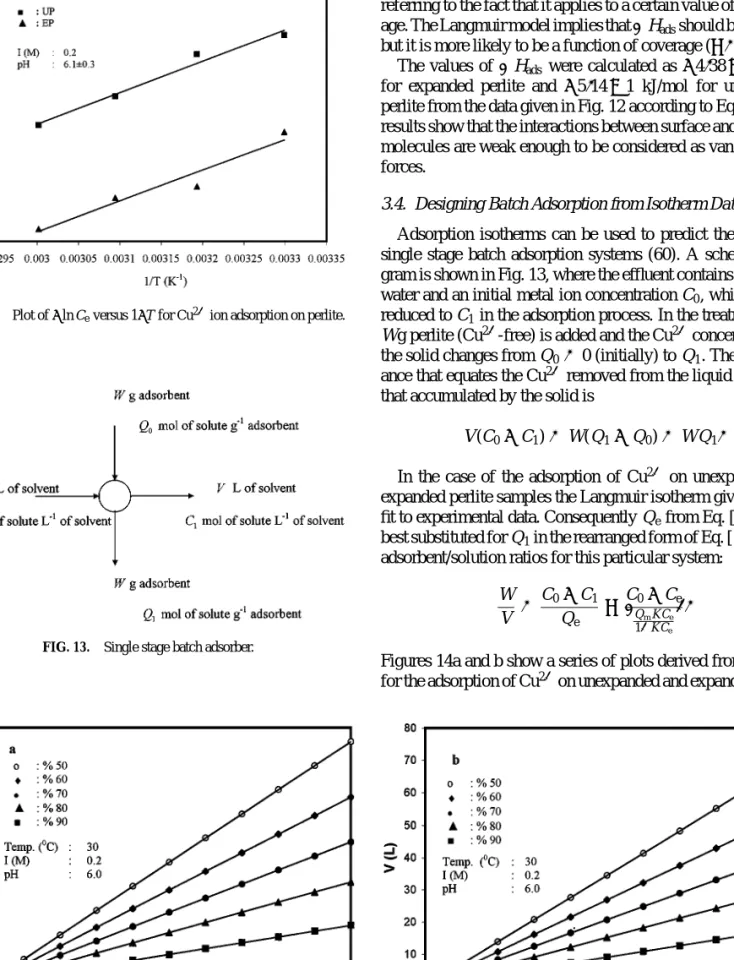
FIG. 12. Plot of−ln Ceversus 1/T for Cu2+ion adsorption on perlite.
FIG. 13. Single stage batch adsorber.
FIG. 14. Volume of effluent (V ) treated against adsorbent mass (W ) for different percentages of Cu2+removal: (a) UP and (b) EP.
Adsorption isotherms can be used to predict the design of single stage batch adsorption systems (60). A schematic dia-gram is shown in Fig. 13, where the effluent contains V liters of water and an initial metal ion concentration C0, which is to be
reduced to C1in the adsorption process. In the treatment stage W g perlite (Cu2+-free) is added and the Cu2+concentration on
the solid changes from Q0= 0 (initially) to Q1. The mass
bal-ance that equates the Cu2+removed from the liquid effluent to
that accumulated by the solid is
V (C0− C1)= W(Q1− Q0)= W Q1. [16]
In the case of the adsorption of Cu2+ on unexpanded and expanded perlite samples the Langmuir isotherm gives the best fit to experimental data. Consequently Qefrom Eq. [11] can be
best substituted for Q1in the rearranged form of Eq. [16], giving
adsorbent/solution ratios for this particular system:
W V = C0− C1 Qe ≡ C0− Ce ¡QmK Ce 1+K Ce ¢. [17]
Figures 14a and b show a series of plots derived from Eq. [17] for the adsorption of Cu2+on unexpanded and expanded perlite.
An initial Cu2+concentration of 1.6 × 10⁻⁵mol/L is assumed,
and the figures show the amount of effluent which can be treated to reduce the Cu2+ content by 50, 60, 70, 80, and 90% using
various masses of adsorbent.
4. CONCLUSIONS
The following points may be mentioned as the results of this study:
1. It has been found that the number of protons released per Cu2+ion adsorbed onto perlite samples was about 1 for both the
unexpanded and expanded perlites.
2. The experimental data were correlated reasonably well by the Langmuir adsorption isotherm and the isotherm parameters (Qmand K ) have been calculated.
3. The adsorbed amount of Cu2+ions slightly decreased with
increasing concentration of H2SO4used for the acid activation
for both perlite samples.
4. The adsorbed amounts of Cu2+ ions increased with in-creasing pH for both perlite samples.
5. The adsorbed amount of Cu2+ions slightly decreased with increase in ionic strength for both perlite samples.
6. The adsorbed amount of Cu2+ions decreased with increase in temperature for both perlite samples.
7. The dimensionless separation factor (R) showed that per-lite can be used for removal of Cu2+ions from aqueous solutions,
but unexpanded perlite is more effective. Its adsorption capacity is greater than that of expanded perlite.
8. The values of1Hadsfor unexpanded and expanded perlite
samples were calculated as−5.14 ± 1 and −4.38 ± 1 kJ/mol, respectively.
9. Perlite has considerable potential as an adsorbent of metal ions in a commercial system because of being cheap.
APPENDIX: NOMENCLATURE Qm Monolayer capacity of the adsorbent, mol g−1 K Adsorption constant, g mol−1
Ce Equilibrium metal ion concentration in solution,
mol L−1
Qe Equilibrium metal ion concentration on adsorbent,
mol g−1
KF Freundlich isotherm constant n Freundlich isotherm constant
R Dimensionless separation factor
1Hads Heat of adsorption, kJ mol−1 T Temperature, K
W Mass of adsorbent, g
V Volume of aqueous solution to be treated, L
C0 Initial metal ion concentration in aqueous solution,
mol L−1
x Proton stoichiometry
ACKNOWLEDGMENT
The work was financially supported by Balıkesir University Research Fund (Project 2000/1).
REFERENCES
1. Bereket, G., Aro˘guz, A. Z., and ¨Ozel, M. Z., J. Colloid Interface Sci. 187, 338 (1997).
2. Irwing Sax, N., “Handbook of Dangerous Materials,” pp. 218–222, 236. Reinhold, New York, 1951.
3. Gonzales-Davila, M., Santana-Casino, J. M., and Millero, F. J., J. Colloid
Sci. 137 (1990).
4. Huang, C. D., and Blankenship, D. W., Water Res. 18, 37 (1984). 5. Naylor, L. M., and Daugue, R. R., J. Am. Water Works Assoc. 67, 560 (1975). 6. Kahashi, Y. Y., and Imai, H., Soil Sci. Plant Nutr. 29, 111 (1983). 7. Battacharya, A. K., and Venkobachor, J. Environ. Eng. 110, 110 (1984). 8. Tewari, P. H., Campbell, A. B., and Lee, W., Can. J. Chem. 50, 1642 (1972). 9. Tewari, P. H., and Lee, W., J. Colloid Interface Sci. 52, 77 (1975). 10. Baumgarten, E., and Kirchhausen-D¨using, U., J. Colloid Interface Sci. 194,
1 (1997).
11. Tamura, H., Matijevic, E., and Meites, L., J. Colloid Interface Sci. 92, 303 (1983).
12. Fokkink, L. G. J., De Keizer, A., and Lyklema, J., J. Colloid Interface Sci.
135, 118 (1990).
13. Gray, M. J., and Malati, M. A., J. Chem. Technol. Biotechnol. 29, 135 (1979).
14. Malati, M. A., McEvoy, M., and Harvey, C. R., Surf. Technol. 17, 165 (1982).
15. Bye, G. C., McEvoy, M., and Malati, M. A., J. Chem. Technol. Biotechnol.
32, 781 (1982).
16. Bye, G. C., McEvoy, M., and Malati, M. A., J. Chem. Soc. Faraday Trans.
1 79, 2311 (1983).
17. Kosmulski, M., J. Colloid Interface Sci. 195, 395 (1997). 18. Kosmulski, M., J. Colloid Interface Sci. 211, 410 (1999).
19. Bruemmer, G. W., Gerth, J., and Tiller, K. G., J. Soil. Sci. 39, 37 (1988). 20. Johnson, B. B., Environ. Sci. Technol. 24, 112 (1990).
21. Rodda, D. P., Johnson, B. B., and Wells, J. D., J. Colloid Interface Sci. 161, 57 (1993).
22. Angove, M. J., Wells, J. D., and Johnson, B. B., J. Colloid Interface Sci.
211, 281 (1999).
23. Rodda, D. P., Wells, J. D., and Johnson, B. B., J. Colloid Interface Sci. 184, 564 (1996).
24. Kobal, I., Hesleitner, P., and Matijevic, E., Colloids Surf. 33, 167 (1988). 25. Srivastava, A., and Srivastava, P. C., Environ. Pollut. 68, 171 (1990). 26. ˙Inel, O., and Kayık¸cı, N., Do˘ga-TR.T. of Engineering and Environmental
Sciences, 332 (1990).
27. Onganer, Y., and Temur, C¸ ., J. Colloid Interface Sci. 205, 241 (1998). 28. Zhang, Q., Xu, Z., and Finch, J. A., J. Colloid Interface Sci. 175, 61 (1995). 29. Zhang, Q., Xu, Z., and Finch, J. A., J. Colloid Interface Sci. 169, 414 (1995). 30. Ludwing, C., and Schindler, P. W., J. Colloid Interface Sci. 169, 284
(1995).
31. Yang, J.-K., and Davis, A. P., J. Colloid Interface Sci. 216, 77 (1999). 32. Apak, R., G¨u¸cl¨u, K., and Turgut, M. H., J. Colloid Interface Sci. 203, 122
(1998).
33. G¨u¸cl¨u, K., and Apak, R., J. Colloid Interface Sci. 228, 238 (2000). 34. Farquhar, M. L., Charnock, J. M., England, K. E. R., and Vaughan, D. J.,
J. Colloid Interface Sci. 177, 561 (1996).
35. Du, Q., Sun, Z., Forsling, W., and Tang, H., J. Colloid Interface Sci. 187, 232 (1997).
36. Angove, M. J., Johnson, B. B., and Wells, J. D., J. Colloid Interface Sci.
204, 93 (1998).
37. Schlegel, M. L., Manceau, A., Chateigner, D., and Charlet, L., J. Colloid
47. M¨uller, B., and Sigg, L., J. Colloid Interface Sci. 148, 517 (1991). 48. Fokkink, L. G. J., DeKeizer, A., and Lyklema, L., J. Colloid Interface Sci.
118, 454 (1987).
49. Park, Y. J., Junk, K.-H., and Park, K. K., J. Colloid Interface Sci. 172, 447 (1995).
58. McKay, G., Otterburn, M. S., and Aga, A. J., Water, Air, Soil Pollut. 24, 307 (1985).
59. Hunter, R. J., “Introduction to Modern Colloid Science,” p. 168. Oxford, Sci. Pub, Oxford, England (1999).