I
n fields such as software engineering, telecommunications, and financial analysis, researchers and developers have commonly used graphs to model relational information. For example, many com-puter-aided software engineering (CASE) tools use graphs to model the dependencies between modules in a large program. (These graphs are typically drawn as diagrams in which each node—object—is a small rec-tangle with a text annotation inside and each edge—relations or links— is a line segment between a pair of nodes. Figure 1 shows an example of a program’s visualization.) Further examples of such diagrams are vari-ous UML diagrams for software mod-eling, data-flow diagrams, PERT charts, and Entity-Relationship (E-R) diagrams in database systems. Theusefulness of the relational model depends on whether the graph drawing, or layout, effectively conveys the rela-tional information to the users. A poorly drawn diagram confuses the application user, but a well laid out diagram helps the user comprehend the data.
Because user systems have grown larger and become more complicated, manually laying out graphs has become not only difficult and tedious but also ineffective in terms of human and computer resources. This has motivated a great deal of research in automatic graph drawing.1Since graphical user interfaces (GUIs) have improved and more state-of-the-art software tools have incorporated visual functions, interactive graph editing and diagramming facilities have become important components in visualization systems.
At Tom Sawyer Software (see http://www. tomsawyer.com), we have created two toolkits that allow developers to easily integrate graph visualization capabilities into custom software applications. The Graph Layout Toolkit (GLT) provides interfaces for Information Visualization
We describe the Graph
Layout Toolkit and Graph
Editor Toolkit, which provide
a framework for graph
visualization useful in a
broad array of application
areas.
Ugur Dogrusoz
Bilkent University
Qingwen Feng and Brendan Madden
Tom Sawyer Software
Michael Doorley Wilde Technologies Arne Frick Accenture
Graph
Visualization
Toolkits
Visualize Program main() { readFile(); … reportError(); … writeFile(); … } readFile() { readString(); … } readString() { readChar(); … } reportError() { writeString(); … } writeFile() { writeString(); … } writeString() { writeChar(); … } Main ReportError WriteFile ReadFile WriteString ReadString WriteChar ReadChar1
Visualization of a program’s call graph.modeling, drawing, and automatically laying out graphs. The Graph Editing Toolkit (GET) provides a customizable display and editing layer, which facilitates rapidly developing tools that visualize data in the form of graphs. (See the “Additional Graph Drawing Tools” sidebar for other approaches.)
In this article, we present an architectural overview of these tools and discuss the challenges encountered during implementation and integration of theory and research results into such tools. In particular, we discuss automatic graph layout and labeling algorithms and complexity management techniques. In addition, we present examples of applications using these tools.
Automatic graph layout
Graph layout comes in different flavors depending on the application type and the data being visualized. The graphs include trees (such as directory structures), directed graphs (such as PERT charts), and general graphs (such as network maps). Drawing styles include straight-line and orthogonal drawings (such as
data-base schema). Such differences between the graphs and drawing styles require highly specialized layout algo-rithms. For instance, algorithms used to perform a lay-out of a flowchart differ from those used for a database schema representation.
GLT provides a graph model and a drawing frame-work and offers four different layout styles: hierarchi-cal, orthogonal, symmetric, and circular (see Figure 2, next page). Each style addresses the needs of various software applications. We’ve put theoretical results into practice by first studying and improving them for gen-erality, efficiency, breadth, and extendibility. For instance, many popular layout algorithms can only han-dle a certain type of a graph (for example, simple con-nected graphs as opposed to disconcon-nected multigraphs) or have execution times not acceptable for an interac-tive graph visualization tool. In addition, we equipped each library with a set of tailoring options that facilitate customizing the layout algorithm. GLT is independent of any display or graphics software, thereby providing users with design flexibility.
over the past few decades have resulted in graph drawing tools and libraries in universities and the industry.
AGD is a library of algorithms for graph drawing (see http://www.mpi.sb.mpg.de/AGD).1The library offers a broad range of algorithms for 2D graph drawing, in particular planar drawing and planarization methods and tools for implementing new algorithms. AGD is an object-oriented, modular, and extendible library implemented in C++ and based on LEDA (see http://www.algorithmic-solutions.com) and Abacus.2
GDToolkit is a graph drawing toolkit designed to efficiently manipulate several graph types and to automatically draw them according to many different aesthetic criteria and constraints (see http://www. dia.uniroma3.it/~gdt). GDToolkit is composed of
■ the Graph Application Programming Interface (GAPI), an object-oriented C++ library providing the advanced devel-oper with a hierarchy of graph classes encapsulating as methods a wide set of graph algorithms;
■ the Batch Layout Generator (BLAG), a batch application that reads an input file describing the topology of the graph to be drawn, applies the algorithms and the constraints specified in a configuration file, and generates an output file defining a layout of the input graph; and
■ some interactive demos providing a graph editor and a set of advanced algorithms for automatic layout.
Graphviz is an open-source graph drawing system3that includes several components (see http://www.research.att. com/sw/tools/graphviz):
■ dot makes hierarchical layouts of directed graphs,
■ neato makes spring model layouts of undirected graphs,
■ lefty is a two-view graphics editor for technical pictures,
■ dotty is a customizable interface written in lefty,
7.6, and
■libgraph is the base library for graph tools.
Graphviz tools are standalone and can also be extended to create interfaces to external databases and systems. This usually involves writing dotty or tcldot scripts to customize the graph editor’s behavior and to program it to
communicate with external files or programs.
Other tools include Graphlet (http://www.infosun.fmi. uni-passau.de/Graphlet),4Graph Drawing Server (http:// www.cs.brown.edu/cgc/cgc-brown.html),5and
GraphPack.6
References
1. C. Gutwenger et al., Graph Drawing Algorithm Engineering with
AGD, tech. report TR-186-1-00-02, Algorithms and Data
Struc-tures Group, Inst. of Computer Graphics and Algorithms, Vienna Univ. of Technology, 2000.
2. M. Jünger and S. Thienel, Introduction to ABACUS – A
Branch-And-CUt System, tech. report 97.263, Univ. of Köln, Köln, Germany,
1997.
3. E.R. Gransner and S.C. North, “An Open Source Graph Visualiza-tion System and Its ApplicaVisualiza-tions to Software Engineering,”
Soft-ware Practice and Experience, vol. 30, no. 11, 2000, pp. 1203-1233.
4. M. Himsolt, “Graphlet: Design and Implementation of a Graph Editor,” Software: Practice and Experience, vol. 30, 2000, pp. 1303-1324.
5. S. Bridgeman, A. Garg, and R. Tamassia. “A Graph Drawing and Translation Service on the WWW,” Graph Drawing (Proc. GD 96), S. North, ed., Lecture Notes in Computer Science 1190, Springer-Verlag, Berlin, 1997, pp. 45-52.
6. M.S. Krishnamoorthy et al., “Graphpack: Design and Features,”
Software Visualization: Series on Software Engineering and Knowledge Engineering, P. Eades and K. Zhang, eds., vol. 7, 1996, pp. 83-99.
Hierarchical layout
The hierarchical layout library reveals precedence relations by positioning the nodes in a graph based on the direction in which edges are oriented (see Figure 2c). Nevertheless, it allows the existence of cycles and detects a minimal number of edges that are oriented against the hierarchy’s flow. Cycle detection makes the hierarchical library suited for reverse engineering and compiler applications. The layout algorithm that we use is based on the one described by Sugiyama, Tagawa, and Toda.2We can tailor the algorithm by choosing appro-priate parameters for graph orientation, node justifica-tion and alignment, and several spacing parameters. Its attractive features include orthogonal routing and port specification:
■ Orthogonal routing. This feature draws hierarchical
graphs in which edges run horizontally and vertical-ly along a grid (see Figure 2c). Flowcharts often use orthogonal routing.
■ Port specification. This feature allows for the
specifi-cation of attachment lospecifi-cations on nodes, which is important in many complex diagramming applica-tions where a node might contain several fields (see Figure 3).
The hierarchical library is versatile because many rela-tionships between objects are based on precedence. It’s particularly suited for drawing call graphs and for use in compiler development. Configuration management,
process modeling, and workflow are other areas for which the style is appropriate.
Orthogonal layout
The orthogonal layout library produces high-clarity drawings, using only horizontal and vertical line rout-ing (Figure 2b). It maintains at most one bend per edge, except in the case of reflexive edges. The library is par-ticularly useful in applications that require fast layout and don’t require drawings to show inherent hierarchi-cal structures. The orthogonal library’s efficient algo-rithms3produce drawings with relatively few crossings. It allows minimal stretching of nodes that have a high number of incident edges, and there’s no overlap between nodes or between nodes and nonincident edges. Users can set tailoring options to preserve the input node width and height as specified or to preserve the speci-fied aspect ratio. Tailoring controls also specify the spac-ing between parallel edges and between nodes.
The orthogonal drawing style is widely used in CASE tools. Consequently, this style has many applications in the areas of data and process analysis and design (such as database design, data warehousing, and business-process modeling), CAD, and object-oriented analysis and design.
Symmetric layout
The symmetric layout library uses force-directed heuristics4to expose the natural symmetry inherent in many graphs. The algorithm computes near-congruent drawings of isomorphic graphs, provides a uniform Information Visualization 3 9 38 8 38 3 9 8 3 3 33 3 39 8 8 9 8 3 9 3 8 9 8 8 8 83 8 8 8 8 88 89 9 9 9 93 9 3 3 9 9 9 9 98 99 (a) (b) (c) (d)
2
Examples of (a) circular, (b) orthogonal, (c) hierarchical, and (d) sym-metric layouts.node distribution, and produces drawings with rela-tively few edge crossings (Figure 2d).
The algorithm isn’t as efficient as those of the hierar-chical and orthogonal libraries, but it produces high-quality drawings when graphs are reasonably sparse and node sizes don’t vary widely. It has applications in net-work management, Web visualization, bioinformatics, and software engineering diagrams based on undirect-ed graphs, including E-R diagrams.
Circular layout
The circular layout library produces graph layouts that emphasize group structures. The layout algorithm partitions the nodes into clusters based on a number of flexible grouping methods.5It places each cluster of nodes on circles according to the logical interconnec-tion of these clusters (see Figure 2a). The circular library supports stable clustering techniques while respecting application-specific groupings. In addition, users can set minimum and maximum values for the number of nodes to be grouped in each cluster.
Many changes to the input graph have no effect on the clusters produced in subsequent layouts, resulting in draw-ings that remain relatively stable when changes are made. The circular layout technique mainly targets networking and systems management but is also useful in other areas where clustering is applicable and helpful in depiction of systems, such as in criminology and Web visualization.
Positioning edge labels
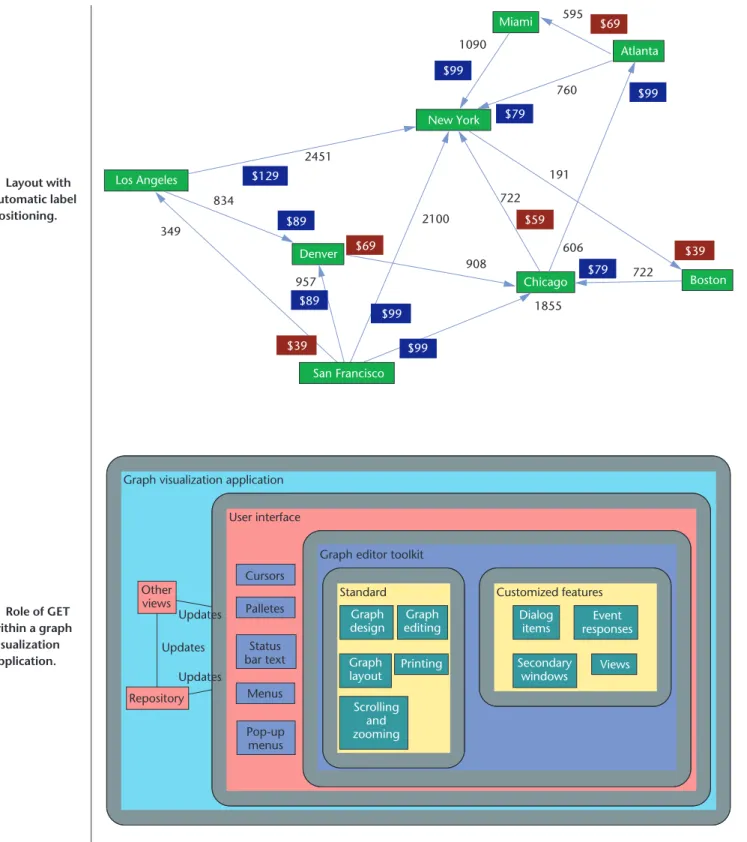
Just as diagram formatting is a time-consuming and monotonous task, so is positioning labels. Thus, GLT includes algorithms for automatically placing edge labels6(see Figure 4, next page). The algorithms strive to eliminate ambiguity and improve clarity and flexibility. A label associated with one edge mustn’t overlap any other edge or any node. Relationships between edges and labels should be easily identified without cluttering the drawing. Thus, GLT positions labels close to, but not overlapping, edges if possible. In addition, it provides considerable flexibility in meeting user constraints on the placement of labels with an extensive set of inter-faces. For example, in some applications, a label must be associated with the source node or target node of an edge.
Features of the edge labeling facility include support for automatic label positioning for all layout styles. GLT additionally supports an interactive labeling framework so that if the application lets users move edges, the edge labels are suitably repositioned. Finally, GLT includes interfaces to associate several labels with each edge and position them automatically. This is a recurring require-ment in diagrams. For example, E-R diagrams fre-quently need to provide separate edge annotations for each of the two end points of the edge.
GET architecture
In designing a generic toolset to enable the develop-ment of diagram-based visualization applications, we distinguished between standard, customizable, and application-specific user interface components in the GET architecture:
■Standard features are uniform across all applications and include graph display, scrolling and zooming, graph layout and editing (such as selection; drag; resize; and cut, copy, and paste), and printing. These features tend to be time-consuming to implement. In particular, graph layout is a difficult problem. GET not only provides layout, but its design ensures that layout concepts are easily integrated with the other common user interface features.
■Customizable features result from requirements that are common across all applications, but they’re sat-isfied in different ways. We provided a framework to enable the toolkit to be instantiated with a par-ticular set of views (for example, when a node has color, border thickness, and text fields), event (such as a mouse event) responses, dialog items, and sec-ondary windows. Implementing these requirements generally isn’t a difficult task for an experienced graphics programmer using a framework such as the Microsoft Foundation Class (MFC) library. Howev-er, the need for flexibility is important, so we must take care in the toolkit design to place flexibility over functionality.
■Application-specific components vary across appli-cations. Most graph visualization tools are complex, requiring interaction between a repository and a user interface. GET allows flexibility in application design. Finish Handle call Dial number 4444-555-6789 4444-555-1234 Voice Home John Smith Unknown sound 2 Voice detected 3 Hung up 4 Unknown response Action Phone answered Application stopped Unknown response Play message Start
3
An example of nodes with ports.It should slot into, rather than take over, the appli-cation. Application developers can include the toolk-it in a document/view archtoolk-itecture. In this case, the developer has complete control over the document design and can use the toolkit’s graph window as a view. The application is then free to deal with issues such as interacting with the repository, providing other views (such as text browsers) of the reposito-ry and user interface (such as menu, cursor, and palette design).
Figure 5 illustrates the role played by these compo-nents in a typical graph visualization application. Fig-ure 6 shows a GET sample application that application developers tailor to their requirements.
Complexity management
A single graph is often insufficient to represent infor-mation because of its overwhelming size or limitations imposed by application semantics.7We can organize such information to span several graphs with relation-Information Visualization
4
Layout with automatic label positioning. Miami 595 1090 $69 $99 Atlanta $99 $79 New York 2451 $129 Los Angeles 349 834 760 191 722 $59 606 $89 $69 Denver 957 908 1855 Chicago $79 722 $39 Boston $89 $39 $99 $99 2100 San FranciscoStandard Customized features Graph editor toolkit
User interface Graph visualization application
Scrolling and zooming Graph layout Graph editing Graph design Printing Dialog items Event responses Secondary windows Views Cursors Palletes Status bar text Menus Pop-up menus Updates Updates Updates Repository Other views
5
Role of GET within a graph visualization application.problems: partitioning, visualizing the navigation struc-ture, and simplification.
Partitioning
How can we compose such a navigation structure? There are two extremes. In some cases, the partition-ing is imposed, for example, by the development method for leveling data-flow diagrams. In other cases, we can apply techniques such as graph partitioning algorithms. Many applications, such as in software reengineering, can use techniques from both extremes.7 GLT provides minimal support for partitioning.
Visualizing the navigation structure
When visualizing the navigation structure, we can consider three levels of increasing complexity:
■ Navigation through multiple windows. In this case, a
node in a graph navigates to a child graph. The appli-cation can show the child graph in a different win-dow. This doesn’t present a layout problem because a layout is never performed on more than one graph at a time.
■ Navigation through nesting. This model, supported by
both GLT and GET, lets each graph have an independent coordinate space but lets a child graph be (optionally) drawn nested within its parent node (see Figure 7).
■ Compound graphs. According to this model, an edge
can connect nodes in different graphs. We optional-ly draw a child graph nested within its parent node. This requires specialized layout algorithms that pro-vide techniques for routing the intergraph edges.
Simplification
In some cases, it’s impossible to use navigation, prob-ably because the semantics of the application don’t allow
porarily remove nodes and edges from the display and
6
Graph Editor Toolkit example application.Expanded Collapsed
7
Example of nesting capability.Hidden Unhidden Folded Unfolded Folder (a) (b)
8
Hiding and folding examples.optionally replace them with a new folder node. We can later reintroduce them (Figure 8).
This simple technique is powerful. For example, it lets a call-graph user hide a routine that’s called by almost every other routine or fold together all of the functions that come from the same library. Both of these tech-niques let the user and the application developer imple-ment their concepts of abstraction.8
Applications
We designed GLT and GET to let developers quickly integrate graph visualization functionality into an application, enhancing the usability of their tools. Here, we present several example uses of our toolkits. For example, the network management software applica-tion LANsurveyor—a network management software application from Neon Software for the Macintosh that maps AppleTalk networks—uses GLT to automatically display and navigate through the logical relationships between network objects such as nets, routers, and end
nodes (see Figure 9).
In another application, ESP Work-station, the GUI for Cybermation’s ESP Workload Manager product, uses GET to create a diagrammatic user interface for visually depicting large-scale job scheduling (see Fig-ure 10). Casting the problem as a graph results in thousands of nodes that represent tasks, and each task node can have up to 100 outgoing edges that represent dependencies with other tasks. In this application, hierarchical layout was the appro-priate choice of style to give users a clear visual picture of how jobs are organized and how each job affects the other. The GET handles func-tions such as object positioning, line routing, and user interaction.
Lastly, ERwin is a data modeling application (from Logic Works) that uses GLT to support interactive visu-al database rule design. Our auto-matic layout algorithms help eliminate undesirable visual arti-facts such as table overlap. Auto-matic layout increases the rate at which designers can make changes to the data model, letting them visu-alize the addition or deletion of tables as well as any edited relation-ships between these tables. The GLT-based interface improves designers’ understanding of the model.
Challenges
Several challenging problems arise in the development of graph visualization techniques. We believe that these problems are important, and solving them will improve next-generation graph visualization applications:
■ Incremental layout. It’s crucial to preserve a mental
picture of a graph’s drawing over successive layouts. It can be distracting to make a slight modification, perform a layout, and have the resulting drawing sig-nificantly differ from the previous drawing. We’ve developed incremental layout algorithms for our sym-metric and hierarchical libraries and are working on supporting them for other libraries.
■ Constraints. Even though most of the information to
be drawn is logical, many applications enforce cer-tain physical placement requirements on nodes. These requirements range from fixing one or both of the location coordinates of some objects to clustering a specified group of objects. Limited support for con-straints, such as restricting a node to a specific layer in a layered hierarchical drawing, is available with GLT. We’re working on a more generalized constraint framework for all our libraries.
Information Visualization
9
Screen shot from LANsur-veyor.10
Screen shot from ESP Workstation.Courtesy of Neon Software
lems we referred to earlier. Adding these techniques to the toolsets will significantly advance the value of graph visualization.
■ Graphical syntax support. We’ll extend GET to let the
application developer specify which types of objects can have relationships. For example, a requirement in the design of an application to draw data-flow dia-grams might be to disallow a data flow between two data stores. The current model doesn’t have direct support for this. It requires a richer form of subtyp-ing than the notion of views GET currently supports.
More functionality addressing these challenging problems have been integrated into GLT and GET ver-sion 4.0, and more work is underway. ■
Acknowledgment
The National Institute of Standards and Technology (NIST) Advanced Technology Program grant, number 70NANB5H1162, partially supported this research.
References
1. G. DiBattista et al., Graph Drawing, Algorithms for the
Visu-alization of Graphs, Prentice-Hall, Upper Saddle River, N.J.,
1999.
2. K. Sugiyama, S. Tagawa, and M. Toda, “Methods for Visual Understanding of Hierarchical Systems,” IEEE Trans. Systems,
Man, and Cybernetics, vol. 21, no. 2, Feb. 1981, pp. 109-125.
3. T.C. Biedl, B.P. Madden, and I.G. Tollis, “The Three-Phase Method: A Unified Approach to Orthogonal Graph Draw-ing,” Graph Drawing (Proc. GD 97), G. DiBattista, ed., Lec-ture Notes in Computer Science 1343, Springer-Verlag, Berlin, 1998, pp. 391-402.
4. T. Kamada and S. Kawai, “An Algorithm for Drawing Gen-eral Undirected Graphs,” Information Processing Letters, vol. 31, no. 1, Apr. 1989, pp. 7-15.
5. U. Dogrusoz, B. Madden, and P. Madden, “Circular Layout in the Graph Layout Toolkit,” Graph Drawing (Proc. GD 96), S. North, ed., Lecture Notes in Computer Science 1190, Springer-Verlag, Berlin, 1997, pp. 92-100.
6. U. Dogrusoz et al., “Edge Labeling in the Graph Layout Toolkit,” Graph Drawing (Proc. GD 98), S.H. Whitesides, ed., Lecture Notes in Computer Science 1547, Springer-Ver-lag, Berlin, 1998, pp. 356-363.
7. M. Doorley and A. Cahill, “Experiences in Automatic Lev-elling of Data Flow Diagrams,” Proc. 4th Workshop Program
Comprehension, IEEE CS Press, Los Alamitos, Calif., 1996,
pp. 218-229.
8. D. Kimelman et al., “Dynamic Graph Abstraction for Effec-tive Software Visualization,” Australian Computer J., vol. 27, no. 4, Nov. 1995, pp. 129-137.
For further information on this or any other computing topic, please visit our Digital Library at http://computer. org/publications/dlib.
professor of computer engineering at Bilkent University, Ankara, Turkey. He was the Vice President of Engi-neering as well as a researcher and developer at Tom Sawyer Software for three years. His research interests include graph visualization, combinatorial optimization, and bioinformatics. He received his PhD from the Com-puter Science Department of Rensselaer Polytechnic Insti-tute, Troy, New York.
Qingwen Feng is a product man-ager at Tom Sawyer Software where she works on the research and devel-opment of relational information visualization technologies. She has a PhD in computer science from the University of Newcastle, Australia. She was the recipient of the 1997 Australian Distinguished PhD Dissertation in Computer Science Award.
Brendan Madden is the CEO of Tom Sawyer Software and has spent 15 years developing commercial quality graph visualization systems. He previously worked at the IBM TJ Watson Research Center, where he was the lead designer and developer of two of IBM’s graph layout systems. He has a BS in engi-neering physics from Cornell University.
Michael Doorley is a software engineer at Wilde Technologies in Dublin, Ireland, where his interests include modeling and visualization of component-based systems. He previously worked in graph layout and editing at Tom Sawyer Soft-ware and had done research in the softSoft-ware reengineer-ing field. He has a PhD in computer science from the University of Limerick.
Arne Frick is a manager with Accenture. At the time of this research, he was a research staff member at Tom Sawyer Software, where he applied his research in Symmetric graph layout techniques in the context of a commercial prod-uct. He has a PhD in informatics from the University of Karlsruhe, Germany.
Readers may contact Ugur Dogrusoz at Bilkent Univ., Computer Eng. Dept., Office EA-528, Ankara 06533, Turkey, email [email protected].