Science Education International
Vol.22, No.4, December 2011 (Special Issue), 274-281
Turkish students’ career choices in engineering: Experiences from Turkey
Bulent CavasDokuz Eylul University, Turkey Jale Cakiroglu
Middle East Technical University, Turkey Pinar Cavas
Ege University, Turkey Hamide Ertepinar
Istanbul Aydin University, Turkey
Abstract
The shortfall of young people, particularly women, in the field of Science, Mathematics and Engineering (SME) has been shown in many national studies. Schreiner and Sjoberg (2007) indicated that boys outnumber girls in physics and engineering studies, while the gender balance is shifted towards the girls in studies including medicine, veterinary medicine, environmental science and biology. This paper sets out to explore the issues, which are relevant to understanding these gender differences and the factors affecting students’ career choices. The instrument called “Vilje-con-valg” was used to obtain data from 1635 first year students from eight different departments- mechanical, civil, computer, electrical-electronics, industrial, chemical, environmental and food engineering at 21 universities in Turkey. The results of this study showed that (i) most of the students decided on career options during their last grade level in high school or after graduation from high school, (ii) students were influenced by the jobs that they were interested in; their talents and abilities that they wanted to use and job prospects after graduation, (iii) internet, popular scientific magazines, books and movies were important factors in choosing their careers and (iv) the creativity and independence in the jobs are important considerations that influence career decisions.
Keywords: Career Choosing, Engineering, Gender, University Students
Introduction
In the last 60 years, many sociological studies have been conducted to explore career choice in society. The concept of career was defined by Wilensky (1960) as “a succession of related jobs, arranged in a hierarchy of prestige, through which persons move in an ordered predictable sequence” (p.127). The early studies showed that careers were a process by which the organizations rebuilt their systems (Gunz, 1989). Later, studies shifted to look at career routes.
The reporting of gender issues in terms of career choice started to take place in the studies during the 1980s. Women‟s career situations became more widely recognized and
explore issues of women and career (Silverstone & Ward, 1980; Spencer & Podmore, 1987; cited in Evetts, 1996, p.4). During the 1990s and 2000s, the lack of women particularly in the fields of science and engineering became one of the important issues and was addressed in many studies and reports (EU, 2004; Jacobs & Simpkins, 2006; NSB, 2006). According to Dick and Rallis (1991), there has been an increase in the representation of women employed in the scientific and engineering professions over the last 15 years, but still women‟s participation in these careers remains disproportionately low.
The reasons for “why more women don‟t choose careers in engineering and science” has been reported in many studies during the last few decades. Like many other countries, very few women in Turkey become engineers and a woman who considers engineering as a career often faces disapproving reactions especially from their families, friends, and future colleagues. In many societies, the masculine image of science and technology is an important factor in women's career decisions about these fields (Newton, 1987).
Although some engineering departments (like mechanical, civil, electrical-electronics etc), have the lowest percentage of female students women are well represented in other engineering departments (like food, chemical and environmental). As Figure 1 shows, while the percentages of female students in food engineering and chemistry engineering are 61.88 % and 53.26%, the female percentage for mechanical engineering, civil engineering and electrical and electronics engineering are 6.48%, 9.95% and 10.5% respectively. Basically these results show that there are significant differences between many engineering departments in terms of female student numbers. In a study carried out by Zengin (2002), the engineering departments were categorized into three groups. The „masculine‟ engineering departments are mechanical, civil, electrical and electronics, petroleum and metallurgical, the „feminine‟ engineering departments are food, chemical and environmental. The „mixed sex groups‟ are geological, industrial, nuclear energy, computer, aeronautical, mining, hydrogeological and geophysical” (p.402).
Figure 1. Distribution of the Different Engineering Students Regarding their Gender in
Methodology Sample
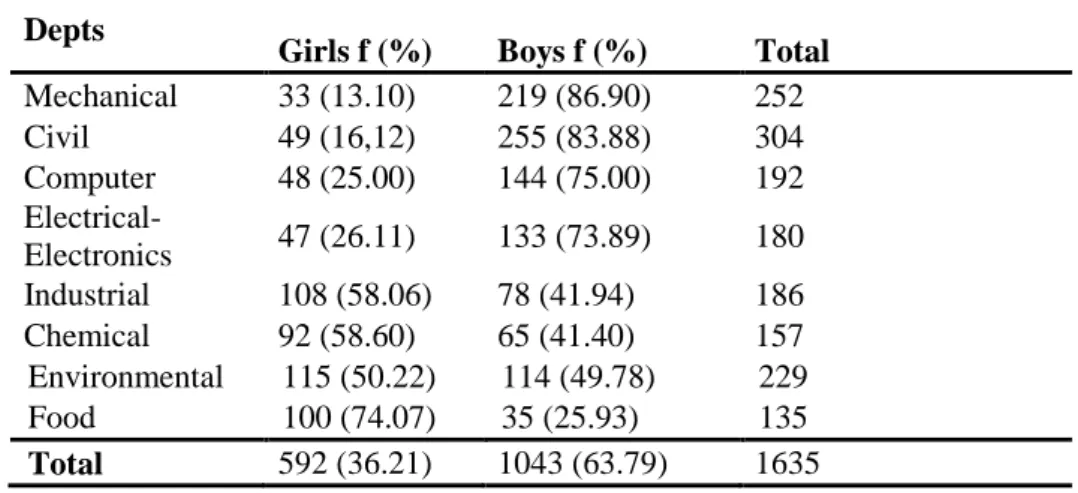
In the study reported in this article, the sample consisted of 1635 first year students from eight different departments- mechanical, civil, computer, electrical-electronics, industrial, chemical, environmental and food engineering at 21 universities from all over Turkey. Of the 1635 students (1043 male, 592 female) who completed the questionnaire, 39% of the students were 19 years old or younger, 61% of them were 20 years old and older. Table 1 shows the number of the students by their departments and gender.
Table 1. Sample of the study according to departments and gender Depts
Girls f (%) Boys f (%) Total
Mechanical 33 (13.10) 219 (86.90) 252 Civil 49 (16,12) 255 (83.88) 304 Computer 48 (25.00) 144 (75.00) 192 Electrical-Electronics 47 (26.11) 133 (73.89) 180 Industrial 108 (58.06) 78 (41.94) 186 Chemical 92 (58.60) 65 (41.40) 157 Environmental 115 (50.22) 114 (49.78) 229 Food 100 (74.07) 35 (25.93) 135 Total 592 (36.21) 1043 (63.79) 1635 Instrument
In the study reported in this article, a standard survey methodology from the quantitative research tradition was used for data collection. The instrument was modified and translated into the Turkish Language from the “Vilje-con-valg” project‟s questionnaire which was developed by Schreiner and Henriksen (2008). Detailed information about the “Vilje-convalg” project can be found at the http://www.naturfagsenteret.no/vilje-con-valg/. The instrument consists of twelve questions about demographic variables, eleven sections including Likert type questions and one open ended question. In this paper, the data from five sections are analyzed and presented. Reliability of the instrument was determined by computation of Chronbach‟s alpha. The standardized alpha scores for five sections are presented in Table 2.
Table 2. Reliability analysis of the sub-scales
Sub-scale Number of the Items Cronbach Alpha Section 3 7 .77 Section 5 12 .87 Section 7 12 .89 Section 9 13 .89 Section 10 23 .89
As can be seen from Table 2, the Turkish version of the Vilje-con-valg is a valid and reliable instrument that can be used to measure students‟ career choices.
Findings
We report on the results from the first year engineering students‟ career choices to determine some important factors that influenced their career choices. Table 3 shows the students‟ decision stage when choosing a career.
Table 3. Students‟ career decision stages
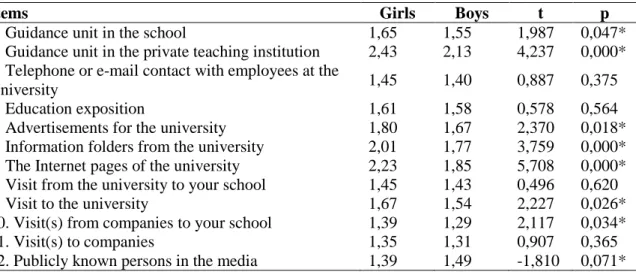
CAREER DECISION STAGES Grade 1-5 Grade 6-8 Grade 9 Grade 10 Grade 11 After Graduation After working I don’t know G (N) B (N) G (N) B (N) G (N) B (N) G (N) B (N) G (N) B (N) G (N) B (N) G (N) B (N) G (N) B (N) Mechanic 0 7 1 15 2 21 5 25 5 29 18 95 0 7 2 15 Civil 0 12 1 11 3 19 3 22 8 40 33 121 0 6 1 20 Computer 1 16 1 21 3 15 5 12 1 14 30 53 1 1 6 11 El.-Elects. 0 6 1 10 3 6 1 8 5 21 33 69 0 2 2 10 Industrial 0 1 3 0 7 4 8 12 23 13 62 42 2 4 3 2 Chemical 0 0 1 0 1 2 9 7 19 8 50 36 0 2 10 10 Environ. 0 0 1 1 0 3 0 1 4 8 96 76 1 7 12 17 Food 0 0 0 1 0 2 0 2 8 6 82 16 3 1 6 7 Total 1 42 9 59 19 72 31 89 73 139 404 508 7 30 42 92 Table 3 indicates that most of the students decided their careers after graduating from high school. At the elementary level (from Grades 1 to 5), almost none of the students had made a decision about selecting a career. Only 0.1% of the girls and 4% of the boys had decided their careers at elementary level. These percentages did not show any change during the primary grades (from Grades 6 to 8). When high school years were considered (from Grades 9 to 11) most of the students had decided upon their careers at Grade 11. About 68% of girls and 49% of boys had selected a career path. In the next section we consider gender issues. The effect of the information sharing activities and documents on students‟ career choice according to their gender was analysed by using the independent t-test. Information sharing activities and documents included guidance units, contact with employees, information about the university and visits (both from universities to the school and from the school to the universities). Table 4 presents the data regarding the effect of information sharing activities and documents, on an item by item basis and from a gender perspective.
Table 4. Mean scores according to gender for each item related to informative activities and
documents effects
Items Girls Boys t p
1. Guidance unit in the school 1,65 1,55 1,987 0,047*
2. Guidance unit in the private teaching institution 2,43 2,13 4,237 0,000* 3. Telephone or e-mail contact with employees at the
University 1,45 1,40 0,887 0,375
4. Education exposition 1,61 1,58 0,578 0,564
5. Advertisements for the university 1,80 1,67 2,370 0,018* 6. Information folders from the university 2,01 1,77 3,759 0,000* 7. The Internet pages of the university 2,23 1,85 5,708 0,000* 8. Visit from the university to your school 1,45 1,43 0,496 0,620
9. Visit to the university 1,67 1,54 2,227 0,026*
10. Visit(s) from companies to your school 1,39 1,29 2,117 0,034*
11. Visit(s) to companies 1,35 1,31 0,907 0,365
Results showed that significant differences were found in almost all items in favour of girls except items 3, 4, 8 and 11. Girls, in comparison with boys were influenced by information sharing activities and documents. It would appear that the following:“guidance unit in the private teaching institution”; “the Internet pages of the university”; and “information folders from the university” were influential factors in helping girls to choose their careers. Among the factors, both girls and boys had high scores for item 2. This suggests that the guidance unit in private teaching institutions has a significant effect on influencing students‟ career choices.
In order to analyse the effect of various media on students‟ career choices, we used a t-test. The results are given in Table 5.
Table 5. Mean scores according to gender for each item related to media effects
Items Mean Scores t p
Girls Boys
1. Newspaper articles 1,94 1,87 1,094 0,274
2. Popular science book and magazines 2,29 2,25 0,567 0,571
3. Other books and magazines 2,14 2,03 1,688 0,092*
4. Posters and advertisements 2,12 1,88 3,825 0,000*
5. İnternet 3,16 2,81 4,414 0,000*
6. Computer games 1,32 1,75 -7,028 0,000*
7. Museum/science center 1,53 1,64 -1,837 0,066
8. Popular science television channels/programs 1,98 2,18 -2,609 0,009*
9. Films and TV series 1,68 1,79 -1,710 0,088
10. The science week in the schools 1,53 1,54 -0,266 0,790
11. TÜBİTAK 1,69 1,76 -1,003 0,316
12. Science and Technique magazine 2,13 2,13 -0,002 0,998
As can be seen from Table 5,“Internet” had a significant influence on students choosing career options. However, “The science week in the schools” influenced their career choice very little. Significant differences were found in the items 3, 4, 5, 6, and 8 in terms of gender. While some factors such as “other books and magazines”, “posters and advertisements” and “internet” influenced girls‟ career choices, boys were more influenced by “computer games” and “popular science television channels/programs”.
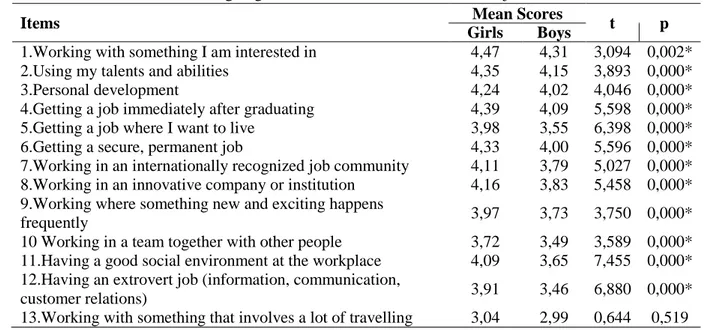
Table 6 and Table 7 indicate mean scores of items related to students‟ ideas about the importance of factors concerning their future job prospects. It is clear from Table 6 that students‟ main focuses are on: the jobs they are interested in; their talents and abilities that they want to use and finding a job after graduation. Significant differences were found (except for item 13) between genders in favour of girls.
In Table 7 items 3, 5, 6, 11, 13, 15, and 16, are shown to have a greater influence than the other items. “Making my own decisions”; “Working creatively” and “Designing and creating something new were taken into account by students. The nine items (7, 9, 12, 18, 19, 20, 21, 22, and 23) were important factors which boys prioritise, and the rest of the items (except 10) were factors which girls prioritise in their future jobs. Significant differences were found in almost all items between genders in favour of girls except for items 9, 12, 18, 19, 20, 21, 22 and 23.
Table 6. Mean scores according to gender for each item related to future job
Items Mean Scores t p
Girls Boys
1.Working with something I am interested in 4,47 4,31 3,094 0,002*
2.Using my talents and abilities 4,35 4,15 3,893 0,000*
3.Personal development 4,24 4,02 4,046 0,000*
4.Getting a job immediately after graduating 4,39 4,09 5,598 0,000* 5.Getting a job where I want to live 3,98 3,55 6,398 0,000*
6.Getting a secure, permanent job 4,33 4,00 5,596 0,000*
7.Working in an internationally recognized job community 4,11 3,79 5,027 0,000* 8.Working in an innovative company or institution 4,16 3,83 5,458 0,000* 9.Working where something new and exciting happens
frequently 3,97 3,73 3,750 0,000*
10 Working in a team together with other people 3,72 3,49 3,589 0,000* 11.Having a good social environment at the workplace 4,09 3,65 7,455 0,000* 12.Having an extrovert job (information, communication,
customer relations) 3,91 3,46 6,880 0,000*
13.Working with something that involves a lot of travelling 3,04 2,99 0,644 0,519
Table 7. Mean scores according to gender for each item related to future job
Items Mean Scores t p
Girls Boys
1. Helping other people 3,86 3,77 1,516 0,130
2. Taking into consideration a sustainable development, justice
and protection of the environment 3,95 3,71 4,146 0,000*
3. Working with something that is important for society 4,04 3,88 2,943 0,003* 4. Working with something that fits my beliefs and values 3,68 3,44 3,414 0,001* 5. Working with something I find meaningful 4,07 3,90 3,000 0,003*
6. Making my own decisions 4,31 4,15 3,077 0,002*
7. Working independently of other people 3,42 3,50 -1,299 0,194
8. Making lots of money 3,96 3,80 2,739 0,006*
9. Getting TV or media exposure 2,08 2,37 -4,220 0,000*
10. Getting leadership responsibility 3,71 3,72 -0,147 0,883 11. Working with something practical 4,05 3,97 1,404 0,161 12. Working with something easy and simple 2,39 2,56 -2,684 0,007* 13. Developing new knowledge and insight 4,03 3,87 2,739 0,006*
14. Doing research 3,99 3,81 3,190 0,001*
15. Working creatively 4,15 4,08 1,175 0,240
16. Designing and creating something new 4,12 4,07 0,860 0,390 17. Creating something that means something to other people 3,93 3,81 2,114 0,035*
18. Having lots of leisure time 2,46 2,65 -2,889 0,004*
19. Working with tools 3,04 3,32 -4,066 0,000*
20. Building or repairing things 3,05 3,58 -7,724 0,000*
21. Developing technology for renewable energy 3,48 3,60 -1,635 0,102 22. Developing computer or communication technology 3,19 3,56 -5,018 0,000*
23. Developing other technology 3,39 3,65 -3,751 0,000*
Results
The study revealed that the first year Turkish engineering students identify their career choices in the period that falls within the last grade of high school and after graduation from high school. This study revealed that the students identify their career choices just before the
university education level. This may be because sufficient guidance is not provided to the students at the primary and high school education level. For this reason, necessary information and guidance should be given to the students starting at the primary education level.
Students’ career choices are influenced by numerous factors. There are variations in the level of influence each factor has on male and female students’ career choices. It was shown that girls, in comparison with boys were influenced by information sharing activities and documents such as guidance units, contact with employees, information about university and visits (both to and from universities). Popular science books, magazines, science TV channels, science and technology magazine and mainly Internet seemed to have a significant influence on the Turkish students‟ career choices.
When it comes to career options, Turkish students were particularly influenced by the jobs they are interested in, their talents and abilities that they want to use and finding a job after graduation. In addition the creativity and independence in the jobs were important elements that Turkish students think about when considering their careers for the future.
Based on the conclusions that career choices were influenced by the guidance units, this study recommends that guidance teachers should provide students a wide range of career information on all the available careers so that they can be able to explore widely before making their choices. More importance and consideration should be given to the influence of the media, Internet and web pages on career choices. The Internet has a strong impact on the today‟s youth. Universities must prepare and design web pages to inform young people about possible career choices. In this way the students may have accurate information about occupational opportunities to help them make appropriate career choice.
Acknowledgements
The authors would like to thank TUBITAK (Program-2218) and ODTU-DOSAP Program for their supports and Camilla Schreiner and Ellen Karoline Henriksen for providing “Vilje-con-valg”questionnaire.
References
European Union (2004). Europe needs more scientists! Brussels: European Commission, Directorate-General for Research, High Level Group on Human Resources for Science and Technology in Europe.
Evetts, J. (1996). Gender and career in science and engineering. London: Taylor and Francis. Ginzberg, E., Ginsburg, S. W., Axelrad, S., & Herma, J. R. (1951). Occupational choice: An
approach to a general theory. New York: Columbia University Press.
Gunz, H. (1989). The dual meaning of managerial careers: Organizational and individual levels of analysis. Journal of Management Studies, 26(3), 225-250.
Jacobs, J. E., & Simpkins, S. D. (2006). Leaks in the pipeline to math, science, and technology careers. San Francisco: Jossey-Bass.
National Science Board (NSB) (2006). Research and development: Funds and technology linkages. Science and Engineering Indicators 2006. Arlington, VA: National Science Foundation.
Newton, P. (1987). “Who becomes an engineer?” In Spencer, A. and Podmore, D. (Eds), In a Man‟s World, London: Tavistock Publishing.
Schreiner, C., & Sjøberg, S. (2007). Science education and youth's identity construction - two incompatible projects? In D. Corrigan, Dillon, J. & Gunstone, R. (Eds.), The Re-emergence of values in the science curriculum. Rotterdam: Sense Publishers.
Schreiner, C., & Henriksen, E. K. (2008). Survey about educational choices. Vilje-con-valg.
Retrieved 30th August 2011 from
http://www.naturfagsenteret.no/binfil/download.php?did=6788
Zengin, B. A. (2002). Women in engineering education in Turkey: Understanding the gendered distribution. International Journal of Engineering Education, 18 (4), 400-408. Wilensky, H. (1960). Work, careers, and social integration. International Social Science, 12,