T.C
ISTANBUL AYDIN UNIVERSITY INSTITUTE OF SOCIAL SCIENCES
COUNTRY RISK ASSESSMENT BY APPLYING MULTI-CRITERIA DECISION-MAKING METHODS: A CASE STUDY RANKING COUNTRIES
IN THE MIDDLE EAST & NORTH AFRICA
THESIS
Ahmad MOHAMMADI DEHCHESHMEH
Department of Business Business Management Program
Thesis Advisor: Assist. Prof. Dr. Nima MIRZAEI
T.C
ISTANBUL AYDIN UNIVERSITY INSTITUTE OF SOCIAL SCIENCES
COUNTRY RISK ASSESSMENT BY APPLYING MULTI-CRITERIA DECISION-MAKING METHODS: A CASE STUDY RANKING COUNTRIES
IN THE MIDDLE EAST & NORTH AFRICA
THESIS
Ahmad MOHAMMADI DEHCHESHMEH (Y1512130004)
Department of Business Business Management Program
Thesis Advisor: Assist. Prof. Dr. Nima MIRZAEI
i FOREWORD
This master thesis where written during the time-period from May 2017 until June 2018 under the teaching supervision of Assist. Prof. Dr. Nima MIRZAEI.
The intent of the thesis is to rank countries in the Middle East and North Africa using Multi-Criteria Decision-Making Methods, TOPSIS, ELECTRE, and PROMETHEE. Hereby I want to thank my supervisor of being a great help during the development of this thesis.
ii ABBREVIATIONS
MCDM : Multi-Criteria Decision Making MODM : Multi-Objective Decision Making MADM : Multi-Attribute Decision Making MENA : Middle East and North Africa UN : United Nation
IMF : The World Bank
DEA : Data Envelopment Analysis GDP : Gross Domestic Product SFA : Stochastic Frontier Analysis BI : Blacksmith Index
EPA : Environmental Protection Agency FSE : Fuzzy Synthetic Evaluation PPP : Purchasing Power Parity WQI : Water Quality Index
OECD : Organization for Economic Cooperation and Development TOPSIS : Technique for Order Preference by Similarity to Ideal Solution ELECTRE : ELimination Et Choix Traduisant la REalité
PROMETHEE : The Preference Ranking Organization METhod for Enrichment Evaluations
GAIA : Graphical Astronomy and Image Analysis SAFE : Sustainability Assessment by Fuzzy Evaluation
iii TABLE OF CONTENTS FOREWORD...………i ABBREVIATIONS..……….………..ii TABLE OF CONTENTS..………....iii LIST OF TABLES..………...iv LIST OF FIGURES………..………..v ÖZET...………...vi ABSTRACT………...ivi 1. INTRODUCTION ... 1 1.1 Study Topic ... 1 1.2 Purpose of Thesis ... 1
1.3 The Middle East and North Africa ... 2
2. LITERATURE REVIEW ... 4
2.1 Multi-Criteria Decision Making (MCDM) ... 7
2.1.1 Technique for Order Preference by Similarity to Ideal Solution (TOPSIS) by Hwangand Yoon 1982... 10
2.1.2 ELimination Et Choix Traduisant la REalité (ELECTRE) by Benayaoun et al. 1966 ... 12
2.1.3 The Preference Ranking Organization METhod for Enrichment Evaluations (PROMETHEE) by Brans Jean-Poerre 1982 ... 13
3. METHODOLOGY ... 17
3.1 TOPSIS Hwangand Yoon 1982 ... 17
3.2 ELECTRE by Benayaoun et al. 1966 ... 18
3.3 PROMETHEE ... 21
3.4 Equal Weight Method ... 23
4. DATA COLLECTION ... 24 4.1 Countries ... 25 4.2 Indicators ... 26 5. DISCUSSION RESULTS ... 30 5.1 TOPSIS ... 30 5.2 ELECTRE ... 34 5.3 PROMETHEE ... 36 6. CONCLUSION ... 44 REFERENCE ... 46 RESUME ... 52
iv LIST OF TABLES
Table 2.1: The Difference Between MODM & MADM ... 8
Table 2.2: The MCDM Methods Used in Different Fields ... 16
Table 3.1: The Formulas Used for Each Method ... 24
Table 4.1: The Selected Countries in The MENA (Alternatives) ... 26
Table 4.2: The Selected Indicators (Criteria) ... 27
Table 4.3: The Data Collected from the Data Banks ... 28
Table 4.4: The Data Collected from the Data Banks ... 29
Table 5.1: The Ideal and Non-ideal Distances results using TOPSIS ... 31
Table 5.2: Ranking the Middle East and North Africa countries using TOPSIS ... 32
Table 5.3: Ranking the Middle East and North Africa countries using ELECTRE . 34 Table 5.4: Ranking the Middle East and North Africa countries using PROMETHEE ... 36
v LIST OF FIGURES
Figure 1.1: The Middle East and North Africa Geographic Map ... 2
Figure 2.1: The Multi-Criteria Decision-Making Classification ... 7
Figure 2.2: The Multi-Criteria Decision-Making process (Wang et al., 2009a) ... 9
Figure 5.1: The Middle East and North Africa Map chart using TOPSIS ... 33
Figure 5.2: The Middle East and North Africa Map chart using ELECTRE... 35
Figure 5.3: The Middle East and North Africa Map chart using PROMETHEE ... 37
Figure 5.4: The GAIA PLANE (Alternatives) ... 38
Figure 5.5: The GAIA Plane for Criteria ... 39
Figure 5.6: The GAIA Web of Saudi Arabia ... 40
Figure 5.7: The GAIA Web Turkey ... 41
Figure 5.8: The GAIA Web Qatar ... 41
Figure 5.9: The GAIA Web Iran ... 42
Figure 5.10: The GAIA Web Sudan ... 42
Figure 5.11: The Action Profile of Saudi Arabia ... 43
vi
ÇOK KRİTERLİ KARAR VERME YÖNTEMLERİNİ UYGULAYARAK ÜLKERLERE İLİŞKİN RİSK DEĞERLENDİRİLMESİ: ORTA DOĞU VE
KUZEY AFRİKA’DAKİ ÜLKELERİ SIRALAMAK İÇİN BİR ÖRNEK ÇALIŞMASI
ÖZET
Orta Doğu ve Kuzey Afrika (MENA) bölgeleri onlarca yıldır birçok yabancı yatırımcının ilgisini çekmesine rağmen şu anki jeopolitik durum onları hoş karşılamıyordur. O bölgedeki savaş, terrör, ayaklanma ve siyasi değişimlerin sonuçları, bir çok uluslararası şirketin o bölgedeki gelecek planlarını yeniden düşünmeye veya o bölgedeki yatırımlarını geri çekmeye mecbur bırakmıştır. Diğer taraftan MENA’nın, bölgedeki daha az rakip ile gelişen pazarına inanan şirketler de vardır. yapılacak en iyi yatırım kararlarının veya gelecekte ki işbirliklerinin sınırlandırılabilmesi için, güncel durum, analiz ve öngörüleri için, oluşabilecek durumları da gözardı ederek, sözkonusu ülkeyi alakadar eden faktörlere bağlı, kapsamlı ve detaylı bir araştırmanın zorunlu olduğunun altını çizmekte fayda var. Çok kriterli karar verme analizi, yatırımcılara bir takım ilgili kriterlerin arasından en iyi seçeneği bulmakta yardımcı olabilir. Bu araştırmada yirmi temel göstergeye dayanarak yirmi üç ülkenin sıralanması için TOPSIS, ELECTRE ve PROMETHEE gibi iyi bilinen üç çok kriterli karar verme yöntemi kullanılmıştır. Bu araştırma için gerekli olan veriler, hükümetlerin 2000 ve 2015 arası yayınladığı sayıları içeren erişilebilir veri bankalarından alınmıştır. Bu bulguların sonuçları, sözde Arap Baharı ve Arap Baharı sonrası ortamında sürekli hareket halinde olan Orta Doğu ve Kuzey Afrika bölgesine ilgi duyan karar vericiler, politika belirleyenler, paydaşlar, araştırmacılar ve başka ilgili taraflara bir takım ülke sıralamasını getirir.
Anahtar Kelimeleri: Çok kriterli karar verme, Orta Doğu ve Kuzey Afrika, TOPSIS,
vii
COUNTRY RISK ASSESSMENT BY APPLYING MULTI-CRITERIA DECISION-MAKING METHODS: A CASE STUDY RANKING COUNTRIES
IN THE MIDDLE EAST & NORTH AFRICA ABSTRACT
The Middle East and North Africa (MENA) region has been attracting many foreign investors for decades, but the current geopolitical situation has not shown a welcoming face towards them. Consequences of war, terror, riots and political changes in the region have forced many international companies to reconsider their future plans in the region or withdraw their investments from the region. On the other hand, there are also companies that have faith in the emerging market of the MENA with fewer competitors in the region. It should be hereby emphasized that narrowing down the best possible investment decision or decisions on future cooperation need accurate research on the current situation as well as an analysis and forecast of the upcoming situation in terms of various factors within the country concerned and also the region. The Multi-Criteria Decision Making (MCDM) analysis can help investors to choose the best alternative from a set of relevant criteria. In this research, three well-known MCDM methods, TOPSIS, ELECTRE, and PROMETHEE, were used to rank twenty-three countries based on twenty key indicators. The data required for this study was collected from the accessible databanks comprising the numbers published by the governments within the years 2000-2015. The outcome of these findings provides a set of country rankings for an interested group of decision makers, policy makers, stakeholders, researchers and other involved parties who are interested in the Middle East and North Africa region which is constantly on the move in the so-called Arab Spring or post-Arab Spring environment.
Keywords: Multi-Criteria Decision Making, Middle East and North Africa, TOPSIS,
1 1. INTRODUCTION
1.1 Study Topic
Consequences of war, terror and political changes in the Middle East and North Africa region has significantly increased the risk of investments compared to previous decades. Many foreign investors have always seen the Middle East and North Africa as a region with enormous potential with many different resources. Still considering the uncertain instability and risk in the MENA that has undergone a lot of changes, mainly affected by the consequences of the so-called Arab Spring in late 2010 and early 2011, yet international firms are willing to take a calculated risk and invest in the region. For instance, the contract concluded between Iran and the French Energy Giant Total on July 2017, worth nearly $5bn, aims to develop an offshore gas field in the Persian Gulf. There are many consulting firms that assist such companies throughout their project plan. Such firms analyze different indicators of a particular country that could affect the investor’s future in that region. In this study, twenty-three countries of the Middle East and North Africa (MENA) region are ranked based on their financial, political and economic sectors with the help of selected Multi-Criteria Decision Making (MCDM) methods.
1.2 Purpose of Thesis
In this study, twenty-three MENA countries have been graded and ranked using the Multi-Criteria Decision-Making Methods TOPSIS, ELECTRE and PROMETHEE. The result of this study will equip an interested group of decision makers, policy makers, stakeholders, researchers and other parties with a list of scored and ranked countries in the targeted MENA region, in the post-Arab Spring period.
2 1.3 The Middle East and North Africa
Figure 1.1: The Middle East and North Africa Geographic Map
The Middle and North Africa (MENA) region from the geographic standpoint, starts in the northwest of Africa, Morocco to the southwest of Asia Iran and in the north starting from Turkey to Yemen in the south. Also, there are other countries in this territory that are respectively counted as the MENA region. For instance, Afghanistan, Armenia, Georgia, and Pakistan are such countries that have direct and indirect influences on the region.
The MENA region has an important role in the global economic stability because of its geographic position and its rich natural resources. Since the end of 2010, the MENA region has significantly grown in geopolitical importance due to the so-called Arab spring that includes a set of decisive events in the MENA region ranging from peaceful protests through public acts of violence and (attempted) changes of governments by force to civil wars as well as foreign interventions.
3
The following chapter, the Literature review, summarizes prior research on ranking countries of the world considering different fields and indicators. Moreover, it also reviews Multi-Criteria Decision-Making methods used in different case studies.
4 2. LITERATURE REVIEW
There are several methods and techniques available in the academic literature that focus on ranking and analyzing countries in terms of qualitative and quantitative characteristics of different indicators and sectors within the country. In the following, the variety of research and projects are done on country ranking has been demonstrated, it has been covering agriculture, economy, healthcare efficiency, supplier management and a research done on happiness and life satisfaction of different nations.
The research done by (Phillis, Grigoroudis, and Kouikoglou, 2011) discusses a sustainability ranking and improvement of 128 countries based on changes within the regions depending on 75 different indicators such as climate changes, pollution, economic and political changes throughout the time period from 1990 to 2011. Data for each indicator were collected from United Nation (UN) database. The model has divided the structure of sustainability into two components: a) ecological sustainability and b) societal or human sustainability. The ecological components are water quality, land integrity, air quality and biodiversity. The human or societal on the other hand focus on the political aspects of the countries, the educational level, economic welfare, and health.
All together, they have created the Sustainability Assessment by Fuzzy Evaluation (SAFE) model which is capable of handling quantitative, qualitative and mixed data using fuzzy logic. SAFE uses a linear interpolation between sustainable and unsustainable criteria with a series of normalized indicators between zero and one which resulted in a ranking list.
An Economic and Environmental assessment (Madaleno, Moutinho and Robaina, 2016) that focuses on twenty-six European countries using Data Envelopment Analysis (DEA) techniques tried to estimate the efficiency of those countries in the years 2001 to 2012 considering the country’s capital, labor forces, renewable energy and fossil fuels as input-oriented and output-oriented as Gross Domestic Product
5
(GDP) per capita, GDP per labor, and fossil fuel used per GDP and renewable energy per GDP and GDP per greenhouse gasses are indicators used in the research project which has derived its data from the European Environments Agency and Eurostat. It must be noted that by considering different input- and output-oriented indicators, the result of economic and environmental estimation will be different. In this paper, energy forces are one of the key inputs that must be considered among other factors to estimate energy efficacy in the production processes.
Ranking a country does not have to be necessarily based on economic, political indicators. The ranking done on the cross-healthcare efficiency among homogeneous countries is a case study that the modern and non-parametric estimators such as Stochastic Frontier Analysis (SFA), DEA estimator and Malmquist Productivity index were used. Data used in this research was taken from World Bank websites and the data used by the similar research including 191 countries and 30 OECD countries (Gearhart, 2016).
Ranking countries based on toxic pollution sites is another similar case as well. In this research low- and middle-income countries were ranked using Blacksmith Index (BI), a risk-ranking tool in more than 3000 different sites in 48 countries, the data was collected from Environmental Protection Agency (EPA) (Caravanos et al., 2014).
A country can also be ranked due to some of its risk factors within itself to improve its performances on a bigger scale. In the research done by (Ameyaw and Chan, 2015), public-private water supply projects in developing countries were evaluated and ranked according to 40 risk factors using Fuzzy Synthetic Evaluation (FSE); the data was collected from the published research activities and literature on the relevant topic as well as a survey done with industry practitioners (Caravanos et al., 2014). One of the most important key factors of success in any project is to identify the relevant risk components that will affect the project and then manage those risks. In the paper presented here, a questionnaire survey was prepared including 40 different risk factors, the feedback was collected and then analyzed using FSE.
Developed and developing countries are trying to monitor each other in terms of various indicators, these monitoring will help those countries to understand if the right path or right policy was taken respective to its current situation, observing how and where the state of the country is at present. Moreover, when a country is being ranked,
6
the performance of the country for the past years is calculated and compared with other states and nations. In the research done by (Beaulier et al., 2016) 156 countries’ economic institutions have been ranked and compared with the Fraser Institute’s Economic Freedom of the World (EFW) rankings using ordinal methodology. The results are mostly alike with not a significant difference. Furthermore, EFW (Economic Freedom Dataset, published in Economic Freedom of the World) has measured and ranked 152 countries based on the summer index of giving scores from zero to ten. The scores were based on five areas: the size of the government, legal and property rights, access to sound money, and, regulation of credit and labor and business. The date was collected from hundreds of scholar papers.
The hypothesis that was tested by (Tarek and Ahmed, 2017) states: “Poor government
leads to higher accumulation of the Middle East and North Africa MENA public debt over the period”. The data used in the considered research is covering the year 1996
to 2015 among 17 countries in the MENA region that was collected from World Databank, IMF (International Financial Statistics), and Worldwide Governance Indicators. The data was analyzed on STATA 11 Software and has proven that only three indicators support this hypothesis: Political Stability, Absence of Violence index,
Regulatory Quality index and Rule of the Low index.
In another research, done by (Bai, Hira and Deshpande, 2015), countries were analyzed based on their economic development and growth and then ranked among 20 countries based on 21 different economic parameters. The Factor Analysis process was applied on the data collected from IMF and the compared their economic development using SPSS software. Some of the economic parameters chosen are as follows: gross domestic product per capita, implied Purchasing Power Parity (PPP), total investment, gross national saving, imports and exports of goods populations and general government total expenditure.
A research was done by (Cordero, Salinas-Jiménez and Salinas-Jiménez, 2017) that focuses on the happiness and the life satisfaction or the happiness economics of 16 OECD countries is another example that can be obtained by ranking countries in terms of related indicators. The wellbeing ranking approach was used in this research considering a set of indicators, health, education, income, gender, religious, unemployed and GDP per capita are just some examples that can affect the level of
7
satisfaction. The data used in this study is borrowed from the World Values Survey (2005-2006 WVS).
After surveying the literature on various research projects done to rank countries due to a specific outcome, the following part of this chapter will discover publications that have used Multi-Criteria Decision Making (MCDM) methods in different areas.
2.1 Multi-Criteria Decision Making (MCDM)
Choosing and making a right and effective decision has become an important action in today’s ultra-modern world. The act of choosing the right decision based on the preferences of the decision maker(s) between one or many courses of action is called Decision Making. In the early seventies, the theory of Multi-Criteria Decision making was designed for more systematic and rational decision-making problems, especially cases, where multiple of all the different criteria needed to be considered simultaneously. Later on, the Uncertainty and Chaos theory along with Multi-Criteria Decision making theory was developed and the Uncertainty of Fuzzy Set was introduced by Zadeh helped to fusion the MCDM and Fuzzy set by Carlsson and Fuller which served to uncover many multi-decision problems (Abdullah, 2013).
Figure 2.1: The Multi-Criteria Decision-Making Classification
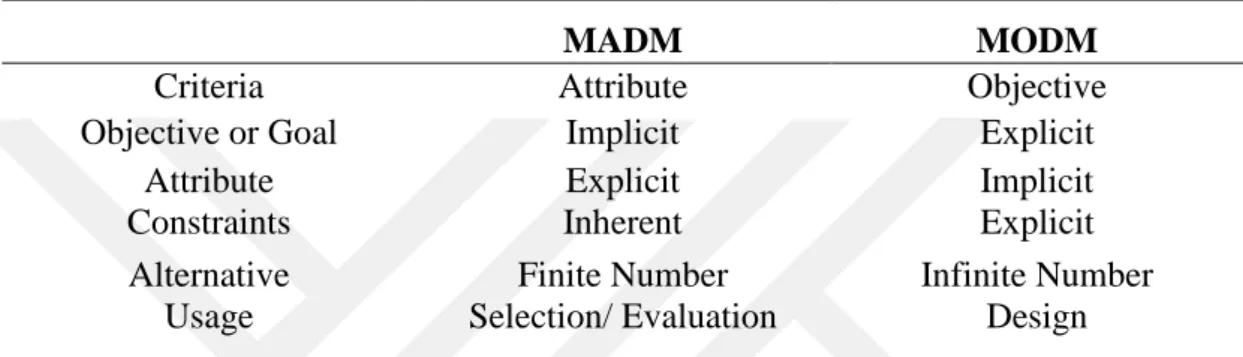
Figure 2.1 shows a classification of MCDM, Multi-Attribute Decision Making (MADM) and Multi-Objective Decision Making (MODM). As it shown in table … In MADM the preferences are depending on the set of attributes given whereas in MODM the preferences are based on the set of objectives given. In MADM the objectives are implicit in nature but in MODM the objectives are explicit with a specific mathematical formulation for objective functions. Moreover, MODM is more suitable for the evaluation of continuous alternatives with an infinite number of
Multi Criteria Decision Making
Multi Objective Decision Making (MODM)
Multi Attribute Decision Making (MADM)
8
possible values of the outcome, which have the form of vectors of the decision variable, decision problems in design and engineering are such examples. On the other hand, MADM approaches consider a few and a finite number of alternatives such as most policy decision problems. Besides, in the MADM problems, all possible outcome can be seen at the beginning of the problem whereby in the MODM problems there is an infinite possible solution and outcome to the problem at the beginning of the problems (Kumar et al., 2017).
Table 2.1: The Difference Between MODM & MADM
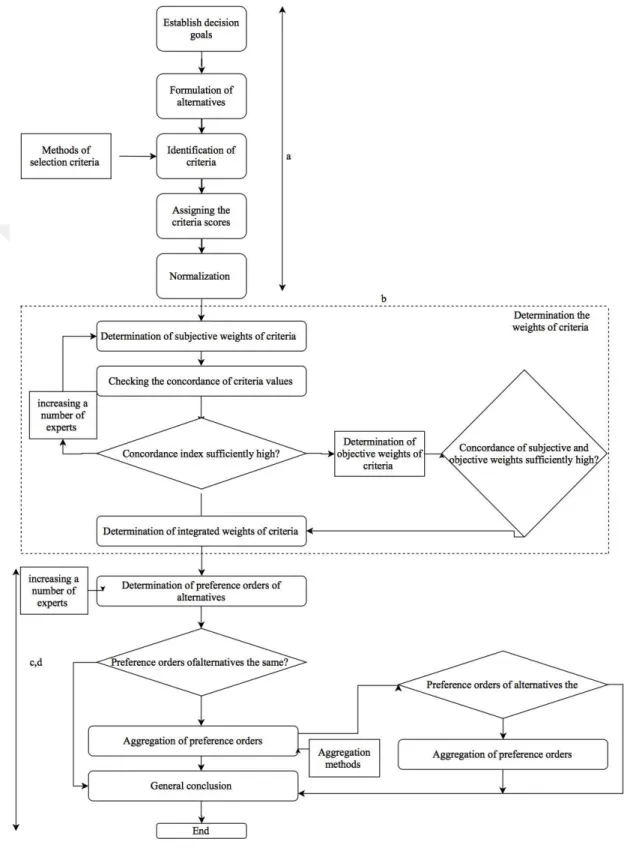
In the following part, the process of solving MCDM problems has been described and shown in Figure 2.2.
(a) Finding and selecting the right alternatives and criteria.
The alternatives and criteria are chosen based on the problem given. Sometimes the needed alternatives are chosen based on literature papers or based on the decision maker(s) knowledge.
(b) Criteria weighting
Determining criteria’s weight can be said to be one of the important and difficult steps in MCDM problems. In this step, the importance of individual criteria is shown as a number and if all the weight of criteria to be summed it must be equal to one so that all alternatives can be compared with each other. In some problems, the weight can be calculated and, in some problems, the weights are driven from the published literature or given the experts.
(c) Evaluation
There are many different methods available depending on the decision-making problems and the availability of data.
(d) Final treatment and aggregation the calculations
MADM MODM
Criteria Attribute Objective
Objective or Goal Implicit Explicit
Attribute Explicit Implicit
Constraints Inherent Explicit
Alternative Finite Number Infinite Number
9
Once the method is chosen, the method that can easily use and rank the best alternative for the decision maker(s).
10
Based on figure 2.2, the primary step “Methods of Selection Criteria” is designed to formulate and normalize a set of criteria. And then in the following step, the importance of each selected criteria is given a weight “Criteria Weight”. Furthermore, by applying one of the MCDM methods on a set of criteria, the acceptable alternatives are ranked and scored. In the final step, if the alternatives ranked-order is the same as the other MCDM methods, the process is ended if not the ranking results would be calculated again till best scheme is selected (Wang et al., 2009)
In this part, the relevant information collected from scientific literature are synthesized into a summary, describing different approaches and methods in MCDM with their steps and the area of application. The Technique for Order Preference by Similarity to Ideal Solution (TOPSIS), ELimination Et Choix Traduisant la REalité (ELECTRE) and The Preference Ranking Organization METhod for Enrichment Evaluations (PROMETHEE) have been used and evaluated in this case study.
2.1.1 Technique for Order Preference by Similarity to Ideal Solution (TOPSIS) by Hwangand Yoon 1982
TOPSIS is a well-recognized MCDM method in ranking problems, such as water resource management, economy and environment and project management. The focus of this method is the distance between the ideal alternatives and non-ideal alternatives that carries the shortest distance to the ideal criteria which consider as the best alternative (Radmehr and Araghinejad, 2015). For instance, TOPSIS was used to locate the best possible region to build solar photovoltaic farms in the southeast of Spain (Sánchez-Lozano, García-Cascales and Lamata, 2016). The rank was obtained based on the best alternative that carries the closest result to the positive ideal solution among the 10-selected criteria.
TOPSIS was used to analyze the business competition in the research done by (Torlak
et al., 2011) where domestic Turkish airlines were compared to each other in order to
rank air carries opportunities according to the performance of their 9 key criteria.
TOPSIS was practiced in the field of energy planning and strategy-decision making problems in the research done by (Cayir Ervural et al., 2017) whereby a hybrid methodology for Turkey’s energy sector strategy was suggested using TOPSIS and SWOT (Strengths Weaknesses Opportunities Threats). Another scope of TOPSISI is
11
in the energy consumption sector wherein the research was done by (Akbaş and Bilgen, 2017), different models were studied on energy saving and energy resources efficiently in order to control operations at wastewater treatment plants.
With using TOPSIS a methodology was presented in the research done by (Bilbao-terol et al., 2014) which included an evaluation and measurement of the investment sustainability within the sovereign bonds. The study case was applied on three European countries after all counties were considered with regard to their most frequently used sustainability: the ecological footprint, the environmental performance index, and the adjusted net saving.
The performance of banks has an important effect on developing the economy of a country. Moreover, it becomes an important fact for the investors that are willing to invest in that country. The research done by (Mandic et al., 2014) has proposed a mode that assists investor in having a better understanding to analyze the financial banking system and their performances in Serbian using TOPSIS considering eight criteria equity, net interest income, liquid assets, cash, portfolio, core business net income, sources and earnings before taxes.
A model was introduced to assist maintenance management strategy of a power plant in Turkey by (Can, Ünlüsoy, and Eren, 2017). Using this model, there would be a 77% improvement in the selected equipment maintenance compared to the model not being used. Another case that TOPSIS was used in is in the research done by (Othman et al., 2015) where a technique was developed to understand and rank the relationship between psychosocial stresses of the Malaysian seafarers based on the factors affecting their performance that cause injuries and sometimes casualties.
Another utilization of TOPSIS was undergone in the research done by (Yan et al., 2017) in waterway congestions when dynamic risk conditions are involved in the Yangtze River in China. Due to congestion problems in waterway transportation, it is necessary to make a flexible decision according to the available risk conditions. TOPSIS was used to choose the best alternative according.
12
2.1.2 ELimination Et Choix Traduisant la REalité (ELECTRE) by Benayaoun et al. 1966
The next popular method in MCDM is ELECTRE. ELECTRE has several different versions in different areas such as Energy Management, Financial Management, Business Management, Information Technology and Communication and etcetera. Even though this method has many different versions but they all follow the same fundamental which compares a relation between all the alternatives, considering two at the time. For instance, in supply chain management, finding the right supplier can be an MCDM problem, since they all carry a various criterion. In the paper done by (Wan, Xu and Dong, 2017) the best possible supplier was chosen using ELECTRE considering 23 different criteria that are related to the suppliers and the materials used. Some of these criteria are quality, price and time, supply chain support, cost, and service performance.
Another case that ELECTRE was used is in service ranking prediction when consumers have inappropriate prediction while selecting a trustworthy decision. In the research done by (Ma et al., 2017) the services environments were ranked to help and predict a promising idea to overcome these inappropriate choices. ELECTRE can also be applied in credit ranking assessment where managers in financial institutions determine a person’s wealth based on the proposed terms of loans and many supplementary criteria collected from the applicants. These institutions use rating models to have an estimation of their clients that are not paying back their debt on time.
In the research done by (Gastelum Chavira et al., 2017) ELECTRE was used considering 8 criteria to create a preference in the form of valued outranking that decision makers could choose from and generate a credit ranking for themselves. Business plans and public policies are also can be evaluated and ranked using ELECTRE.
In the research done by (Dias et al., 2016) 28 stakeholders based on their objectives as criteria were ranked using ELECTRE with the impact of changes in policies that were collected from a qualitative Delphi survey.
In the research of (Del Vasto-Terrientes et al., 2015) ELECTRE was used to propose a complementation assessment system on Water Quality Index (WQI) for destination
13
marketing organizations so that the strong and weak points of official tourist destination websites considering all 123 indicators be detected.
Another outranking example using ELECTRE is the research done by (Kumar, Singh and Kharab, 2017) analyzing the operational performance of cellular mobile phones in Delhi among 6 major telecom companies considering 6 criteria.
2.1.3 The Preference Ranking Organization METhod for Enrichment Evaluations (PROMETHEE) by Brans Jean-Poerre 1982
The Preference Ranking Organization METhod for Enrichment Evaluations (PROMETHEE) was first designed by ( Brans 1982) and later on was extended by (Brans and Vincke, 1985). PROMETHEE like ELECTRE is an outranking method with mathematical properties and particular friendliness of use when it comes to imperfect criteria. Moreover, because of its availability to ranked simple and limited but efficient data, it can be applied in many fields. This method considers the deviations that each criterion shows to alternatives. For instance, the research done by (Peng and Xiao, 2013) focuses on the evaluation of material selection using PROMETHEE since material selection uses a massive number of characteristics, including quantitative and qualitative data.
Another field that PROMETHEE was used is social sustainability assessment of small
hydropower done by (Wu et al., 2017) in social sustainability. This method can easily
handle the correlation and uncertainty among indicators for social sustainability problems. Public recognition, energy reserves, the policy of small hydropower, management level, the risk of damage, employment creation, human health and Impact on the landscape were the indicators used in this problem.
Research done by (Saldanha et al., 2017) has shown that how PROMETHEE can have a variety of usage in many fields. The purpose of this research is to find the solution of minimizing the heat-transfer within the area and the resolve and optimize a shell and tube heat exchanger in pumping power.
In another case done by (Veza, Celar, and Peronja, 2015) that trying to rank industrial enterprises based on enterprise’s capabilities, where each enterprise has given 14 specific capabilities. PROMETHEE is also used to rank the sustainability of countries.
14
In the research done by (Antanasijević et al., 2017) the sustainability of 30 European countries based on 38 different indicators over a ten year period (2004-2014) was ranked and it has revealed that the major countries in Europe have an overall of improvement in the studied period, where only two countries that have not made an over progress and improvement are Greece and Ireland. The indicators selected are eco-efficiency and economic development, competitiveness, access to labor market, innovation, public finance sustainability, health, employment, consumption and production patterns, monetary poverty, biodiversity, energy, resource use and waste, land use, transport and mobility, climate change and freshwater resource, the data was taken from Eurostat database.
Another usage of PROMETHEE is in the research done by (Andreopoulou et al., 2016) where 30 enterprises’ websites in the field of renewable energy based on 18 criteria were ranked. Another example that PROMETHEE was used is in the research done by (Afful-Dadzie, Oplatková and Nabareseh, 2015) that helped select the right start-up businesses in a public venture capital financing, there is a high risk of investment in developing country where most of the selected criteria are subjective or hold uncertain. This method was applied to find the potential and ideal candidates in a highly competitive environment in Ghana where the Government publicly run a venture capital to help start-up businesses grow. The criteria were collected from a set of literature and past studies: product or service characteristics, employment creation, entrepreneur’s personality, entrepreneur’s experience, Market characteristics and Financial characteristics are the criteria used in this research.
When it comes to selecting a suitable supplier and sources in information systems field to reduce and minimize the costs, outsourcing become a common and important strategy. In the research done by (Chen, Wang and Wu, 2011) four potential suppliers based on seven criteria were ranked using PROMETHEE and had provided a list of ranking for decision makers aiming to improve the efficiency of their outsourcing decision-making process.
A similar example in resource management is the research done by (Amaral and Costa, 2014) in the improvement of hospital resources in Brazil that has consequences on the quality and the services offered by these hospitals. PROMETHEE elects the best and ideal decision in resource management where outranking method considered in the context of hospital services.
15
Enterprise resource planning system plays an important role in any organization, where there are a great uncertainty and changes on all bases within and outside of the organizations. Therefore, the firms are willing to have a well-established system to resist of occurring any problem. The research done by (Kilic, Zaim and Delen, 2015) used PROMETHEE in a small-medium enterprise to address the enterprise resource planning system selection problem since the firms are facing a mulita criteria problems and it successfully ranked the alternatives and identified the best system.
A case study was done on a state-owned energy company (Hernandez-Perdomo, Mun and Rocco, 2017) where a methodology was presented to evaluate and rank projects by the firms based on the challenges that decision-makers have to take to maintain economic growth, sustainability, social responsibility and shareholder value within the firms. PROMETHEE was applied to rank this project because of its practical advantages among other methods in mulita criteria decision making.
The following table shows the different area of application for TOPSIS, ELECTRE, and PROMETHEE.
16
Table 2.2: The MCDM Methods Used in Different Fields
Method Area of Application Reference
TOPSIS Supply Chain Management
Water Management
Strategy Selection
Business Management
(Patil and Kant, 2014; Kusi-Sarpong et al., 2015; Uygun and Dede, 2016; Kang and Hwang, 2017; Yazdani et al., 2017)
(Estay-Ossandon, Mena-Nieto and Harsch, 2017; Ameri, Pourghasemi and Cerda, 2018)
(Kusumawardani and Agintiara, 2015; Shakerian, Dehnavi and Ghanad, 2016; Zavadskas et al., 2017)
PROMETHEE Strategy Management
Risk Analysis
Outranking
(Vinodh and Jeya Girubha, 2011; Vetschera and De Almeida, 2012; Ameri, Pourghasemi and Cerda, 2018)
(Chen, 2014; Celik and Taskin Gumus, 2016; El Mokrini et
al., 2016; Nikouei, Oroujzadeh and Mehdipour-Ataei, 2017)
ELECTRE Energy management
Financial management Business management
Information technology &
Communication
(Bojković, Anić and Pejčić-Tarle, 2010; Kaya and Kahraman, 2011; Fancello, Carta and Fadda, 2014; Ishizaka and Nemery, 2014; Kumar et al., 2016; Lian and Ke, 2016; Certa et al., 2017; Mousavi, Gitinavard and Mousavi, 2017)
In the next chapter, the methodology the three methods selected in this research is entirely discussed and shown.
17 3. METHODOLOGY
After going through research and papers on Mulita Criteria Decision Making TOPSIS, ELECTRE and PROMETHEE methods were chosen. The following is a general description of each method.
3.1 TOPSIS Hwangand Yoon 1982
As mentioned in the previous part, TOPSIS is one of the well-known methods in the MCDM. This concept is focused on the distance between the ideal and non-ideal alternatives from the entire set of the alternatives. The steps are articulated as following (C. L. Hwang, 2012):
Step 1: Forming a performance decision matrix.
In this step the chosen alternatives and criteria were presented in a decision matrix as shown in the following;
Here, 𝑖 = 1,2, … , 𝑚, 𝑗 = 1,2, … , 𝑛 (
𝑋11 𝑋12 … 𝑋𝑛 𝑋21 𝑋22 … 𝑋2𝑛
𝑋𝑚1 𝑋𝑚2 … 𝑋𝑚𝑛) (1) Step 2: Normalizing the established matrix by the given formula:
There are a lot of different formulas that can normalize heterogeneous data collected from different resources with different units into a dimensionless unit. Especially in cases where ranking and rating decisions are needed to be calculated.
The following is the formula used in this case study.
𝑛𝑖𝑗 = 𝑥𝑖𝑗 √∑𝑚𝑗=1(𝑥𝑖𝑗)2, 𝑗 = 1, … , 𝑛 𝑖 = 1, … , 𝑚 (2) ( 𝑛11 𝑛12 … … 𝑛𝑛 𝑛21 𝑛22 … 𝑛2𝑛 𝑛𝑚1 𝑛𝑚2 … 𝑛𝑚𝑛 )
18
Step 3: The weighted normalized decision matrix is calculated in this step:
𝑣𝑖𝑗 = 𝑤𝑗. 𝑛𝑖𝑗 , 𝑗 = 1, … , 𝑛 , 𝑖 = 1, … , 𝑚, (3) ( 𝑣11 𝑣12 … 𝑣𝑛 𝑣21 𝑣22 … 𝑣2𝑛 𝑣𝑚1 𝑣𝑚2 … 𝑣𝑚𝑛 )
Step 4: ideal and non-ideal alternatives are determined as follow: 𝐴+ = {𝑣
1+, … , 𝑣𝑛−} = (𝑚𝑎𝑥𝑖𝑣𝑖𝑗, 𝑗 ∊ 𝐽 ; 𝑚𝑖𝑛𝑖𝑣𝑖𝑗, 𝑗 ∊ 𝐽′) 𝑖 = 1,2, … , 𝑚 (4) 𝐴− = {𝑣
1+, … , 𝑣𝑛−} = (𝑚𝑖𝑛𝑖𝑣𝑖𝑗, 𝑗 ∊ 𝐽 ; 𝑚𝑎𝑥𝑖𝑣𝑖𝑗, 𝑗 ∊ 𝐽′) 𝑖 = 1,2, … , 𝑚 (5) Step 5: In this step, the Euclidean distances among the ideal and non-ideal alternatives would be calculated respectively as follow:
𝑑𝑖+ = √∑ ( 𝑣 𝑖𝑗− 𝑣𝑗+) 2 𝑛 𝑗=1 (6) 𝑑𝑖− = √∑ ( 𝑣𝑖𝑗− 𝑣𝑗−) 2 𝑛 𝑗=1 (7)
Step 6: by using the following equation the relative closeness to the final ideal solution can be shown as below:
𝑅𝑖 = 𝑑𝑖−
𝑑𝑖++𝑑𝑖− (8)
Step 7: Then the results would be ranked.
3.2 ELECTRE by Benayaoun et al. 1966
ELECTRE is one of the useful MCDM methods for ranking the best set of alternatives based on different criteria. In this outranking concept, the first alternative is compared with the rest of alternative at a time and then rank the output in an appropriate form. The following steps will go through the method (Benayoun, Roy and Sussman, 1966):
Step 1: Forming a performance decision matrix.
In this step the chosen alternatives and criteria were presented in a decision matrix as shown in the following;
19 ( 𝑋11 𝑋12 … 𝑋𝑛 𝑋21 𝑋22 … 𝑋2𝑛 𝑋𝑚1 𝑋𝑚2 … 𝑋𝑚𝑛) (9) Here, 𝑖 = 1,2, … , 𝑚, 𝑗 = 1,2, … , 𝑛
Step 2: Normalizing the established matrix by the given formula:
There are a lot of different formulas that can normalize heterogeneous data collected from different resources with different units into a dimensionless unit. Especially in cases where ranking and rating decisions are needed to be calculated.
The following is the formula used in this case study.
𝑛𝑖𝑗 = 𝑥𝑖𝑗 √∑𝑚𝑗=1(𝑥𝑖𝑗)2, 𝑗 = 1, … , 𝑛 𝑖 = 1, … , 𝑚 (10) ( 𝑛11 𝑛12 … … 𝑛𝑛 𝑛21 𝑛22 … 𝑛2𝑛 𝑛𝑚1 𝑛𝑚2 … 𝑛𝑚𝑛)
Step 3: The weighted normalized decision matrix is calculated in this step:
𝑣𝑖𝑗 = 𝑤𝑗. 𝑛𝑖𝑗 , 𝑗 = 1, … , 𝑛 , 𝑖 = 1, … , 𝑚, (11) ( 𝑣11 𝑣12 … 𝑣𝑛 𝑣21 𝑣22 … 𝑣2𝑛 𝑣𝑚1 𝑣𝑚2 … 𝑣𝑚𝑛 )
Step 4: Calculating the concordance and discordance stet for each alternative.
By comparing each alternative with the other the concordance set would be evaluated from the equation below: if one alternative grater or equal to the other alternative is considered under the concordance set and shown by C.
𝐶(𝑝, 𝑞) = {𝑗, 𝑣𝑝𝑗 ≥ 𝑣𝑞𝑗} (12) And the discordance set would be the alternatives that are worse than other and shown by D.
𝐷(𝑝, 𝑞) = {𝑗, 𝑣𝑝𝑗 < 𝑣𝑞𝑗} (13) Step 5: Building the concordance matrix
20
In this part weight of the selected concordance set of alternatives are added.
𝐶𝑝𝑞 = ∑ 𝑤𝑗∗ 𝑗∗ (14) Step 6: Defining the discordance matrix
The discordance matrix is created by dividing the set of discordance to the total value of the whole set.
𝐷𝑝𝑞 =(∑ |𝑣𝑗0 𝑝𝑗0−𝑣𝑞𝑗0|)
(∑ |𝑣𝑗 𝑝𝑗−𝑣𝑞𝑗|) (15)
Step 7: Creating the effective concordant matrix
In the previous part, the concordant matrix was calculated and by converting the concordant matrix to effective concordant matrix helps to show a better judgment when one alternative to is compared with other and is shown as 𝐶̅.
𝐶̅ = ∑ ∑𝑚 𝐶𝑝𝑞 /𝑚(𝑚 − 1) 𝑞=1
𝑚
𝑝=1 (16)
And then a Boolean matrix is bullied from the equation below:
𝑓𝑝𝑞 = {1 𝐶𝑝𝑞 > 𝐶̅
0 𝐶𝑝𝑞 < 𝐶̅ (17)
Step 8: Creating the effective discordant matrix
To calculate the effective discordant matrix the following equations are used. 𝑑̅ = ∑𝑚𝑝=1∑𝑚𝑞=1𝑑𝑝𝑞 /𝑚(𝑚 − 1) (18) And then a Boolean matrix is bullied from the equation below:
𝑔𝑝𝑞= {
1 𝑑𝑝𝑞 > 𝑑̅
0 𝑑𝑝𝑞 < 𝑑̅ (19)
Step 9: calculating the global matrix
The global matrix (H) is calculated by multiplying matrixes (F) to (G). It shows that the alternative A1 is preferred to A2 when comparing the concordance and discordance of their criteria.
21 3.3 PROMETHEE
PROMOTHE is another outranking method used to solve Multi-Criteria Decision-Making problems. In this method firstly, all pairs of alternatives are to be compared to each criterion and then PROMETHEE can assist a specific preferential function to describe the differences between each alternative’s preferences on every criterion. These preference functions which have a value ranged from zero to one, are there for the decision makers to describe the preference deference from their point of view. The closest range is? to one, the larger the difference. The range zero shows that there are no preferential differences between the pairs. The following steps will lead through the method;
Step 1: Forming a performance decision matrix.
In this step the chosen alternatives and criteria were presented in a decision matrix as it has shown in the following;
Here, 𝑖 = 1,2, … , 𝑚, 𝑗 = 1,2, … , 𝑛 (
𝑋11 𝑋12 … 𝑋𝑛 𝑋21 𝑋22 … 𝑋2𝑛
𝑋𝑚1 𝑋𝑚2 … 𝑋𝑚𝑛) (21) Step 2: Normalizing the established matrix by the given formula:
There are a lot of different formulas that can normalize heterogeneous data collected from different resources with different units into a dimensionless unit. Especially in cases where ranking and rating decisions are needed to be calculated.
The following is the formula used in this case study.
𝑛𝑖𝑗 = 𝑥𝑖𝑗 √∑𝑚𝑗=1(𝑥𝑖𝑗)2, 𝑗 = 1, … , 𝑛 𝑖 = 1, … , 𝑚 (22) ( 𝑛11 𝑛12 … … 𝑛𝑛 𝑛21 𝑛22 … 𝑛2𝑛 𝑛𝑚1 𝑛𝑚2 … 𝑛𝑚𝑛 )
Step 3: The differences between each alternative with respect to the other one must be evaluated. Moreover, the differences in criteria value of alternatives must be calculated pairwise.
22
Step 4: Choose the preference function, PROMETHEE has seven types of preference functions which have ranged from zero to one. (In this research usual function was chosen because any parameter such as preference and indifference thresholds are not needed.)
𝑝𝑖(𝑖, 𝑖′) = 0 𝐼𝐹 𝑅𝑖𝑗 ≤ 𝑅𝑖′𝑗 (23) 𝑝𝑖(𝑖, 𝑖′) = 1 𝐼𝐹 𝑅
𝑖𝑗 > 𝑅𝑖′𝑗 (24)
Step 5: determine the combined preference function with weights; 𝜋(𝑖, 𝑖′) = ∑ 𝑝
𝑗(𝑖, 𝑖′)𝑤𝑗 𝑚
𝑗=1 (25)
Where 𝑤𝑗 is the weight of relative importance of the jth criteria.
Step 6: (n – 1) can be related to each alternative that can result into a positive or negative outranking flow, therefore calculating the leaving and entering outranking is necessary and are given as flowed;
The leaving flow is a measure of the strength of the alternatives.
The leaving flow:
𝜙+(𝑖) = 1
𝑛−1∑ 𝜋(𝑖, 𝑖′), (𝑖 ≠ 𝑖′) 𝑛
𝑗′=1 (26) The entering flow measures the weakness of the alternatives.
The entering flow:
𝜙−(𝑖) = 1
𝑛−1∑ 𝜋(𝑖, 𝑖′), (𝑖 ≠ 𝑖′) 𝑛
𝑗′=1 (27)
Step 7: In this step, PROMETHEE II has provided a net outranking flow of decision alternatives which has been shown in the following;
𝜙(𝑖) = 𝜙+− 𝜙− (𝑖) (28) Step 8: Ranking the net outranking flow considering 𝜙(𝑖) from the highest to the lowest alternative.
23 3.4 Equal Weight Method
The Equal Weight method (EW) represent a uniform distribution of weight when the decision makers have minimal knowledge about the priorities as shown in the following weight formula (Roszkowska, 2013):
𝑊𝑗(𝐸𝑊) = 1𝑛, (29) Where 𝑗 = 1,2, … , 𝑛 .
24 Table 3.1: The Formulas Used for Each Method
In the following chapter, Data Collection will be describing the data resources and the alternatives, and the criteria used in this problem.
TOPSIS ELECTRE PROMETHEE
𝒏𝒊𝒋= 𝒙𝒊𝒋 √∑ (𝒙𝒎𝒋=𝟏 𝒊𝒋)𝟐, 𝒋 = 𝟏, … , 𝒏 𝒊 = 𝟏, … , 𝒎 𝒏𝒊𝒋= 𝒙𝒊𝒋 √∑ (𝒙𝒎𝒋=𝟏 𝒊𝒋)𝟐, 𝒋 = 𝟏, … , 𝒏 𝒊 = 𝟏, … , 𝒎 𝒏𝒊𝒋= 𝒙𝒊𝒋 √∑ (𝒙𝒎𝒋=𝟏 𝒊𝒋)𝟐, 𝒋 = 𝟏, … , 𝒏 𝒊 = 𝟏, … , 𝒎 𝒗𝒊𝒋= 𝒘𝒋. 𝒏𝒊𝒋 , 𝒋 = 𝟏, … , 𝒏 , 𝒊 = 𝟏, … , 𝒎, 𝒗𝒊𝒋= 𝒘𝒋. 𝒏𝒊𝒋 , 𝒋 = 𝟏, … , 𝒏 , 𝒊 = 𝟏, … , 𝒎, 𝒑𝒊(𝒊, 𝒊′) = 𝟎 𝑰𝑭 𝑹𝒊𝒋≤ 𝑹𝒊′𝒋 𝒑𝒊(𝒊, 𝒊′) = 𝟏 𝑰𝑭 𝑹𝒊𝒋> 𝑹𝒊′𝒋 𝒅𝒊+= √∑( 𝒗𝒊𝒋− 𝒗𝒋+) 𝟐 𝒏 𝒋=𝟏 𝒅𝒊−= √∑( 𝒗𝒊𝒋− 𝒗𝒋−) 𝟐 𝒏 𝒋=𝟏 𝑪(𝒑, 𝒒) = {𝒋, 𝒗𝒑𝒋≥ 𝒗𝒒𝒋} 𝑫(𝒑, 𝒒) = {𝒋, 𝒗𝒑𝒋< 𝒗𝒒𝒋} 𝝅(𝒊, 𝒊′) = ∑ 𝒑 𝒋(𝒊, 𝒊′)𝒘𝒋 𝒎 𝒋=𝟏 𝑹𝒊= 𝒅𝒊− 𝒅𝒊++ 𝒅 𝒊 − 𝑪𝒑𝒒= ∑ 𝒘𝒋∗ 𝒋∗ 𝝓 +(𝒊) = 𝟏 𝒏 − 𝟏∑ 𝝅(𝒊, 𝒊′), (𝒊 𝒏 𝒋′=𝟏 ≠ 𝒊′) 𝑫𝒑𝒒= (∑ |𝒗𝒋𝟎 𝒑𝒋𝟎−𝒗𝒒𝒋𝟎|) (∑ |𝒗𝒋 𝒑𝒋−𝒗𝒒𝒋|) 𝝓 −(𝒊) = 𝟏 𝒏 − 𝟏∑ 𝝅(𝒊, 𝒊′), (𝒊 𝒏 𝒋′=𝟏 ≠ 𝒊′) 𝑪 ̅ = ∑ ∑ 𝑪𝒑𝒒 /𝒎(𝒎 − 𝟏) 𝒎 𝒒=𝟏 𝒎 𝒑=𝟏 𝝓(𝒊) = 𝝓+− 𝝓− (𝒊) 𝒅̅ = ∑𝒎𝒑=𝟏∑𝒎𝒒=𝟏𝒅𝒑𝒒 /𝒎(𝒎 − 𝟏) 𝒉𝒑𝒒= 𝒇𝒑𝒒. 𝒈𝒑𝒒
25 4. DATA COLLECTION
Going through the different publications and research that are mentioned in the literature review helped to understand and analyze the important indicators that are related to this research, the data related to each indicator was collected from the following databanks.
• The World Bank www.data.worldbank.org • International Monetary Fund (IMF) www.imf.org
• United Nations (UN) ww.data.un.org
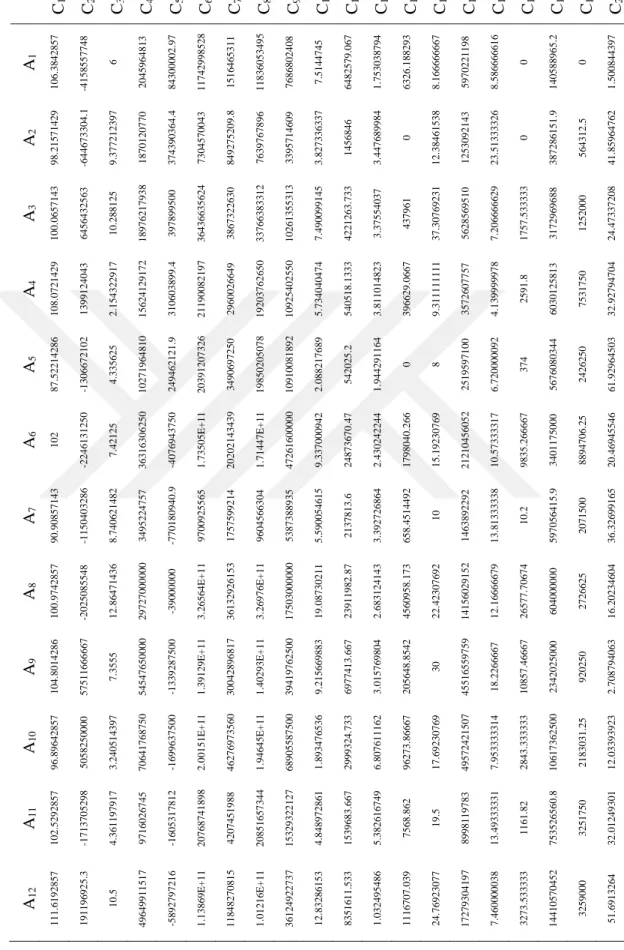
The member governments submit a yearly report on different sectors within the country in those databanks to ensure the stability of the international monetary system by monitoring the economic and financial policies. Unfortunately, there are some missing data in these databanks, therefore, our data (table 4.3 and table 4.4) has narrowed down to twenty-three countries and twenty indicators in MENA between the year 2000 and 2015.
4.1 Countries
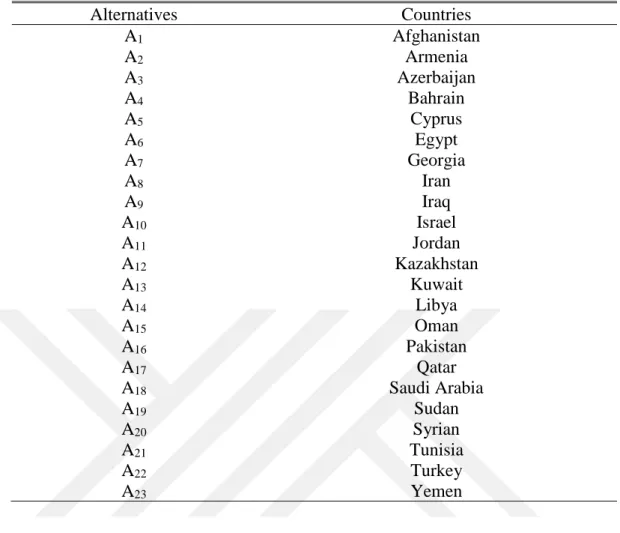
The chosen countries in table 4.1 play an important role in the region because of their natural resources, human power, foreign investments and their location. Afghanistan, Armenia, Azerbaijan, Bahrain, Cyprus, Egypt, Georgia, Iran, Iraq, Israel, Jordan, Kazakhstan, Kuwait, Libya, Oman, Pakistan, Qatar, Saudi Arabia, Sudan, Syrian Arab Republic, Tunisia, Turkey and the Yemen Republic are the countries selected as alternatives in this study.
26
Table 4.1: The Selected Countries in The MENA (Alternatives)
Alternatives Countries A1 Afghanistan A2 Armenia A3 Azerbaijan A4 Bahrain A5 Cyprus A6 Egypt A7 Georgia A8 Iran A9 Iraq A10 Israel A11 Jordan A12 Kazakhstan A13 Kuwait A14 Libya A15 Oman A16 Pakistan A17 Qatar A18 Saudi Arabia A19 Sudan A20 Syrian A21 Tunisia A22 Turkey A23 Yemen 4.2 Indicators
In this research, the chosen indicators or criteria in table 4.2 are based on two fundamental, recently published papers and the availability of data within the country. Choosing a right indicator needed research and studies on different topics and sector of a country to understand country’s key factors that are responsible for a country’s stability, development and the relation to other nations around the world. Therefore, if an indicator of a country is compared with respect to the same indicator of another region (country), it can create a list of countries that are performing better than others. In other words, a ranking of countries in terms of their performances in different indicators and sectors will result.
27 Table 4.2: The Selected Indicators (Criteria)
Criteria Indicator Criteria
weight
C1 Crop production index (2004-2006 = 100) 0.045454545
C2 Current account balance (BoP, current US$) 0.045454545
C3 Deposit interest rate (%) 0.045454545
C4 Exports of goods and services (BoP, current US$) 0.045454545 C5 Foreign direct investment, net (BoP, current US$) 0.045454545
C6 GDP (current US$) 0.045454545
C7 General government final consumption expenditure (current US$) 0.045454545
C8 GNI (current US$) 0.045454545
C9 Imports of goods and services (BoP, current US$) 0.045454545
C10 Inflation, GDP deflator (annual %) 0.045454545
C11 Labor force, total 0.045454545
C12 Military expenditure (% of GDP) 0.045454545
C13 Natural gas (including LNG) - production "Terajoules" 0.045454545 C14 Time required to start a business (days) 0.045454545 C15 Total reserves (includes gold, current US$) 0.045454545 C16 Unemployment, total (% of total labor force) (modeled ILO estimate) 0.045454545 C17 Fuel oil - Production (Metric tons, thousand) 0.045454545 C18 Primary income payments (BoP, current US$) 0.045454545 C19 International tourism, number of arrivals 0.045454545 C20 Violence/Terrorism: Percentile Rank Political Stability and Absence of 0.045454545
In this case study, the judgment of the “the true” weights are vague and cannot exactly be evaluated with numerical values in practice or if so, it would be probably time-consuming and challenging and it must be consulted by experts. Hence, the Equal weight method was used in this study.
28
Table 4.3: The Data Collected from the Data Banks
C1 C2 C3 C4 C5 C6 C7 C8 C9 C1 C01 C11 C12 C31 C41 C51 C61 C71 C81 C92 0 A1 106. 3842857 -415855 7748 6 20459648 13 84300002. 97 11742998 528 15164653 11 11836053 495 76868024 08 7. 5144745 6482579. 067 1. 753038794 6326. 188293 8. 166666667 59702211 98 8. 586666616 0 14058896 5. 2 0 1. 500844397 A2 98. 21571429 -644673 304. 1 9. 377212397 18701207 70 37439036 4. 4 73045700 43 84927520 9. 8 76397678 96 33957146 09 3. 827336337 1456846 3. 447689984 0 12. 38461538 12530921 43 23. 51333326 0 38728615 1. 9 564312. 5 41. 85964762 A3 100. 0657143 64564325 63 10. 288125 18976217 93 8 39789950 0 36436635 624 38673226 30 33766383 312 10261355 313 7. 490099145 4221263. 733 3. 37554037 437961 37. 30769231 56285695 10 7. 206666629 1757. 533333 31729696 88 1252000 24. 47337208 A4 108. 0721429 13991240 43 2. 154322917 15624129 172 31060389 9. 4 21190082 197 29 600266 49 19203762 650 10925402 550 5. 734040474 540518. 1333 3. 811014823 396629. 0667 9. 311111111 35726077 57 4. 139999978 2591. 8 60301258 13 7531750 32. 92794704 A5 87. 52214286 -130667 2102 4. 335625 10271964 810 24946212 1. 9 20391207 326 34906972 50 19850205 078 109100 81 892 2. 088217689 542025. 2 1. 944291164 0 8 25195971 00 6. 720000092 374 56760803 44 2426250 61. 92964503 A6 102 -224613 1250 7. 42125 36316306 250 -407694 3750 1. 73505E + 11 20202143 439 1. 71447E + 11 47261600 000 9. 337000942 24873670. 47 2. 430242244 1798040. 266 15. 1923 0769 21210456 052 10. 57333317 9835. 266667 34011750 00 8894706. 25 20. 46945546 A7 90. 90857143 -115040 3286 8. 740621482 34952247 57 -770180 940. 9 97009255 65 17575992 14 96045663 04 53873889 35 5. 590054615 2137813. 6 3. 392726864 658. 4514492 10 14638922 92 13. 81333338 1 0. 2 59705641 5. 9 2071500 36. 32699165 A8 100. 9742857 -202508 5548 12. 86471436 29727000 000 -390000 00 3. 26564E + 11 36132926 153 3. 26976E + 11 17503000 000 19. 08730211 23911982. 87 2. 683124143 4560958. 173 22. 42307692 14156029 152 12. 16666679 26577. 70674 60400000 0 2726 625 16. 20234604 A9 104. 8014286 57511666 667 7. 3555 54547650 000 -133928 7500 1. 39129E + 11 30042896 817 1. 40293E + 11 39419762 500 9. 215669883 6977413. 667 3. 015769804 205648. 8542 30 45516559 759 18. 2266667 10857. 46667 23420250 00 920250 2. 708794063 A10 96. 89642857 50582500 00 3. 240514397 70641768 750 -169963 7500 2. 00151E + 11 46276973 560 1. 94645E + 11 68905587 500 1. 893476536 2999324. 733 6. 807611162 96273. 86667 17. 69230769 49572421 507 7. 953333314 2843. 333333 10617362 500 2183031. 25 12. 03393923 A11 102. 5292857 -171370 5298 4 .361197917 97160267 45 -160531 7812 20768741 898 42074519 88 20851657 344 15329322 127 4. 848972861 1539683. 667 5. 382616749 7568. 862 19. 5 89981197 83 13. 49333331 1161. 82 75352656 0. 8 3251750 32. 01249301 A1 2 111. 6192857 19119692 5. 3 10. 5 49649911 517 -589279 7216 1. 13 869E + 11 11848270 815 1. 01216E + 11 36124922 737 12. 83286153 8351611. 533 1. 032495486 1116707. 039 24. 76923077 17279304 197 7. 460000038 3273. 533333 14410570 452 3259000 51. 6913264
29
Table 4.4: The Data Collected from the Data Banks
C1 C2 C3 C4 C5 C6 C7 C8 C9 C10 C11 C12 C13 C14 C15 C16 C17 C18 C19 C20 A13 114. 4678571 35776039 799 3. 292455729 67395882 421 52285327 91 1. 03918E + 11 17832186 435 1. 13126E + 11 31266041 420 5. 167615908 1365855. 133 4. 709538742 497408. 4667 34. 09230769 19878697 575 1. 926666665 9853. 066667 13877745 26 189500 54. 60821126 A14 103. 3221429 -736044 3750 2. 580555556 32447407 143 18623571 4. 3 48475331 827 58172488 56 51264587 068 18813764 286 8. 986695767 2201752. 267 1. 821649364 431775. 9333 35 69668486 476 19. 16666705 46 31. 6 21843428 57 1195312. 5 39. 26926723 A15 111. 8314286 29666989 15 3. 4306875 31079981 312 -525766 783 47390588 427 98253901 17 45041201 210 21093371 773 10. 53360985 1196272. 133 11. 63797403 918722. 7999 20. 66923077 93477989 78 7. 706666724 2642. 4 30033073 92 765538. 46 15 72. 94846369 A16 98. 41857143 -283980 8125 6. 172569444 22051344 375 -189575 0000 1. 56199E + 11 15623137 600 1. 61743E + 11 33917851 875 5. 89713058 53170279. 53 3. 761953544 1214989. 722 21. 61538462 11917398 649 6. 106666597 2874. 2144 37794343 75 1425575 3. 532727806 A17 107. 7828571 35770132 118 2. 744881655 1. 28349E + 11 56272992 31 97340508 158 13892101 648 1. 15503E + 11 56143051 282 13. 8244695 893884. 8 2. 322647067 3398795. 066 8. 311111111 16394659 654 0. 686666673 457. 3333333 16578183 132 11498937. 5 84. 41719767 A18 91. 56 68567657 63 9 3. 76 2. 28305E + 11 -110791827 31 4. 48624E + 11 1. 01649E + 11 4. 55605E + 11 1. 42446E + 11 4. 424037036 9084242. 6 9. 158765455 2497121. 506 36. 89230769 3. 42655E + 11 5. 513333321 25502. 2 79581103 56 359062. 5 34. 40593287 A19 97. 99571429 -317465 6405 0. 990747512 61120675 02 -1 47577 8776 46733182 715 44990624 54 41850779 438 79864095 96 14. 80931314 10260410. 8 3. 961470102 243567. 2667 37. 33333333 72955745 5. 3 14. 73333352 474. 7333333 24036625 58 4170666. 667 2. 686493965 A20 91. 07857143 52899220 1. 4 6. 549568171 12252029 927 -803211 603. 3 2643 9983 632 34092696 18 25602424 463 11519116 420 6. 951190273 5352849. 4 5. 140119538 102002. 796 25. 42307692 18199095 808 10. 0733333 4421. 64 13349661 36 6350312. 5 23. 68783046 A21 98. 68928571 -185258 6132 5 17185847 501 -119303 4080 36935528 153 64159942 44 35252482 742 19 189078 535 3. 870313008 3608193. 933 1. 52787762 25700. 6 11 62996318 19 14. 07999992 550. 8 18468988 91 25463500 40.8284167 A22 101. 24 -296740 6250 27. 04588542 1. 36792E + 11 -852118 7500 5. 64431E + 11 77954282 170 5. 57919E + 11 1. 61873E + 11 16. 13501119 24070106. 53 2. 716760 606 1872955. 058 9. 538461538 71720893 825 10. 09999994 5549. 533333 11087000 000 5446333. 333 18. 48780969 A23 108. 3607143 -514562 5000 14. 43452381 81481184 23 -244952 960. 9 24111269 479 32213466 34 22646388 756 10524055 386 11. 92243284 5818780. 467 5. 053816026 296392. 8 333 41. 5 57323944 96 15. 83333346 549. 2 16748297 26 635887. 5 5. 654212544
In the following chapter, the calculated results from the three methods are shown and discussed.
30 5. DISCUSSION RESULTS
This chapter discusses the calculated results that were obtained from the different methods used in this case study. The given data was first calculated using TOPSIS and ELECTRE in excel platform in a highly precise way. And further on, the third method, PROMETHEE was introduced in order to demonstrate better and more accurate results.
5.1 TOPSIS
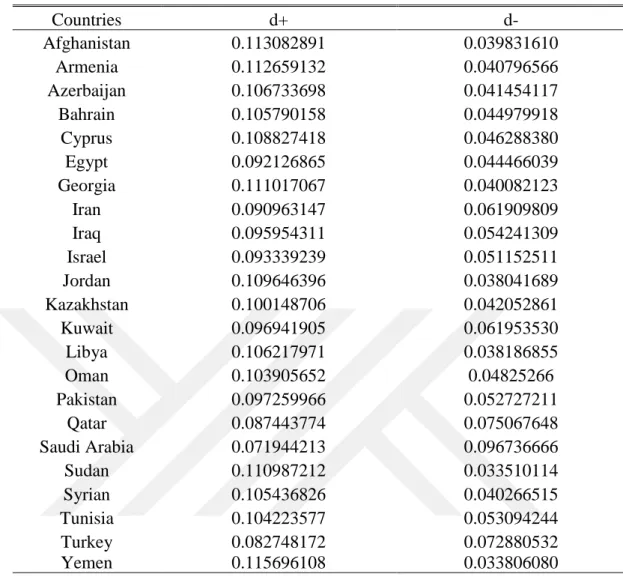
The Euclidean distances between the ideal and non-ideal of each alternative were calculated in table 5.1. For instance, the distance between the ideal and the non-ideal point of Afghanistan is 0.113082891 and 0.039831610. In the next step after calculating the final ideal solution for all alternatives, table 5.2 was designed to show the final ranking results of the selected MENA countries using TOPSIS.
31
Table 5.1: The Ideal and Non-ideal Distances results using TOPSIS
Countries d+ d- Afghanistan 0.113082891 0.039831610 Armenia 0.112659132 0.040796566 Azerbaijan 0.106733698 0.041454117 Bahrain 0.105790158 0.044979918 Cyprus 0.108827418 0.046288380 Egypt 0.092126865 0.044466039 Georgia 0.111017067 0.040082123 Iran 0.090963147 0.061909809 Iraq 0.095954311 0.054241309 Israel 0.093339239 0.051152511 Jordan 0.109646396 0.038041689 Kazakhstan 0.100148706 0.042052861 Kuwait 0.096941905 0.061953530 Libya 0.106217971 0.038186855 Oman 0.103905652 0.04825266 Pakistan 0.097259966 0.052727211 Qatar 0.087443774 0.075067648 Saudi Arabia 0.071944213 0.096736666 Sudan 0.110987212 0.033510114 Syrian 0.105436826 0.040266515 Tunisia 0.104223577 0.053094244 Turkey 0.082748172 0.072880532 Yemen 0.115696108 0.033806080
32
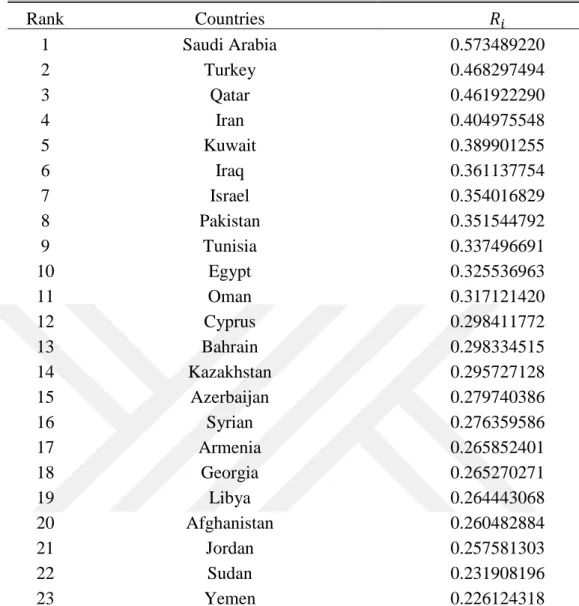
Table 5.2: Ranking the Middle East and North Africa countries using TOPSIS
Rank Countries 𝑅𝑖 1 Saudi Arabia 0.573489220 2 Turkey 0.468297494 3 Qatar 0.461922290 4 Iran 0.404975548 5 Kuwait 0.389901255 6 Iraq 0.361137754 7 Israel 0.354016829 8 Pakistan 0.351544792 9 Tunisia 0.337496691 10 Egypt 0.325536963 11 Oman 0.317121420 12 Cyprus 0.298411772 13 Bahrain 0.298334515 14 Kazakhstan 0.295727128 15 Azerbaijan 0.279740386 16 Syrian 0.276359586 17 Armenia 0.265852401 18 Georgia 0.265270271 19 Libya 0.264443068 20 Afghanistan 0.260482884 21 Jordan 0.257581303 22 Sudan 0.231908196 23 Yemen 0.226124318
As it can be seen in table 5.2, the top five countries which have the highest score among other countries studied in this research are Saudi Arabia followed by Turkey, Qatar, Iran and Kuwait, where all the selected criteria were considered and compared to each other using TOPSIS. This table can show to its audiences a general idea of how well these countries are performing contrasted with each other in the region. So, if these countries are tagged for any foreign investments, partnership or any open market in different sectors and industries in the future this table can be helpful.
33
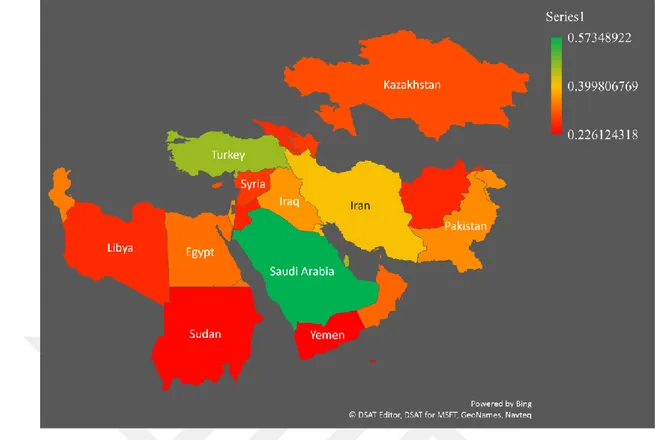
Figure 5.1: The Middle East and North Africa Map chart using TOPSIS Based on the results from TOPSIS figure 5.1 was created, in this map chart, the twenty-three countries of the MENA region are presented in different colors from the highest rank (score 0.57348922) to lowest (score 0.226124318). Those countries which have a better score with higher ranks are colored green and light green, see Saudi Arabia, Turkey, and Qatar. As the scores and rankings move down, the colors are changing to dark yellow and orange, for instance, Iran, Kuwait, Iraq and at the lowest ranked countries are colored dark red, for instance, Afghanistan, Jordan, Sudan and Yemen.
Both table 5.2 and figure 5.1 can give us a general overview of the situation in the chosen MENA countries. So, it becomes more likely that Saudi Arabia is targeted by foreign investors since it has been ranked with the highest score as the first country in the MENA region. Saudi Arabia is neighboring with Qatar, Iraq, Jordan, and Oman therefore, it is important to considerate its neighboring countries in terms of changes in different aspects which can influence Saudi Arabia.
34 5.2 ELECTRE
The second method applied in this research was ELECTRE where the following table has been obtained.
Table 5.3: Ranking the Middle East and North Africa countries using ELECTRE
Rank Country Score
1 Egypt, Arab Rep. 6
2 Yemen, Rep. 6 3 Israel 5 4 Turkey 5 5 Kazakhstan 4 6 Azerbaijan 3 7 Libya 3 8 Bahrain 2 9 Iraq 2 10 Jordan 2 11 Saudi Arabia 2
12 Syrian Arab Republic 1
13 Afghanistan 0
14 Iran, Islamic Rep. 0
15 Qatar 0 16 Kuwait -1 17 Georgia -2 18 Sudan -2 19 Pakistan -3 20 Oman -4 21 Cyprus -6 22 Armenia -10 23 Tunisia -12
Table 5.3 shows the new ranking that was done using ELECTRE. In this method, each country has given a score that was calculated with respect to other alternatives and criteria in this research. As shown ELECTRE assigned the highest scores to Egypt, Yemen, Israel, Turkey, and Kazakhstan. Both Egypt and Yemen have the same score of 6 and both Israel and Turkey have 5 scores followed by Kazakhstan with a score of 4. In this method countries like Saudi Arabia, Kuwait and Iran are placed below the top ten countries ranked by ELECTRE.
35
Figure 5.2: The Middle East and North Africa Map chart using ELECTRE The map chart in figure 5.2 was created based on the results given by ELECTRE, but as it can be seen in this map chart most of the unexpected countries were marked as green. Therefore, by comparing the result of TOPSIS and ELECTRE, it is clear that ELECTRE is not a suitable method to use in such ranking as it has also shown in table 5.3 and figure 5.2. Therefore, PROMETHEE was introduced to carry on the calculations. The results are actually too close to each other and not clear.
36 5.3 PROMETHEE
The following table was calculated using PROMETHEE in Visual PROMETHEE.
Table 5.4: Ranking the Middle East and North Africa countries using PROMETHEE
Rank Country Phi Phi+ Phi-
1 Saudi Arabia 0.3729 0.4974 0.1245 2 Turkey 0.2493 0.3814 0.1321 3 Qatar 0.238 0.3234 0.0854 4 Iran 0.1061 0.2341 0.128 5 Kuwait 0.0566 0.1557 0.0991 6 Israel 0.0555 0.1477 0.0921 7 Oman 0.0441 0.1383 0.0942 8 Egypt 0.0007 0.0917 0.091 9 Bahrain -0.0066 0.0853 0.092 10 Kazakhstan -0.0097 0.1104 0.1201 11 Tunisia -0.0107 0.1065 0.1172 12 Pakistan -0.0116 0.0914 0.1029 13 Cyprus -0.034 0.0937 0.1277 14 Jordan -0.0637 0.0503 0.114 15 Afghanistan -0.0695 0.0573 0.1267 16 Iraq -0.0752 0.0685 0.1437 17 Azerbaijan -0.0879 0.0397 0.1275 18 Georgia -0.0881 0.0491 0.1372 19 Armenia -0.0959 0.0572 0.1531 20 Syrian -0.0994 0.0317 0.1311 21 Libya -0.1328 0.0287 0.1615 22 Yemen -0.1521 0.0569 0.209 23 Sudan -0.1863 0.0111 0.1973
Table 5.4 above shows the results of the final ranking in the selected MENA countries based on PROMETHEE, each country (alternative) has given a Phi+, Phi- and Phi scores. For instance, Phi+ (positive outranking flow) of Saudi Arabia shows how much better Saudi Arabia is than other countries. Moreover, the highest value of Phi+ is preferable alternatives than others. And Phi- shows the negatives outranking flow where expresses how the alternative (Saudi Arabia) outranked by other alternatives (countries) and Phi (net flow) is the subtraction of negative form positive outranking whereby the highest net flow considers the best alternative.