2008 CRISIS: ARE RISK MANAGERS GUILTY
GÜLGÜN F
Đ
GEN ÖZTA
Ş
104626029
Đ
STANBUL B
Đ
LG
Đ
ÜN
Đ
VERS
Đ
TES
Đ
INSTITUTE OF SOCIAL SCIENCES
MASTER OF SCIENCE IN FINANCIAL ECONOMICS
PROF. DR. BURÇ ÜLENG
Đ
N
2008 Crisis: Are Risk Managers Guilty?
Gülgün Figen Erkan
104626029
Prof. Dr. BURÇ ÜLENG
Đ
N :
Asst. Prof. Dr. ORHAN ERDEM :
Asst. Prof. Dr. KORAY AKAY :
APPROVAL DATE
: ...
Number of Pages: 106
Keywords
Anahtar Kelimeler
1) Risk Managers
1) Risk Yöneticileri
2) 2008 Crisis
2) 2008 Krizi
3)
3)
4)
4)
‘’ABSTRACT’’
After the banking industry has spent millions of dollars to establish risk management systems, many people blame risk managers about the ‘’perfect storm’’ that they weren’t able to see it coming, their models did not work. This thesis aims to be an objective ground to discuss whether it is the failure of Risk Managers or not? Having looked from many points of view, I have found Risk Managers not guilty. The place and lacking authority of risk managers in institutions have shown me that they were not the true convicts to be addressed for these failures. Moral hazard, senior managers’ and rating agencies incentive problems and government policies which have led to the de-regulation of the markets are some of the real causes behind this misery. I accept that there are flaws in risk management systems and risk managers status as well. Risk managers quant profile has to change in order to place risk managers as business partners. I find, establishing firm-wide risk management culture and improving Enterprise Risk Management is very crucial. 'Back to basics must come again as simple is the best. Models must be built linked to macroeconomic indicators and history must always be remembered.
‘’ÖZET’’
Bankacılık endüstrisi risk yönetim sistemlerine milyonlarca dolar sarfettikten sonra, yaklaşmakta olan ‘’mükemmel fırtınayı’’ önceden öngörmemeleri ve modellerinin yetersiz kalmasından dolayı çoğu kişi risk yöneticilerini suçlamıştır. Bu tezin amacı hatanın gerçekten risk yöneticilerine ait olup olmadığını objektif bir bakış açısıyla ele almaktır. Pek çok farklı açıdan inceledikten sonra risk yöneticilerini suçsuz buldum. Konumları ve etkin otoriteye sahip olmamaları onların bu başarısızlıklardan dolayı suçlanabilecek doğru adres olmadıklarını anlamama neden oldu. Bu muammanın ardındaki gerçek nedenler arasında ahlaki bozukluklar, üst düzey yöneticiler ile rating şirketlerinin menfaat çıkar ilişkileri ve piyasalarda deregülasyona yol açan devlet politikalarını sayabiliriz. Risk yönetim sistemlerinde ve risk yöneticilerinin rollerinde bazı açıklar olduğunu kabul etmekteyim. Risk yöneticilerinin quant profili, onları iş ortaklığı statüsüne getirmek için değişmelidir. Kurum bazında risk yönetim kültürünü oluşturmanın ve kurumsal risk yönetimi çerçevesinin geliştirilmesinin çok kritik olduğunu düşünmekteyim. Temel prensiplerin en iyisi en basit olandır fikrinden hareketle geri gelmesi gerekmektedir. Modeller makro ekonomik endikatörlere bağlı olarak kurulmalı ve tarih her zaman hatırlanmalıdır.
TABLE OF CONTENTS
1. INTRODUCTION ... 1
2. MACROECONOMICS AND GOVERNMENT ... 3
2.1 USGOVERNMENT POLICY AND THE WORLD’S NEW SHAPE... 3
2.2 EFFECTS OF GOVERNMENT POLICIES... 4
2.3 CHANGING LAWS... 5
2.4SPECIAL PURPOSE VEHICLES... 5
2.5ON THE POSITIVE SIDE... 15
a) As a Result of the Government Policies ... 15
2.6.ON THE NEGATIVE SIDE... 15
a) Warning speeches Ignored by Governmental Bodies ... 15
b) Ignored Forecasts Concerning Construction Sector... 17
c) Misleading Speeches done by Government Authorities... 17
d) Ignored Worries About Hedge Funds Growth ... 18
e) Ignored Concerns About Special Purpose Vehicles ... 18
3. MARKET AND MARKET PLAYERS... 20
3.1BANKING SECTOR... 21
a) Basel II regulation ... 23
b) Increased Leverage in the Banking Industry ... 24
3.2RATING AGENCIES... 28
3.3MONOLINE INSURANCE... 30
a) Ambac... 31
b) MBIA... 31
c) Credit rating downgrades of Monoline Insurers ... 32
3.4HEDGE FUNDS... 33
3.5ON THE POSITIVE SIDE... 38
a) Tax and Other benefits of Monoline Insurers... 38
3.6ON THE NEGATIVE SIDE... 39
a) Conflict of Interest in Rating Agencies ... 39
b) Giving Permissions to be Highly Leveraged... 40
c) Ignored the huge growth of Hedge Funds and connected risks... 41
d) Regulatory Bodies Fault in De-regulation ... 41
e) Basel II reliance on ratings ... 41
4. ROLE OF RISK MANAGEMENT ... 42
4.1WHAT IS RISK MANAGEMENT... 42
4.2ASNAPSHOT OF RISK MANAGEMENT ORGANIZATIONS JUNE 2007 ... 44
a) Compliance champion ... 44
b) Modelling expert... 44
c) Strategic advisor ... 45
d) Strategic controller... 45
5. WAS IT A FAILURE OF RISK MANAGERS ... 56
5.1ON THE NEGATIVE SIDE... 56
a) Some of the Early Warning signs Ignored by Risk Managers... 56
b) Omitted the warning speeches ... 59
e) Lack of stress tests (covering correlations) ... 60
f) Too much reliance on models ... 61
g) Models Failed to Capture Risks Associated with Crisis ... 63
h) Improper Model Assumptions... 64
i) Too involved in the implementation of Basel II ... 65
j) Lack of communication ... 66
k) Left the basics (like leverage, liquidity & concentration)... 67
l) Failed to Establish Enterprise Risk Management ... 68
m) Too much reliance on rating agencies... 70
n) Did not learn from past risk management failures (LTCM) and did not implement best practices (CRMPG report) ... 71
o) Lack of Integrating Market and Credit Risks of their counterparties on a firm-wide basis in a short period of time... 74
5.2ON THE POSITIVE SIDE... 74
a) Even Some Economists Failed to See ... 74
b) Fuzzy role in corporate governance ... 75
c) Cultural position of the risk function... 75
d) Senior management incentives... 76
e) Moral Hazard... 78
f) Risk Management Does not Prevent Losses ... 80
g) Arising conflict when there is lack of enough historical data... 80
h) All Risks Can Not be Accounted For ... 80
i) Quick Changing Risk Characteristics ... 81
j) Daily Var is Known to be a good estimate for Short Horizons ... 82
k) Predatory Trading ... 84
l) Vanishing of Liquidity Risk Premiums... 84
m) Pressure on Risk Departments by Business Lines ... 86
n) Other Issues related to positive side ... 87
5.3CRISIS PERCEPTION OF TURKISH FINANCIAL SECTOR... 87
6. CONCLUSION & ADVICES... 93
APPENDICES... 102
A)IN DEPTH INTERVIEW QUESTIONS:... 102
REFERENCES ... 103
LIST OF TABLES... 106
1.
INTRODUCTION
The global financial crisis of 2008 is a major financial crisis, the worst of its kind since the Great Depression, which is ongoing as of December 2008. It became strikingly visible in September 2008 with the failure, merger or conservatorship of several large United States-based financial firms. The underlying causes leading to the crisis had been reported in business journals for many months before September, with commentary about the financial stability of leading U.S. and European investment banks, insurance firms and mortgage banks consequent to the sub-prime mortgage crisis.
Beginning with failures of large financial institutions in the United States, it rapidly evolved into a global crisis resulting in a number of European bank failures and declines in various stock indexes, and large reductions in the market value of equities (stock) and commodities worldwide. The crisis has led to a liquidity problem and the de-leveraging of financial institutions especially in the United States and Europe, which further accelerated the liquidity crisis. World political leaders and national ministers of finance and central bank directors have coordinated their efforts to reduce fears but the crisis is ongoing and continues to change, still evolving at the time being into a currency crisis with investors transferring vast capital resources into stronger currencies such as the yen, the dollar and the Swiss franc, leading many emergent economies to seek aid from the International Monetary Fund. The crisis was triggered by the sub-prime mortgage crisis and bottom line has not been reached yet.
This is very challenging since we witness unbelievable things to happen everyday and will all be witnesses to the reshaping of the world’s new financial system.
This paper aims to be an objective ground to decide whether Risk Managers are guilty because they did not do their job and made their firms loose millions of usd and even go bankruptcy.
In order to do this I will look from very different aspects from the beginning of the crisis up to date. These will cover: the reasons behind the crisis, government policies, market players and risk managers status; economists, regulators, rating agencies point of view as
well as government politics, macro economy, lessons learned from financial disasters previously happened.
I will also take a look at the latest industry and expert comments, articles, press releases, papers in order to reach a healthy and objective conclusion.
As a risk manager I will also give my comments about what must be done to improve risk management in order to overcome these failures and will also give you some of the new debates going on in order to give risk management a new shape from experts, academicians, market participants and also regulators consultations.
In order to do that I will look from different points of view. These will cover Macroeconomics and Government Policies, Market Players and Risk Managers.
2.
MACROECONOMICS AND GOVERNMENT
In this topic I aim to give a brief outlook of the world’s economy, the situation of the world and balances just before the 2008 crisis.
2.1
US Government Policy and the World’s New Shape
In year 2000 American consumers had started to make more savings due to the crisis they faced one after another in recent years. American governors were afraid to face recession and deflation. In an economy whose share of private consumption covers two thirds of the economy, it was very hard to grow without consumption expenditures. So they had to give confidence to consumers, who had started to make savings due to their worries about crisis together with their future worries. By this way they would also be able to increase employment levels in the economy.
After 2001 recession, US government policy was to lower interest rates in order to awake the economy. These changes can be tracked in the following figure which shows US inflation with Fed interest rates.
0,0% 1,0% 2,0% 3,0% 4,0% 5,0% 6,0% 7,0% 8,0% 9,0% 1 9 9 0 1 9 9 1 1 9 9 2 1 9 9 3 1 9 9 4 1 9 9 5 1 9 9 6 1 9 9 7 1 9 9 8 1 9 9 9 2 0 0 0 2 0 0 1 2 0 0 2 2 0 0 3 2 0 0 4 2 0 0 5 2 0 0 6 2 0 0 7 2 0 0 8 0,00% 1,00% 2,00% 3,00% 4,00% 5,00% 6,00% 7,00% 8,00% 9,00% Fed Rate Inflation Rate
As can be seen from the figure US government policy lowering interest rates went on till the end of 2003. These cut in interest rates increased the demand towards borrowing opportunities and also making it cheaper.
Since the stock market had recently gone out of a crisis, demand headed directly to real estate properties.
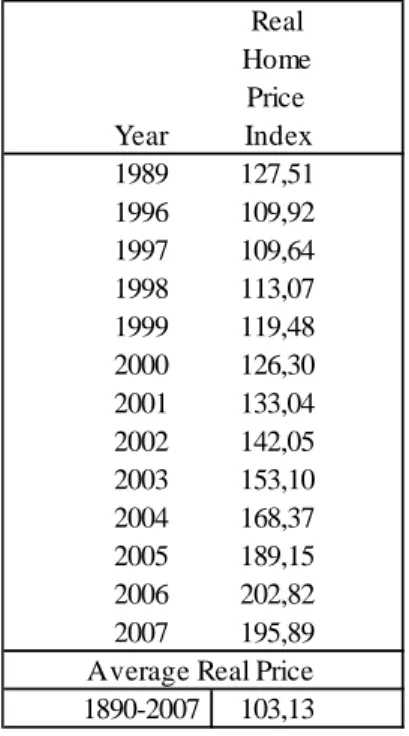
This demand towards real estate made their prices go higher and higher. These increases in prices can be tracked also with Schiller’s index given below.
Table 2-1 Schiller’s Real Home Price Index
Real Home Price Year Index 1989 127,51 1996 109,92 1997 109,64 1998 113,07 1999 119,48 2000 126,30 2001 133,04 2002 142,05 2003 153,10 2004 168,37 2005 189,15 2006 202,82 2007 195,89 1890-2007 103,13 Average Real Price
2.2
Effects of Government Policies
Government interest rate policies led to cheap and plenty borrowing opportunities which also motivated the huge growth of hedge fund industry. This industry is known as being the leader of the most speculative group of investors which I will discuss in detail in the next chapter.
The increase in home prices led homeowners to take extra loans from financial institutions for other type of retail credits with the differences.
By 2003 or so, mortgage lenders were running out of people they could plausibly lend to. Instead of curtailing lending, they spread their nets to people with little hope of repaying their loans.
Sub-prime lending jumped from an annual volume of 145 billion usd in 2001 to 625 billion usd in 2005, more than 20 % of total issuances. More than a third of sub-prime loans were for 100% of the home value-even more when the fees were added in. Light documentation mortgages transmuted to ‘’ninja loans’’-no income, no job, no assets. (Morris, 2008, p.69)
By securitization Banks transformed these illiquid assets into liquid assets with the help of Special Purpose Vehicles.
2.3
Changing Laws
Government made a change in laws concerning mortgage buyers. This was done to prevent time consuming legal barriers in order to increase the markets efficiency. With this new change they brought a walk away clause which simply let mortgage owners to walk away from their homes without any further legal action. These new arrangements also increased the attraction to these types of loans.
2.4 Special Purpose Vehicles
Fannie Mae and Freddie MacIn fact government loosening mortgage buyer’s laws was also due to a deep trust in mortgage associations like Fannie Mae and Freddie Mac. Fannie Mae is a government sponsored enterprise (GSE), founded in 1938 during the Great Depression. The corporation's purpose is to purchase and securitize mortgages in order to ensure that funds are consistently available to the institutions that lend money to home buyers. In other words Fannie Mae buys loans from mortgage originators, repackages the loans as mortgage-backed securities, and sells them to investors in the secondary mortgage market with a guarantee that principal and interest payments will be passed through to the investor
in a timely manner. Also, Fannie Mae may hold the purchased mortgages for its own portfolio.Freddie Mac was created in 1970 to expand the secondary market for mortgages in the US. Along with other government sponsored enterprises, Freddie Mac buys mortgages on the secondary market, pools them, and sells them as mortgage-backed securities to investors on the open market. This secondary mortgage market increases the supply of money available for mortgages lending and increases the money available for new home purchases.
And also by purchasing the mortgages, Fannie Mae and Freddie Mac provide banks and other financial institutions with fresh money to make new loans. This gives the United States housing and credit markets flexibility and liquidity.
With the huge growth of mortgage loans they had become highly leveraged.
Fannie Mae’s total assets were 882.5 billion usd and its equity was only 44 billion usd and same way Freddie Mac’s total assets were 794.4 billion usd and its equity was only 26.7 billion usd in 2007.
As of 2008, Fannie Mae and the Federal Home Loan Mortgage Corporation (Freddie Mac) owned or guaranteed about half of the U.S.'s $12 trillion mortgage market.
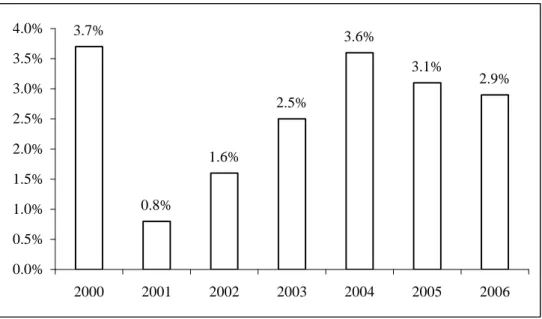
As a result of governments policies towards increasing consumption, growth rate of US Economy which were lower than %2 in year 2001 with the decrease in consumption dynamics due to worries about recession, increased its speed making a 5 year average of %3 which could be seen in the figure below.
3.7% 0.8% 1.6% 2.5% 3.6% 3.1% 2.9% 0.0% 0.5% 1.0% 1.5% 2.0% 2.5% 3.0% 3.5% 4.0% 2000 2001 2002 2003 2004 2005 2006
Figure 2-2 USA Economics Growth (real, GDP)
The growth in US Economy which was due to consumptions made more than savings, started to show itself in the current balance deficit increase. In year 2002 the current balance deficit which was around 400 billion usd corresponding to %4 of Gdp increased to 800 billion usd, 7% of Gdp in year 2006.
-424 -390 -501 -536 -711 -813 -838 -4.0% -4.2% -4.7% -5.1% -5.6% -6.2% -6.5% -1,200 -800 -400 0 2000 2001 2002 2003 2004 2005 2006 -7% -5% -3% -1% 1%
Figure 2-3 Current Account Balance of USA
This high negative gap meant US economy was unable to raise funds for expenses through savings and therefore had to find foreign funding source for finance.
The profile of investments was worrisome for US politicians. After 2000 crisis long term investments were made in bonds heavily rather than stocks and equity investments. Especially there was a huge decrease in equity investments from 314 billion usd in year 2000 to 53 billion usd in 2003. Stock investments raised only a little after 2004. Bond investments were rising up to 4.7 trillion usd with a %161 increase when compared with 2000 figure. In fact bond investments have low risk profile which reflects that investors were keeping away from US stock and capital investment risk which indicate investors had worries about US current balance deficit.
2.0 1.5 1.6 2.1 2.2 2.6 1.8 2.5 2.9 3.5 4.1 4.7 0 2 4 6 8 2000 2002 2003 2004 2005 2006 Trillion $
Equity Investment + Stock Bond
Figure 2-4 (Long-Term) Foreign Investment Made to USA
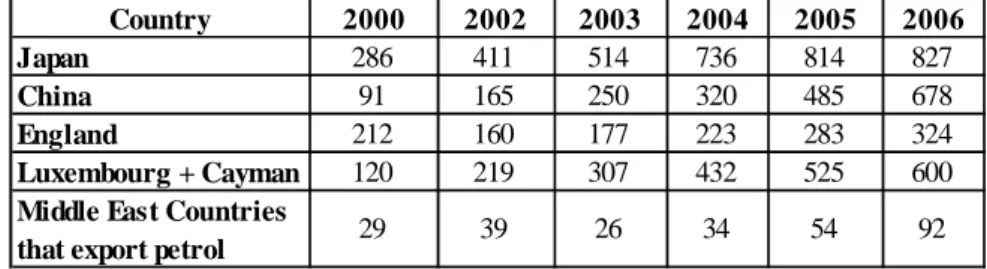
There was also another worry for US governors that majority of US government bonds were being held by central banks which has a potential to be influenced by political directives. Indeed investments of China, Japan and Middle East countries that export petrol were sharing top of the list which have sensitive political relations with US that can be a threaten for the economy.
Table 2-2 Portfolio of Countries who held Long Term Investments in US Bonds (Billion $)
Country 2000 2002 2003 2004 2005 2006
Japan 286 411 514 736 814 827
China 91 165 250 320 485 678
England 212 160 177 223 283 324
Luxembourg + Cayman 120 219 307 432 525 600
Middle East Countries
While US economy being the growth engine of the global economy with its consumption power, Asian economies were becoming the production engine, China being the leader. On the production side China and on the technology side India were going on integrating with the world offering their challenging production facilities to global and native customers. China reached an average of %10 growth speed between 2002 and 2006, becoming the fourth biggest economy following US, Japan and Germany. During this time Asian Five which consist of India, South Korea, Malaysia, Philippines, Singapore and Indonesia grew around %6 accompanying Chinese economy.
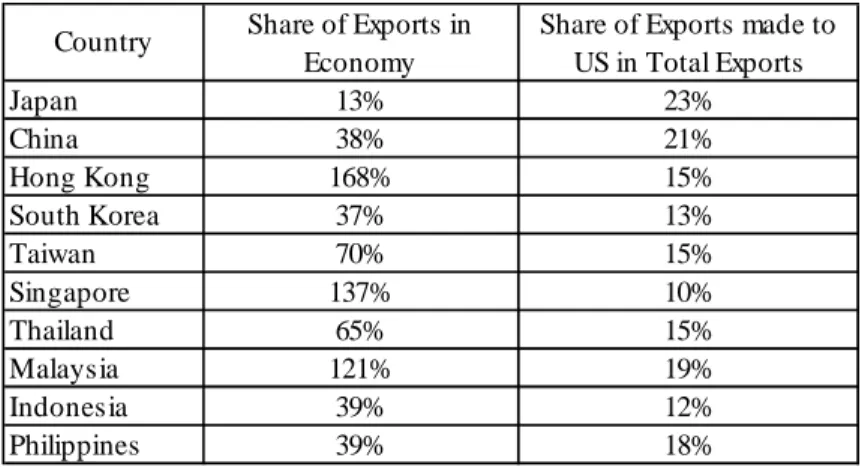
Asian consumption did not follow production output because income levels did not increase accordingly. Source underlying this growth was exports and US market was holding a big portion of this amount. Some small economies like Singapore, Hong Kong and Malaysia’s export volumes were exceeding their economic sizes. Import shares in economies were greater than %50 in Taiwan and Thailand and were more than one third in bigger economies like China and South Korea. Since these counties did not have natural energy sources, they had to import petrol, energy, other commodities and metals.
Table 2-3 The Importance of Exports and US Market for Asian Countries
Country Share of Exports in Economy
Share of Exports made to US in Total Exports Japan 13% 23% China 38% 21% Hong Kong 168% 15% South Korea 37% 13% Taiwan 70% 15% Singapore 137% 10% Thailand 65% 15% Malaysia 121% 19% Indonesia 39% 12% Philippines 39% 18%
This was the growth engine of the world Economy.
While US consuming, Asian countries were producing goods and services depending on natural sources which were supplied from Latin America to Africa.
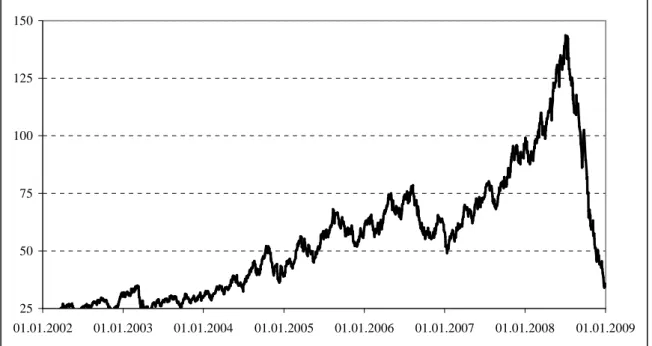
For example China’s petrol import had increased from 1.4 million barrels in year 2000 to 3.4 million barrel in 2006 per day.
These demand towards natural sources increased their prices accordingly. 25 50 75 100 125 150 01.01.2002 01.01.2003 01.01.2004 01.01.2005 01.01.2006 01.01.2007 01.01.2008 01.01.2009
Figure 2-5 Brent Petrol Price (SPOT - $)
These increases were also followed by other types of metals and commodities appreciations in values. 100 200 300 400 500 600 700 800 900 1,000 01.01.01 01.01.02 01.01.03 01.01.04 01.01.05 01.01.06 01.01.07 01.01.08 01.01.09 4 9 14 19 24 Gold Silver(Right Axis)
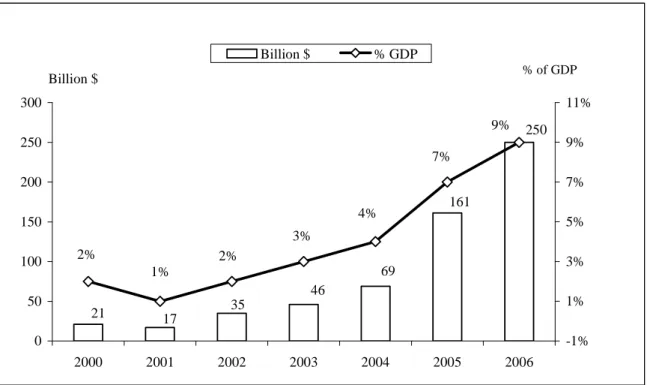
Asian countries foreign exchange income was increasing in an accelerated speed along with current balances in the opposite way with US. At the top of the list was China whose current balance surplus increased from 35 billion usd in 2002 to 250 billion usd in year 2006. 21 17 35 46 69 161 250 2% 1% 2% 3% 4% 7% 9% 0 50 100 150 200 250 300 2000 2001 2002 2003 2004 2005 2006 Billion $ -1% 1% 3% 5% 7% 9% 11% % of GDP Billion $ % GDP
Figure 2-7 Current Account Balance of China
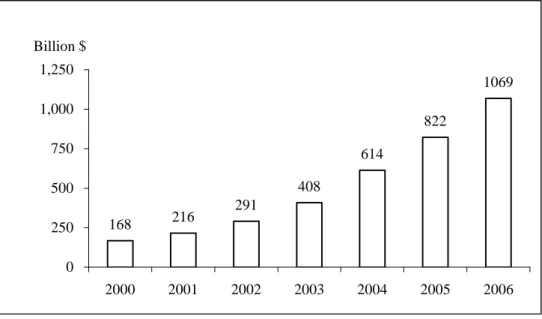
Chinese governors took some precautions in order to avoid falling into a situation like Japan during 1980’s after which the country had suffered a long period of time with recession and deflation loop which still goes on. Communist party resisted all types of pressure in order not to appreciate Yuan like Yen. So Chinese central bank started to buy US dollars in order to keep Yuan’s value cheap. This increased the reserves in a great amount. In year 2006 it was over 1 trillion usd.
168 216 291 408 614 822 1069 0 250 500 750 1,000 1,250 2000 2001 2002 2003 2004 2005 2006 Billion $
Figure 2-8 China's (Formal) Currency Reserves
This increase in reserves was not only special to China. Current account surpluses of other Asian countries, who were also contributing to exports, were also increasing in the same manner.
This increase in reserves was good for central banks but it was causing an inflationary pressure.
They took some precautions to lower the equity inflow into their economy like applying high taxes for short term funding applied in Thailand. Asian and Arabic members of OPEC pegged their currency to usd like Bretton Woods regime. Other than gold they were using usd.
As a consequence global economy grew, world trade volume increased and developed countries left their worries about 2001 recession. In these perspective commodities, emerging market bonds and stocks prices increased and investors earned a lot of money during this boom cycle.
4.8% 2.5% 3.1% 4.0% 5.3% 4.8% 5.4% 0.0% 1.0% 2.0% 3.0% 4.0% 5.0% 6.0% 2000 2001 2002 2003 2004 2005 2006
Figure 2-9 Global Economic Growth
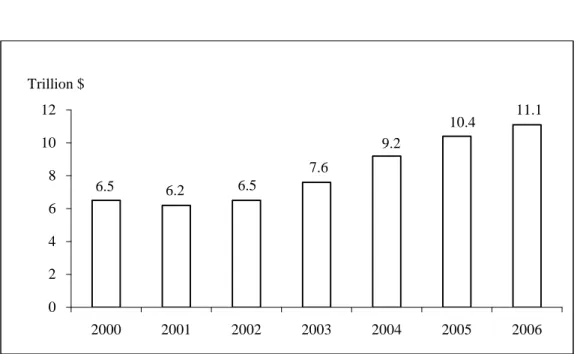
6.5 6.2 6.5 7.6 9.2 10.4 11.1 0 2 4 6 8 10 12 2000 2001 2002 2003 2004 2005 2006 Trillion $
Figure 2-10 World Trading Volume
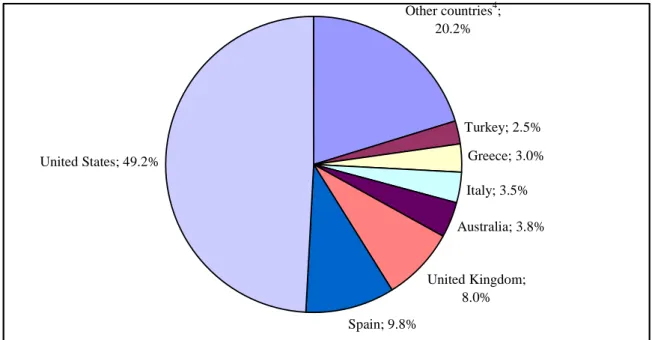
At year 2007 the World’s capital flow pie chart shows us the consequences of these new formations. China and other Asian countries were exporting %37 of World’s capital, followed by Arabic countries, Russia and some European countries and US was importing %50 of the total world’s capital inflow.
China; 21.3% Germany; 14.5% Saudi Arabia; 5.5% Japan; 12.1% Russia; 4.4% Switzerland; 4.1% Norway; 3.4% Netherlands; 3.0% Kuwait; 2.8% Singapore; 2.2% U.A.E; 2.2% Sweden; 2.2% Taiwan Province of China; 1.9% Other Countries2; 20.3%
Figure 2-11 Countries That Export Capital1
Turkey; 2.5% Greece; 3.0% Italy; 3.5% Australia; 3.8% United Kingdom; 8.0% Spain; 9.8% United States; 49.2% Other countries4; 20.2%
Figure 2-12 Countries That Import Capital3
Source: IMF, World Economic Outlook database as of September 25, 2008.
1 As measured by countries account surplus (assuming errors and omissions are part of the capital and
financial accounts).
2 Other countries include all countries with shares of total surplus less than 1.9 percent. 3
As measured by countries’ current account deficit (assuming errors and omissions are part of the capital and financial accounts).
2.5 On the positive side
a) As a Result of the Government Policies
Indeed during these government policies by lowering interest rates and loosening regulations Merrill Lynch estimated that about half of all economic growth in the first half of 2005 was housing-related, either directly through home-building and housing-related purchases, like new furniture, or indirectly, by spending refinancing cash flows. More than half of all new private-sector jobs since 2001, they calculated, were in housing-related activities. By 2005, 40 percent of all home purchases were either for investment or as second homes. (Experts believe that a large share of the ‘’second homes’’ actually are speculations for resale) Since by 2000’s, consumers had learned how to ride down the interest rate curve with abandon. But most Americans might be surprised to learn that over the long term, home prices track very closely to the rate of inflation. (Morris, 2008, pp: 66-68)
2.6. On the Negative Side
a) Warning speeches Ignored by Governmental Bodies
Based on the historic trends in valuations of U.S. housing, many economists and business writers have predicted a market correction, ranging from a few percentage points, to 50% or more from peak values in some markets, and, in spite of the fact that this cooling has not affected all areas of the U.S., some have warned that it could and that the correction would be "nasty" and "severe". Chief economist Mark Zandi of the economic research firm Moody's Economy.com predicted a "crash" of double-digit depreciation in some U.S. cities by 2007–2009. In a paper presented at a Federal Reserve Board economic symposium in August 2007, Yale University economist Robert Shiller warned, “the examples we have of past cycles indicate that major declines in real home prices—even 50 percent declines in some places—are entirely possible going forward from today or from the not too distant future.’’
In August 2006, Barron's magazine warned, "a housing crisis approaches", and noted that the median price of new homes has dropped almost 3% since January 2006, that new-home inventories hit a record in April and remain near all-time highs, that existing-home inventories are 39% higher than they were just one year ago, and that sales are down more than 10%, and predicts that "the national median price of housing will probably fall by close to 30% in the next three years ... simple reversion to the mean." Fortune magazine labelled many previously strong housing markets as "Dead Zones;" other areas are classified as "Danger Zones" and "Safe Havens". Fortune also dispelled "four myths about the future of home prices." In Boston, year-over-year prices are dropping, sales are falling, inventory is increasing, foreclosures are up, and the correction in Massachusetts has been called a "hard landing". The previously booming housing markets in Washington, D.C., San Diego, Phoenix, and other cities have stalled as well. Searching the Arizona Regional Multiple Listing Service (ARMLS) shows that in summer 2006, the for-sale housing inventory in Phoenix has grown to over 50,000 homes, of which nearly half are vacant. CEO Robert Toll of Toll Brothers explained, "builders that built speculative homes are trying to move them by offering large incentives and discounts; and some anxious buyers are canceling contracts for homes already being built." Homebuilder Kara Homes, known for their construction of "Mc Mansions", announced on September 13, 2006 the "two most profitable quarters in the history of our company", yet filed for bankruptcy protection less than one month later on 6 October. Six months later on April 10, 2007, Kara Homes sold unfinished developments, causing prospective buyers from the previous year to lose deposits, some of whom put down more than $100,000.
As the housing market began to soften in winter 2005 through summer 2006, NAR chief economist David Lereah predicted a "soft landing" for the market. However, based on unprecedented rises in inventory and a sharply slowing market throughout 2006, Leslie Appleton-Young, the chief economist of the California Association of Realtors, said that she is not comfortable with the mild term "soft landing" to describe what is actually happening in California's real estate market. The Financial Times warned of the impact on the U.S. economy of the "hard edge" in the "soft landing" scenario, saying "A slowdown in these red-hot markets is inevitable. It may be gentle, but it is impossible to rule out a collapse of sentiment and of prices... If housing wealth stops rising... the effect on the world's economy could be depressing indeed." Angelo Mozilo, CEO of Countrywide
this levels out. I have to prepare the company for the worst that can happen." Following these reports, Lereah admitted that "he expects home prices to come down 5% nationally", and said that some cities in Florida and California could have "hard landings." National home sales and prices both fell dramatically again in March 2007 according to NAR data, with sales down 13% to 482,000 from the peak of 554,000 in March 2006 and the national median price falling nearly 6% to $217,000 from the peak of $230,200 in July 2006. The plunge in existing-home sales is the steepest since 1989. The new home market is also suffering. The biggest year over year drop in median home prices since 1970 occurred in April 2007. Median prices for new homes fell 10.9 percent according to the Commerce Department.
Based on slumping sales and prices in August 2006, economist Nouriel Roubini warned that the housing sector is in "free fall" and will derail the rest of the economy, causing a recession in 2007. Joseph Stiglitz, winner of the Nobel Prize in economics in 2001, agreed, saying that the U.S. may enter a recession as house prices decline.
b) Ignored Forecasts Concerning Construction Sector
Several home builders have revised their forecasts sharply downward during summer 2006, e.g., D.R. Horton cut its yearly earnings forecast by one-third in July 2006, the value of luxury home builder Toll Brothers' stock fell 50% between August 2005 and August 2006, and the Dow Jones U.S. Home Construction Index was down over 40% as of mid-August 2006.
c) Misleading Speeches done by Government Authorities
Even government respected authorities were making speeches on the favor of the ongoing housing bubble. They were showing as if the world was risk free. By these speeches they were encouraging people to take even the riskiest type of mortgages more and more everyday.
In 2004, when families had a historic chance to lock in long-term fixed-rate mortgages at only 5.5%, Greenspan said that they were loosing tens of thousands of dollars by not grabbing 1 year ARM’s (Adjustable rate mortgages), then at teaser rates of only 3.25%. In
any scrapbook of bad advice from economic gurus, that should be near the top of the list. Greenspan’s fellow Federal Reserve governor, the late Edward Gramlich, also reported that Greenspan had no interest in looking into growing signs of predatory behavior in the sub-prime industry. (Morris, 2008, p.69)
d) Ignored Worries About Hedge Funds Growth
Among quants, some recognized the gathering storm. Mr.Lo, the director of M.I.T. Laboratory for Financial Engineering, co-wrote a paper that he presented in October 2004 at a National Bureau of Economic Research conference. The research paper warned of the rising systemic risk to financial markets and particularly focused on the potential liquidity, leverage and counterparty risk from hedge funds. Over the two years, Mr.Lo made presentations to Federal Reserve officials in New York and Washington, and before the European Central Bank in Brussels. Among economists and academics, he said, the research was well received but on the industry side it was dismissed.
e) Ignored Concerns About Special Purpose Vehicles
In 1999, The New York Times reported that with the corporation's move towards the sub-prime market "Fannie Mae is taking on significantly more risk, which may not pose any difficulties during flush economic times. But the government-subsidized corporation may run into trouble in an economic downturn, prompting a government rescue similar to that of the savings and loan industry in the 1980s." Alex Berenson of The New York Times reported in 2003 that Fannie Mae's risk is much larger than is commonly held. Nassim Taleb wrote in The Black Swan: "The government-sponsored institution Fannie Mae, when I look at its risks, seems to be sitting on a barrel of dynamite, vulnerable to the slightest hiccup. But not to worry: their large staff of scientists deems these events "unlikely".
In 2003, the Bush administration recommended significant regulatory overhaul of Fannie Mae and Freddie Mac. However, both Republicans and Democrats opposed that proposal, fearing that tighter regulation could sharply reduce financing for low-income housing, both low and high risk. Under immense lobbying pressure from Fannie Mae, Congress did not introduce any legislation aimed at bringing this proposal into law until 2005.
In 2006, the Federal Housing Enterprise Regulatory Reform Act of 2005, first put forward by Sen. Charles Hagel where he pointed out that Fannie Mae's regulator reported that profits were "illusions deliberately and systematically created by the company's senior management". However, this legislation too met with opposition from both Democrats and Republicans. This bill was passed by the House, but was never presented to the Senate for a vote.
3.
MARKET AND MARKET PLAYERS
‘’Alan Greenspan said that this crisis is "a once-in-a-century credit tsunami".
With structured finance, derivatives markets, new products were to be developed everyday after 1980s and 1990s. New tools for finance were on stage. Growth was enormous. In year 2000 derivatives market volume was only 20 trillion usd. In year 2007 it has reached 120 trillion usd where the global world economy is just 56 trillion usd.
New actors were also on stage hedge funds which have no binding regulation acting freely for which everybody calls it ‘’carry trade’’. They were like mushrooms growing so quickly from 400 billion usd in 2000 to 1.4 trillion usd in 2006 and to 2 trillion usd in 2007.
Aggregate global CDO issuance totaled US$ 157 billion in 2004, US$ 272 billion in 2005, US$ 549 billion in 2006 and US$ 503 billion in 2007. Research firm Celent estimated the size of the CDO global market to close to $2 trillion by the end of 2006.
Banks were also using some kind of insurance called CDS (credit default swaps). They were initially created to insure blue-chip bond investors against the risk of default. In recent years, these swap contracts have been used to insure all manner of instruments, including pools of sub-prime mortgages. These swap contracts are between two investors: typically banks, hedge funds and other institutions. The face value of the cds market has soared to an estimated 55 trillion usd.
All these derivatives were not traded in exchanges and mostly were done in otc markets which have caused lack of transparency of the trades volume and counterparty risk.
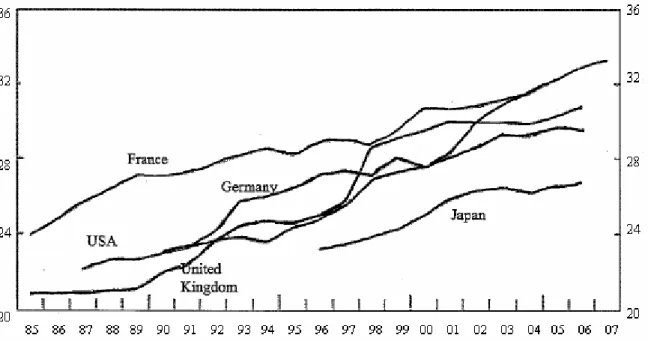
With all these creations financial sector was growing taking more share of the country’s GDP’S. The figure 3-1 represents the increases of the share of the financial sector in GDP (in percent) since 1985.
Figure 3-1 Share of the Financial Sector* in GDP (in percent)
*Financial sector comprises financial intermediation, real estate, renting and business activities.
3.1 Banking Sector
The biggest share in figure 3-1 was belonging to the Banking sector. With the help of these new tools: derivatives, securitization and cds markets, their asset sizes went on increasing. This increase can also be tracked in the latest IMF report.
Table 3-1 Summary of Global Capital Markets (billion usd)
GDP Currency Reserve Assets of Bank Bill,bond,etc.
World 55.545 6.448 84.785 144.927
E.U 15.689 280 43.146 42.952
U.S.A 13.808 60 11.194 42.952
Japan 4.382 953 7.839 49.802
Emerging Countries 17.282 4.910 15.003 28.771
When we look at the World’s total asset sizes of banks, calculated as 84.8 trillion usd, have far exceeded the World’s Gdp which is only 55.6 trillion usd. In Euro zone the estimated asset size of Banks are almost triple of their total Gdp’s, being the most critical and naïve part of the overall banking industry. In Japan it is almost double whereas in US and in
emerging market economies the sizes are about 81-87% of their Gdp’s which are also high and a threaten to overall economies.
Today when we look at these figures we can understand the bubbles more easily.
In fact all new inventions in structured finance were due to necessities and had reasons to be created. New inventions followed one another.
In the case of increased volume of mortgages, financial institutions started to issue mortgage-backed securities to finance their activities. These mortgage-backed securities helped banks to:
1. transform relatively illiquid, individual financial assets into liquid and tradable capital market instruments.
2. allow mortgage originators to replenish their funds, which can then be used for additional origination activities.
3. can be used by Wall Street banks to monetize the credit spread between the origination of an underlying mortgage (private market transaction) and the yield demanded by bond investors through bond issuance (typically, a public market transaction).
4. are frequently a more efficient and lower cost source of financing in comparison with other bank and capital markets financing alternatives.
5. allow issuers to diversify their financing sources, by offering alternatives to more traditional forms of debt and equity financing.
allow issuers to remove assets from their balance sheet, which can help to improve various financial ratios, utilize capital more efficiently and achieve compliance with risk-based capital standards.
So financial firms have seen the advantage of these MBS and made sales through special purpose vehicles. The risk was now transferred to these MBS and in case of defaults losses would be absorbed by sub-prime mortgages which have made a false buffer for the senior tranches.
In order to give more loans to customers investment banks either securitized or sold their existing mortgage loans which gave way to get more funds. So they went on disbursing these loans.
Some banks were keeping some of these assets in their balance sheet. According to April 2008 IMF report, Banks are estimated to have 740 billion of net subprime exposure, US banks (53%), European (41%), Asian (5%) and Canadian (1%) . In such cases they were buying some kind of insurance like credit default swaps which they were transferring some of the risks to counterparty.
In fact it is is widely accepted that banks can be a major source of systemic risk. (Jakas, 2008) Paradoxically they are also the front-line protection against system failures. This is because of the different functions banks perform in the financial system. Banks participate in the creation of money by way of deposit liabilities. They manage or take part in the payments system by providing a sound and stable mechanism to allow payments. Through the creation of indirect financial securities they are pivotal financial intermediaries between lenders and borrowers. Banks may also be regarded as agents of information who contribute to the supply of information. Economic actors may choose to limit the availability of public information, but are nonetheless willing to share it with a bank in order to obtain the requisite finance. Finally banks are maturity transformers, which mean that they take liquid deposits and invest part of the proceeds in the form of illiquid assets. By doing so, banks pool risk and enhance economic welfare.
When we talk about banking sector, we also have to pay attention to recent regulatory changes concerning banking side, especially to Basel II which has become a common standard to be followed by most banks in the World.
a) Basel II regulation
Basel II is an accord providing a comprehensive revision of the Basel capital adequacy standards issued by the Basel Committee on Banking Supervision.
Basel I, 1988 agreement, sought to decrease the potential for bankruptcy among major international banks. After Basel I, regulators came together to form a new measure more
sensitive to risks Banks are exposed to. This new regulation came after years of research with best practices adopted from member Banks. Basel II guidelines are to regulate capital using the default models to predict and manage risk. In other words this new regulation was giving banks a play ground where they will be using their own internal estimates if validated by their regulatory bodies. This new regulation, in order to differentiate risks, were dividing Bank’s risks into 3 categories: Credit, Market and Operational risks, which does not count for cross correlation affects between these risks and building silos between them.
Basel II regulation imposes sequentially higher-risk weights on capital once the securitiza-tion is rated below investment grade or unrated. For originating banks holding equity tranche exposure, these low-rated or unrated assets may become very costly in terms of capital charges, particularly if they remain unhedged. For example, under the internal-ratings-based approach for long-term debt, a bank holding an instrument rated BB faces risk weights of 425 percent. Yet, for the riskiest assets, the risk weight reaches 1,250 percent. Further, Basel II rules require that banks must prove that “significant credit risk” has been transferred to a third party in order to achieve capital relief through securitization. It is unlikely that the originating bank’s on-balance-sheet holdings of the riskier equity tranche investments will meet these criteria.
Likewise, as investors, banks under Basel II must hold capital against securitized instruments on their balance sheet. With charges of 650 percent for exposures rated BB–, the cost of holding below-investment-grade paper can be so expensive. Investment-worthy assets and the associated reduced risk weights for investment-grade assets provide banks with a less costly alternative in terms of capital, thereby increasing the incentive to move away from low-grade instruments.
Most banks issuing in these markets would likely use the internal-ratings-based approach but in order to lower risk weighted assets, were selling the riskier trances while keeping the high rated instruments.
After Basel II started to be applied, banks have started to use internal and external ratings in the calculation of their risk weighted assets. This gave way to an increase in their leverage ratios.
1) Investment Banks
In the following table I am giving you the leverage ratios of 5 investment banks by dividing debt over equity. Each of the five largest investment banks took on greater risk leading up to the sub-prime crisis. Taking these illiquid and toxic assets into their balance sheet even though some were with AAA rating their leverage had increased dramatically. The datas show us that these firms have significantly increased their leverage ratios where a high leverage ratio indicates more risk. For a typical risk averse firm this ratio is generally between 10 -15. Here we see that these firms had ratios closer to 30.
Table 3-2 Investment Bank Leverage Ratios
Year Assets Debt Equity Leverage
Lehman Brothers 2003 312,061 298,887 13,174 22.7 2004 357,168 342,248 14,920 22.9 2005 410,063 393,269 16,794 23.4 2006 503,545 484,354 19,191 25.2 2007 691,063 668,573 22,490 29.7 Bear Stearns 2003 212,168 204,698 7,470 27.4 2004 255,950 246,959 8,991 27.5 2005 292,635 281,844 10,791 26.1 2006 350,433 338,304 12,129 27.9 2007 395,362 383,569 11,793 32.5 Merrill Lynch 2003 480,233 451,349 28,884 15.6 2004 628,098 596,728 31,370 19.0 2005 681,015 645,415 35,600 18.1 2006 841,299 802,261 39,038 20.6 2007 1,020,050 988,118 31,932 30.9 Goldman Sachs 2003 403,799 382,167 21,631 17.7 2004 531,379 506,300 25,079 20.2 2005 706,804 678,802 28,002 24.2 2006 838,201 802,415 35,786 22.4 2007 1,119,796 1,076,996 42,800 25.2 Morgan Stanley 2003 603,022 578,155 24,867 23.2 2004 747,578 719,372 28,206 25.5 2005 898,835 869,653 29,182 29.8 2006 1,121,192 1,085,828 35,364 30.7 2007 1,045,409 1,014,140 31,269 32.4
10 15 20 25 30 35 2003 2004 2005 2006 2007 Lehman Brothers Bear Stearns Merrill Lynch Goldman Sachs Morgan Stanley
Figure 3-2 Investment Bank Leverage Ratios Yearly Comparison
2) Banks in US and Europe
Table 3-3 Leverage Ratios of Banks in USA
Bank Assets Shareholders
Equity Ratio Bank of America $1,715B $146.8B 10,68 Citigroup $2,187B $113.6B 18,25 JP Morgan $1,562B $123.2B 11,68 Wells Fargo $ 575B $47.6B 11,08
We see that the three big US banks have balance sheets that represent 40% of US GDP.
Table 3-4 Banks in Europe
Bank Assets Shareholders Equity Ratio Deutsche Bank € 2,020B € 38.5 B 51,47 UBS Fr 2,272B Fr 42.5 B 52,46 Credit Suisse Fr 1,360B Fr 59.88B 21,71 Fortis € 871B € 34.28 B 24,41 Dexia € 604B € 16.4 B 35,83
BNP Paribas € 1,694B € 59.4 B 27,52 Barclays £ 1,227B £ 32.5 B 36,75 RBS £ 1,990B £ 91.48 B 20,75
Clearly leverage levels in Europe and the UK are markedly higher. More staggering is the size of the balance sheets. Deutsche Bank’s is almost as big as those of Bank of America and JP Morgan combined. In fact we were aware of the Euro zone asset size growth which was triple of their Gdp and now we also realized that banks were also lacking equity. So we can consider Euro zone maybe more riskier than the entire world, together with US.
In the well-worn language of financial economics, increasing leverage was a positive NPV decision when it was made, but obviously ex post it was a costly decision as it meant that when assets fell in value, the fund’s equity fell in value faster than it would have with less leverage.
3.2 Rating Agencies
There is a very big issue concerning these agencies because most investors and financial institutions gave too much importance to their calculated PD’s. They were using it for their investment decisions, to price their holdings, to make risk adjusted return calculations and even in determination of their capital levels. Everybody’s reliance on Rating Agencies was so important that even Basel II Directives were based on these estimates. With good ratings you needed to hold less capital and more with the bad ones.
Also on the industry side everybody trusted the rating agencies. The reputation of outside bond ratings was so high that if the risk department had ever assigned a lower rating, their judgment would have been immediately questioned. It was assumed that the rating agencies simply knew best.
These agencies were giving investment-grade ratings to securitization transactions (CDO’s and MBS’s) based on sub-prime mortgage loans. So everybody was confident in entering bigger and bigger positions in sub-prime mortgages.
So with these incentives the world seemed almost riskless. These high ratings encouraged the flow of investor funds into these securities, helping finance the housing boom. The reliance on ratings by these agencies and the intertwined nature of how ratings justified led many investors to treat securitized products — some based on sub-prime mortgages — as equivalent to higher quality securities and furthered by SEC removal of regulatory barriers and reduced disclosure requirements in the wake of the Enron scandal.
Credit rating agencies are now under scrutiny for giving investment-grade ratings to securitization transactions (CDO’s and MBS’s) based on sub-prime mortgage loans. Higher ratings were believed justified by various credit enhancements including over-collateralization (pledging collateral in excess of debt issued), credit default insurance, and equity investors willing to bear the first losses.
Downgrade of Assets
As seen from the figure 2-1 on page 3, after 2004 the government started to increase interest rates which made a peak in June 2006 and after that falling ever since which is at zero levels now. During these interest rate changes the mortgage owners have started to default while home prices were coming down with increased ted spreads. At this time rating agencies were not aware of the coming storm and banks were still comfortable sitting on these MBS and other mortgages in their portfolio. The ratings were not good estimates of the risks which the investors were exposed to.
They were almost seemed to be designed to be used in boom and bubble times but would fail to perform during crisis.
Starting from the 3rd quarter of 2007 rating agencies have started to lower MBS. Rating agencies lowered the credit ratings on $1.9 trillion in mortgage backed securities from Q3 2007 to Q2 2008. (Figure 3.3) This places additional pressure on financial institutions to lower the value of their MBS. In turn, this may require these institutions to acquire additional capital, to maintain capital ratios. If this involves the sale of new shares of stock, the value of existing shares is reduced. In other words, ratings downgrades pressure MBS and stock prices lower.
85 841 739 237 0 100 200 300 400 500 600 700 800 900 Q3-2007 Q4-2007 Q1-2008 Q2-2008
Figure 3-3 Mortgage-Backed Securities (MBS) Downgrades (Billions $)
As of July 2008, Standard & Poor's (S&P) had downgraded 902 tranches of U.S. residential mortgage backed securities (RMBS) and CDO’s of asset-backed securities (ABS) that had been originally rated "triple-A" out of a total of 4,083 tranches originally rated "triple-A;" 466 of those downgrades of "triple-A" securities were to speculative grade ratings. S&P had downgraded a total of 16,381 tranches of U.S. RMBS and CDO’s of ABS from all ratings categories out of 31,935 tranches originally rated, over half of all RMBS and CDO’s of ABS originally rated by S&P.Since certain types of institutional investors are allowed to only carry investment-grade (e.g., "BBB" and better) assets, there is an increased risk of forced asset sales, which could cause further devaluation.
3.3 Monoline insurance
Monoline insurers guarantee the timely repayment of bond principal and interest when an issuer defaults. They are so named because they provide services to only one industry.
The economic value of bond insurance to the governmental unit, agency, or company offering bonds is a saving in interest costs reflecting the difference in yield on an insured bond from that on the same bond if uninsured. Insured securities range from municipal bonds and structured finance bonds to collateralized debt obligations (CDO’s) domestically and abroad.
Until 1989, multiline insurance companies were permitted to guarantee municipal and other bonds, in addition to their other businesses such as property/casualty and life insurance.
Under New York State's Article 69, passed in 1989, multiline insurance companies are not permitted to engage in financial guaranty businesses (and vice versa). A cited rationale was to make the industry easier to regulate and ensure capital adequacy.
After 1989, insurance regulations prevent property/casualty insurance companies, life insurance companies, and multiline insurance companies from offering financial guaranty insurance. The monoline industry claims that it has the advantage over multilines of sole focus on capital markets.
As the number and size of insured bond issues grew, regulatory concern arose that bond defaults could adversely affect even a large multiline insurer's claims-paying ability. In 1975, New York City teetered on the edge of default during a steep recession after years of financial mismanagement; in 1983 the Washington Public Power Supply System (WPPSS) defaulted on $2billion of revenue bonds from a troubled nuclear power project.
a) Ambac
The first monoline, or bond insurer Ambac Financial Group Inc, was formed in 1971 as an insurer of US municipal bonds.
The Ambac Financial Group, Inc., generally known as Ambac, is an American holding company whose subsidiaries provide financial guarantee products, such as bond insurance and other financial services to clients in both the public and private sectors around the world. Ambac is regulated by the insurance commission of Wisconsin. Through its financial services subsidiaries, the company provides investment agreements, interest rate swaps, investment advisory and cash management services, primarily to states, municipalities and their authorities.
A consortium of four insurance companies formed the Municipal Bond Insurance Association (MBIA Inc) a financial services company in 1973 to diversify their holdings in municipal bonds. The company went public in 1987. The companies sought to help regional public administrators get better access to cheaper funding. MBIA is the largest bond insurer.
c) Credit rating downgrades of Monoline Insurers
Maintaining a high credit rating is critical for bond insurance firms. Companies and governments buy insurance to reduce their borrowing costs by assuming the higher rating of the insurer. Keeping up this rating is thus the basis of the insurer's business model.
However due to sub-prime mortgage crisis, this advantage has been lost because of the credit rating downgrades of these insurers. No monoline insurer had ever been downgraded or defaulted prior to 2007.
In 2007, during a housing market decline, monoline insurers suffered losses from insurance of structured products backed by residential mortgages. Defaults soared to records on sub-prime mortgages and innovative adjustable rate mortgages, such as interest-only, option-ARM, stated-income, and NINJA loans (No Income, No Asset) which had been issued in anticipation of continued rises in house prices.
Ambac and other bond guarantors, such as MBIA, were hit hard by the 2007 sub-prime mortgage financial crisis, and, on January 18, 2008, its Fitch credit rating was lowered from AAA (the highest) to AA when its plans to raise two billion dollars in new capital failed. Due to the very nature of monoline insurance the downgrade of a major monoline triggered a simultaneous downgrade of bonds from over 100,000 municipalities and institutions totaling more than $500 billion.
Moody's and S&P, however, chose to affirm Ambac's AAA with their agencies after it succeeded in raising $1.5 billion in new capital in March 2008. In early 2008, major bond guarantors failing to be able to pay off insurance claims on a trillion dollars of securities back by sub-prime mortgages and other securitized debt led to attempts to shore them up
with infusions of capital. On June 19, 2008 Moody's downgraded Ambac's credit rating three notches to Aa3.
On April 4, 2008 Fitch Ratings cut MBIA's Insurance Corp rating to AA from AAA with a negative outlook. Fitch issued the new, lower rating even though MBIA had asked the ratings company, the month before, to stop assessing its credit worthiness.
On June 4, 2008 Moody's Investors Service announced that it would review MBIA's rating for possible downgrade for the second time in the year. Four months before this announcement, on February 2008, Moody's had affirmed the AAA rating after MBIA raised $2.6 billion in capital and announced that would stop insuring structured finance securities for six months.
On June 6, 2008, despite having affirmed MBIA's AAA rating on February 2008, Standard and Poor's decided to downgrade MBIA's insurance financial strength rating from AAA to AA.
On June 19, 2008 Moody's downgraded MBIA's credit rating 5 notches to A2.
On November 7, 2008 Moody's further downgraded to "Baa1" from "A2" the insurance financial strength rating.
Rating agencies have come under increasing scrutiny by regulators for their methods as bond insurers lend their high credit ratings to securities issued by others in return for a fee. By January 2008, many municipal and institutional bonds were trading at prices as if they were uninsured, effectively discounting monoline insurance completely. The slow reaction of the ratings agencies in formalizing this situation echoed their slow downgrading of sub-prime mortgage debt a year earlier.
Commentators such as investor David Einhorn have criticized rating agencies for being slow to act, and even giving monoline’s undeserved ratings that allowed them to be paid to bless bonds with these ratings, even when the bonds were issued by credits superior to their own.
Government interest rate policies led to cheap and plenty borrowing opportunities which motivated hedge fund industry which is the leader of the most speculative group of investors. The underlying reason in the accelerated growth of hedge funds in 1990’s was due to their passive investment strategies in which one could earn high profits even when the markets go down despite the investment funds that could only make profit when the markets are booming. The reason of their name being hedge was that they could make profit without being affected from market risk and markets rising and falling. They were accepting investors who have more than 1 million usd. Hedge fund owners were also taking mutual risk with investors by adding their own holdings to the funds. Taking huge amount of loans from banks and making investments greater than their funds size was maybe their most important feature. They could act very fast and react so quickly to instant changes in the expectations which were causing big turbulences in the markets. Failure of LTCM which was one of the most famous hedge funds in history was the main reason of the global crisis of 1998.
After 2001 developed countries starting to lower interest rates and therefore decreasing financial returns, investors could not get satisfied with the classical investment strategies. They turned their face to hedge funds which were professionally managed and offering high returns in such an environment. So this way hedge funds grew in numbers. Fund managers whom were working in big investment banks previously started to quit one by one and started to found hedge funds. In year 2000 their numbers were 4 thousand with almost 400 billion usd volume. In year 2006 they became close to 14 thousand in numbers with 1.4 trillion usd volume. Some investment banks started to found their own hedge funds within their organizations either to get a piece of the cake or not to loose their genius managers.
400 700 1,407 150 4 9 14 1 0 2 4 6 8 10 12 14 16 1994 2000 2003 2006 0 200 400 600 800 1,000 1,200 1,400 1,600
Amount Number(left axis)
Figure 3-4 Hedge Funds Development
By not being audited or actions being not restricted with certain rules they could take every kind and risky investment all around the world. In fact they could only make profits by taking some portion of the additional returns they could make in excess of the reference returns like USA stock exchange. So they had to enter markets and instruments which many investors were avoiding to enter and had to take more risks. After they gained more and cheaper opportunities for borrowing they quickly headed towards the emerging countries which were promising higher interest rates and increasing stock market potential.
Table 3-5 Capital Inflow to Emerging Market Economies
(Billion USD) 2000 2003 2005 2006 2007
Total capital inflow 300 415 760 1.185 1.929
Foreign Direct Investment Capital Inflow 212 204 374 464 533 Portfolio investment 95 85 201 337 442 Other investment -7 127 185 384 955
As can be seen from the table, total capital inflow to emerging markets have increased enormously from 300 billion usd in 2000 to 1.929 billion usd in 2007. The biggest
increases were due to other and portfolio type of investments, leaving foreign direct investment increase amount negligible.
After they invested in the currencies, Eurobonds, bonds and stocks of these countries in big amounts, their currencies appreciated very quickly and also did their stocks and bond prices. So margins started to get lower and lower everyday.
EMBIG spread which shows the difference of US and emerging markets bonds interest rates differences of the same maturities, declined to the lowest levels in its history.
1% 3% 5% 7% 9% 11% 11.03.02 11.03.03 11.03.04 11.03.05 11.03.06 11.03.07 11.03.08
Figure 3-5 EMBI+ Index
Maybe the macroeconomic structural positive changes in emerging countries which were made at the same time interval may have made demands towards financial markets and instruments also seem reasonable. The increase in global liquidity with cheap and plenty of borrowing opportunities were obviously supporting the demands towards these markets. The demand was covering almost all the emerging countries without any consideration.
One of the most popular funds was quant fund which was trying to earn money through automated buying and selling that were fully dependant on mathematical models. These funds were acquiring the analysts who have a high level of mathematical and statistical
instruments from the value they had to be with the most complicated models and were taking positions accordingly. First they were trying to detect the risk factor which affects the underlying instrument and find out how these factors have affected them by using historical data and buy/sell automatically with the buy and sell warnings produced by models. In a way human factor was left out. When arbitrage opportunities appear they were being closed automatically. After the number of quant funds grew in number, the same type of models lowered arbitrage opportunities. Cheap and plenty of financial opportunities were still giving way to high leverage levels and they still went on making profits despite of narrowing margins.
Given the role that hedge funds have begun to play in financial markets—namely, significant providers of liquidity and credit—they now impose externalities on the economy that are no longer negligible. In this respect, hedge funds are becoming more like banks. The fact that the banking industry is so highly regulated is due to the enormous social externalities banks generate when they succeed, and when they fail. But unlike banks, hedge funds can decide to withdraw liquidity at a moment’s notice, and while this may be benign if it occurs rarely and randomly, a coordinated withdrawal of liquidity among an entire sector of hedge funds could have disastrous consequences for the viability of the financial system if it occurs at the wrong time and in the wrong sector. ( Khandani and Lo 2007)
While some academics may have warned that systemic risk in the hedge-fund industry has been on the rise (Carey and Stulz, 2007), none of the academic literature has produced any timely forecasts of when or how such shocks might occur. Indeed, by definition, a true “shock” is unforecastable.
A recent study was conducted (Clare & Motson 2008) to investigate the risk taking behaviour of hedge fund managers. They have found out that managers whose incentive option is well in the money decrease risk. Relatively speaking these managers are protecting the value of this option towards the end of the year. For investors who wish their managers to take risks in a consistent manner regardless of the month of the year, this result may come as a disappointment. It suggests that there is an element of “locking in” behaviour particularly towards the end of the calendar year. Perhaps of more interest is the
risk taking behaviour of those fund managers who find their incentive option to be well out of the money. We find that these managers do not “put it all on black” in order to “win” back earlier losses and to increase the value of their incentive option. This should be good news for hedge fund investors. This conservative behaviour may be due to the implicit terms of the manager’s contract. As Hodder and Jackwerth (2007) suggest, these implicit terms may include the risk of liquidation as investors withdraw funds and may also be due to the often substantial management stake in the fund that discourages the fund manager from “swinging the bat”.
3.5 On the Positive Side
a) Tax and Other benefits of Monoline Insurers
The companies, which must be highly rated by the credit rating agencies to fulfill their role, provide a back-up guarantee to debt issued by lower rated borrowers in exchange for insurance premiums. Thus a city or regional municipal borrower rated A, by paying a premium could enjoy AAA rating. Many more kinds of investors would then buy that bond significantly reducing the interest cost of that debt. Since public administrators often had large balance sheets of real estate assets, monolines soon started building up portfolios of bonds that had real estate assets backing them. The difficulty for analysts has always been understanding how similar are municipal assets often funded from secure tax revenues compared to private asset portfolios funded by profits from a variety of fluctuating markets. To counter criticism, bond insurers claimed they had sophisticated risk management maths and in the event of claims, paid slowly over time to match the profile of the debt issued rather than lump sums.
Taxable investors benefit from the exemption of municipal bond interest from Federal income tax. In many cases local bonds are also free of state and local taxes. Taxable investors face a compelling incentive to purchase local bonds. However, an investor holding a large portfolio allocation in local bonds carries a risk of substantial loss if the local economy becomes depressed, for instance if a local industry declines or a major natural disaster strikes, and defaults ensue. On the other hand, diversifying nationally