Commun.Fac.Sci.Univ.Ank.Series A2-A3 Volume 59, Number 2, Pages 11-19 (2017) DOI: 10.1501/commua1-2_0000000100 ISSN 1303-6009
http://communications.science.ankara.edu.tr/index.php?series=A2-A3
Received by the editors: October 27, 2017; Accepted: December 15, 2017
Key word and phrases: Ground Penetrating Radar (GPR), Sampling Value, GPR Data, Underground Structures, Incomplete Data, Interpolation Methods
© 2017 Ankara University Communications Faculty of Sciences University of Ankara Series A2-A3: Physical Sciences and Engineering Communications de la Faculté des Sciences de l'Université d'Ankara-Séries A2-A3: Physical Sciences and Engineering
INTERPOLATION METHODS FOR RECOVERING THE SAMPLING VALUES OF GPR DATA
MERVE ÖZKAN OKAY and REFIK SAMET
Abstract.Ground Penetrating Radar (GPR) is widely used to acquire the data from near surface depth. The acquired GPR data allow the users to investigate and examine the underground structures (anomalies) easily, quickly and accurately without any excavation. In GPR studies, data collection parameters such as the profile interval and step size, which can be controlled by users, play an important role in the identification of underground structures. But search area properties such as uneven surface, the presence of archaeological and other obstacles cannot be controlled by users. The obtained accuracy depends on the completeness and resolution of acquired GPR data. Due to some research area properties the data acquired from the search area may become incomplete and inadequate. Before analyzing, visualization and interpretation of the underground structures, the incomplete GPR data should be recovered. In this paper, nonstandard interpolation method are proposed for completing the missing data. The proposed methods were implemented on the real GPR data acquired from the test area. The obtained results showed that the similarity of the produced data as quite closer to the original data.
1. Introduction
Ground Penetrating Radar (GPR) is a widely used method to investigate the underground archaeological and geological structures [3], [17]. The use of GPR in researches and applications has recently been increasing, because it can explore and detect the underground structures quickly and accurately.
There are two main factors that affect the success of GPR research and applications. These are data collection parameters and search area properties. Data collection parameters such as antenna frequency, sampling and profile range, etc. are under the control of users, and the values of these parameters can be selected according to the search area properties. On the other hand, the search area properties such as uneven surface, the archaeological and other obstacles, technical failures during data collecting, etc. are outside the control of users. Any physical and chemical changes under the ground such as, metals, dissolved salts and the presence of conductive materials, etc. affect the properties of electromagnetic waves such as speed, amplitude
and wavelength [1], [4-5], [7]. Due to search area properties, the obtained data can be missing/inadequate, and therefore an accuracy of 2D/3D visualization of the underground structures decreases [6]. This study proposes nonstandard Mean interpolation method to produce incomplete data as close to original data. In addition to proposed interpolation method, standard Cubic, Cubic Spline, Linear, Median and Mean interpolation methods were tested on real GPR data. The obtained results proved that the proposed nonstandard Mean interpolation methods give the best results in comparison with the standard ones to produce the incomplete data. The study is organized as follows. Firstly, the proposed methodology is described to produce the incomplete data. Secondly, proposed nonstandard and known standard interpolation methods are implemented on real GPR data and obtained results are compared. Finally, obtained results from comparing are evaluated and the contributions of the study are summarized.
2. Proposed nonstandard mean interpolation methods
GPR data consist of 𝑁 parallel profiles. Each profile consists of 𝑀 traces. Each trace consists of 𝐾 sample values (Fig.2.1).
Figure 2.1 (a) Profiles of GPR data; (b) Traces of profile; (c) Sample values of trace
Due to the ruggedness and uneven surface of the search area, technical failures, etc. some sampling values may not be measured and collected. In order to recover these incomplete data with interpolation methods [12-13], the following steps are applied:
1. Obtaining data from the search area;
2. Producing new sampling value by using original sampling values; 3. Comparing the new sampling value with original sampling value; 4. Determining the appropriate interpolation method.
2.1 Obtaining the Data from the Search Area
It is necessary to use data sets obtained from the search area where the underground structure is well known for testing and verification of proposed technique. This type of data set is only possible with a created test area. The various sizes materials (such as, pipes and stone walls, metal and plastic drums) were placed in this test area and obtained data from there. In this way, the accuracy of the information about object can be determined precisely.
2.2 Producing the New Sampling Values
Trace consists of
K
sampling values. Some of these sampling values are randomly extracted. By applying different interpolation methods with the remaining sampling values, new values are produced instead of the extracted values. Interpolation methods used for producing sampling value are standard interpolation methods (Cubic, Spline, Linear, Median) and proposed interpolation method [9-11], [14-16].The production of new sampling values by using the original sampling values is applied for 𝑚𝑡ℎ trace
(m=1,2,…,M)
of each 𝑛𝑡ℎ profile(n=1,2,…,N)
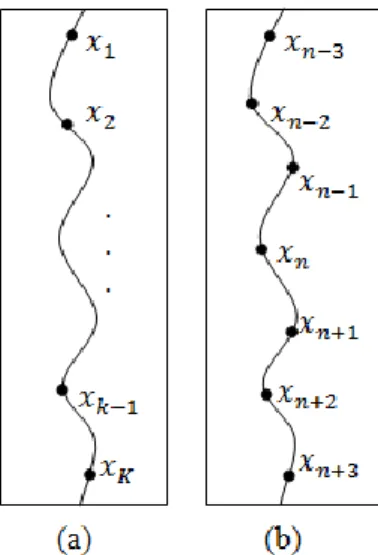
(Fig.2.2).Figure 2.2(a) The sampling values of mthtrace; (b) The sampling values used
in interpolation method
2.2.1 Proposed Mean Interpolation Method
Any sampling value 𝑥𝑘 (𝑘 = 1,2, … , 𝐾) of the 𝑚𝑡ℎ
(m=1,2,…,M)
trace is1 and ( 𝑘 + 𝑖) ≤ 𝐾) (Fig. 2.2). According to standard mean interpolation method, the average of used sampling values is calculated to produce new sampling value (Eq. #2.1). On the other hand, according to the proposed nonstandard Mean interpolation method, the variable 𝐸 of the increase or decrease amount (Eq. #2.2) and distance (Eq. #2.3) between the used values are taken into account during producing incomplete trace values.
𝑀𝑠𝑡𝑑 = ∑ 𝑥𝑘−𝑖 +⋯+ 𝑥𝑘+𝑖 𝑛 𝑛/2 𝑖=1 (2.1) 𝐸 =𝑥𝑘+1 − 𝑥𝑘−1 𝑥𝑘+1 (2.2)
When the incomplete sampling values are calculated using more than 2 neighbor sampling values, weight 𝑤 of neighbors should be taken into account.
𝑤 = 2( 𝑛𝑣 2 ⁄ −𝑖+1) 𝑛𝑣 2 ⁄ (𝑛𝑣 2 ⁄ +1) (2.3)
where 𝑛𝑣 is a number of used neighbor sampling values. According to Eq. #2.3 the
weight of the nearest neighbor sampling values is higher than others. So, using Eq. #2.2 and Eq. #2.3, 𝑥𝑘 can be calculated as follows.
𝑥𝑘 = ∑ 𝑤(𝑥𝑘−𝑖 (0.5 ± 𝐸) + 𝑥𝑘+𝑖 (0.5 ∓ 𝐸) 𝑛𝑣
2
𝑖=1 ) (2.4)
According to Eq. #2.4, 0.5 is the coefficient used to calculate the standard mean, that is, it is taken in the same percentage from sampling values. In addition, in the developed interpolation technique, if there is an increase between the values, the increase amount is added to 0.5 for using high neighbor value and the increase amount is subtracted from 0.5 for using low neighbor value.
2.3. Comparison and Determining Similarity Ratio
In the comparison step, the produced sampling values by using interpolation operations are compared with the original sampling values. The similarity ratio is taken into consideration while determining the ideal interpolation technique.
Comparison was done by the Pearson Correlation Coefficient (PCC) [2], [8] metric. The PCC is calculated using the following formula.
𝑃𝑋,𝑌= 𝑐𝑜𝑣(𝑋,𝑌)
where,
X
andY
are sampling values; 𝑐𝑜𝑣(𝑋, 𝑌) is the covariance of the two sampling values; 𝜎𝑋 and 𝜎𝑌 are the standard deviations of corresponding sampling values. Thevalue of PCC varies between -1 and 1. A value that is close to -1 or 1 means that the similarity between the two sampling values is strong.
2.4. Determining the Optimal Interpolation Technique
While determining the optimal interpolation technique, the results of interpolation techniques and original data are compared. According to comparing results, the technique giving the closest similarity ratio as close to the original is determined as an optimal interpolation technique. In addition to similarity ratios, the number of used neighbor values is taken into account. As a result, the optimal technique is determined by looking at similarity ratios and the number of used neighbor value.
3. Implementation
For the implementation of the proposed nonstandard Mean and standard Cubic, Cubic Spline, Linear, Median and Mean interpolation methods [9-11], [14-16], the profiles (Fig.3.1 (b)) acquired from embedded wall structure (Fig.3.1 (a)) in the test area were used.
(a) (b) Figure 3.1(a) The wall structure and (b) Sample profile
20 parallel profiles of the wall structure were acquired from the test area. The profile length was about 5 m. The distance between the profiles was taken as 0.25 m. The direction of the recorded profiles are shown in Fig.3(a), and the
n
th(n = 1,2, ..., 20)
profile image of the implementation data set is shown in Fig.3(b). Each of
M=188
traces consists of
K=512
sampling values. 7 sampling values were selected from them
th (𝑚 = 1,2, … ,188) trace at random intervals (e.g. [122-128], [172-178], etc.). First,sampling value instead of removed one was calculated using interpolation methods on the base of neighbor sampling values, and finally the sampling values of original and new sampling value were compared.
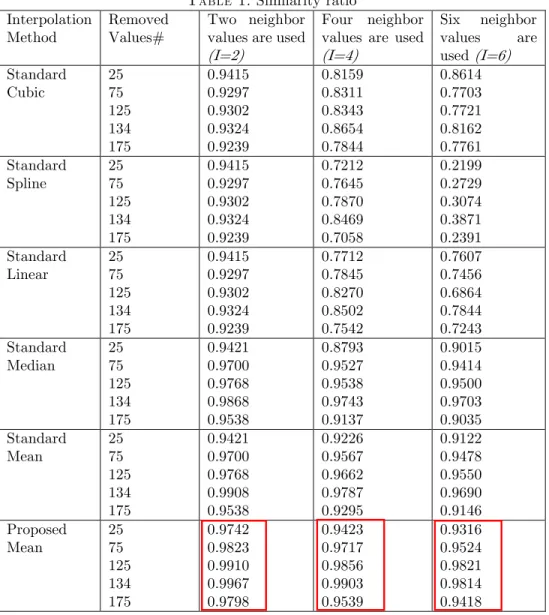
In order to decide for the appropriate interpolation method, the similarity ratio between the new sampling value and the original sampling value was used. The obtained results are given in Table 1.
Table 1.Similarity ratio Interpolation
Method
Removed Values#
Two neighbor values are used
(I=2)
Four neighbor values are used
(I=4)
Six neighbor values are used(I=6)
Standard Cubic 25 75 125 134 175 0.9415 0.9297 0.9302 0.9324 0.9239 0.8159 0.8311 0.8343 0.8654 0.7844 0.8614 0.7703 0.7721 0.8162 0.7761 Standard Spline 25 75 125 134 175 0.9415 0.9297 0.9302 0.9324 0.9239 0.7212 0.7645 0.7870 0.8469 0.7058 0.2199 0.2729 0.3074 0.3871 0.2391 Standard Linear 25 75 125 134 175 0.9415 0.9297 0.9302 0.9324 0.9239 0.7712 0.7845 0.8270 0.8502 0.7542 0.7607 0.7456 0.6864 0.7844 0.7243 Standard Median 25 75 125 134 175 0.9421 0.9700 0.9768 0.9868 0.9538 0.8793 0.9527 0.9538 0.9743 0.9137 0.9015 0.9414 0.9500 0.9703 0.9035 Standard Mean 25 75 125 134 175 0.9421 0.9700 0.9768 0.9908 0.9538 0.9226 0.9567 0.9662 0.9787 0.9295 0.9122 0.9478 0.9550 0.9690 0.9146 Proposed Mean 25 75 125 134 175 0.9742 0.9823 0.9910 0.9967 0.9798 0.9423 0.9717 0.9856 0.9903 0.9539 0.9316 0.9524 0.9821 0.9814 0.9418Each trace of the wall structure consists of
K=512
sampling values. The 25th, 75th,125th, 134th and 175th sampling values were assumed as incomplete ones and removed
from traces. Instead of removed sampling values, the new sampling values were produced by interpolation methods using two, four and six neighbor sampling values of the complete sampling values. The similarity ratios of the new sampling values with the original sampling values are given in Table 1. Based on these results, according to PCC ratio the highest similarity is obtained by the mean interpolation method using two neighbors. Looking at the other results (four and six neighbor values), the further away from the neighbors of the values to be produced, the similarity ratio more likely falls. Therefore, choosing the two nearest neighbors gives the highest similarity ratio.
4. Results
There are two main factors that affect success of GPR research and applications. These are data collections parameters and search area properties. Data collection parameters which are under the control of users and it can arrange optionally. Search area properties which are outside the control of users are important factors for analyzing, processing, visualization and interpretation of underground structures. Factors which are not in the user's control such as failures occurred during data acquisition stage, obstacles on and under the surface, etc. may lead to incomplete sampling values or missing sampling values in that region. In this context, various interpolation methods have been applied to the data acquired from the concrete test area to investigate the accuracy and the completeness of produced missing data. The results and findings are listed below.
When determining the optimal interpolation method, the produced sampling value is compared with the original sampling value extracted from the data. In determining step, the technique produced closest result to original is taken into account. While the standard and proposed interpolation methods are applied, interpolation is applied with different number of neighbor values (two, four, six). Interpolation technique by using the two closest neighbor values gives higher similarity ratio than other techniques. Similarity ratios of proposed method with two neighbor values are approximately 93-99%. On the other hand, in interpolation with more value, although samples are taken from most of the collected data, the similarity ratio reduces. Because the data values can change, as the distance between the data increases. In summary, when new data is produced instead of missing or uncollected data in archaeological research and applications, proposed mean interpolation technique with the two nearest neighbor values gives the highest similarity ratio. In future works, the Kriging, IDW and other interpolation techniques will be investigated to produce the incomplete GPR data.
Acknowledgement. This work has been funded by The Scientific and Technological Research Council of Turkey - TÜBİTAK under grant 5130012 project and 2211-E research fellowship program.
References
[1] Annan, A.P. 2009. Electromagnetic Principles of Ground Penetrating Radar. In Ground Penetrating Radar: Theory and Applications, edited by Harry M. Jol, pp. 3-40. Elsevier, Amsterdam.
[2] Benesty, J., Chen, J., Huang, Y. and Cohen, I. 2009. Pearson correlation coefficient. Noise reduction in speech processing. Springer Berlin Heidelberg, 1-4.
[3] Bristow, C.S. and Jol H.M. 2003. GPR in sediments: advice on data collection, basic processing and interpretation, a good practice guide. Geological Society: London, Special Publication 211; 9-28.
[4] Cassidy, N.J. 2009b. Electrical and Magnetic Properties of Rocks, Soils and Fluids. In: Ground Penetrating Radar: Theory and Applications, edited by Harry M. Jol, pp. 41-72. Elsevier, Amsterdam.
[5] Conyers, L.B. 2004. Ground-Penetrating Radar for Archaeology. AltaMira Press, Lanham. Dojack, L. 2012. Ground Penetrating Radar Theory, Data Collection, Processing, and Interpretation: A Guide for Archaeologists, 7-9. [6] Dojack, L. 2012. Ground Penetrating Radar Theory, Data Collection,
Processing, and Interpretation: A Guide for Archaeologists, 7-9.
[7] Leckebusch, J. 2003. Ground-penetrating Radar: A Modern Three-dimensional Prospection Method. Archaeological Prospection. Vol 10; 213-240.
[8] Levinson, N. 1947. The Wiener RMS (root mean square) error criterion in filter design and prediction.
[9] Maeland, E. 1988. On the comparison of interpolation methods. Medical Imaging. IEEE Transactions 7(3), 213-217.
[10] McKinley, S. and Megan, L. 1998. Cubic spline interpolation. College of the Redwoods 45(1), 1049-1060.
[11] Meijering, E. and Michael, U. 2003. A note on cubic convolution interpolation. IEEE Transactions on Image Processing 12, 477-479.
[12] Ozkan, M. and Samet, R. 2017. Interpolation Techniques to Recover the Incomplete GPR Data. In: The 16th International Conference Geoinformatics, Kiev, Ukraine.
[13] Safont, G., Salazar, A., Rodriguez, A., Vergara, L., 2014. On Recovering Missing Ground Penetrating Radar Traces by Statistical Interpolation Methods. Remote Sensing 6, 7546-7565.
[14] Samet, R., Çelik, E., Şengönül, E., Tural, S. and Özkan, M. 2015. Interpolation approach to search hidden result in GPR data. In: The 5th International Conference on Control and Optimization with Industrial Applications, Baku, Azerbaijan. 422 –425.
[15] Samet, R. and Özkan, M. 2016. Incomplete Data Production Methods in GPR Research and Applications. In: The 15th International Conference Geoinformatics, Kiev, Ukraine.
[16] Samet, R., Çelik, E., Tural, S., Şengönül, E., Özkan, M., Damcı, E. 2017. Using interpolation techniques to determine the optimal profile interval in ground-penetrating radar applications, Journal of Applied Geophysics (140), pp. 154-167.
[17] Zhao, W., Tian, G., Forte, E., Pipan, M., Wang, Y., Li, X., Shi, Z., Liu, H., 2015. Advances in GPR data acquisition and analysis for archeology. Geophysical Journal International 202, 62-71.
Current Address:
Merve ÖZKAN: Ankara University, 50.Yıl Campus, Computer Engineering Department, Ankara TURKEYE-mail Address:
[email protected]
ORCID:https://orcid.org/
0000-0002-1071-2541
Current Address:
Refik SAMET: Ankara University, 50.Yıl Campus, Computer Engineering Department, Ankara TURKEYE-mail Address: