R E S E A R C H A R T I C L E
Open Access
An international survey on hypoglycemia
among insulin-treated type I and type II
diabetes patients: Turkey cohort of the
non-interventional IO HAT study
R
ıfat Emral
1*, Tamer Tetiker
2, Ibrahim Sahin
3, Ramazan Sari
4, Ahmet Kaya
5,
İlhan Yetkin
6, Sefika Uslu Cil
7,
Neslihan Ba
şcıl Tütüncü
8and on behalf of the IO HAT investigator group
Abstract
Background: Limited real-world data are currently available on hypoglycemia in diabetes patients. The International Operations Hypoglycemia Assessment Tool (IO HAT) study was designed to estimate hypoglycemia in insulin-treated type I (T1DM) and type II (T2DM) diabetes mellitus patients from 9 countries. The data from Turkey cohort are presented here. Methods: A non-interventional study to determine the hypoglycemia incidence, retrospectively and prospectively, in Turkish T1DM and T2DM patients using a 2-part self-assessment questionnaire.
Results: Overall, 2348 patients were enrolled in the Turkey cohort (T1DM = 306 patients, T2DM = 2042 patients). In T1DM patients, 96.8% patients reported hypoglycemic events (Incidence rate [IR]: 68.6 events per patient-year [ppy]), prospectively, while 74.0% patients reported hypoglycemic events (IR: 51.7 events ppy), retrospectively. In T2DM patients, 95.9% patients (IR: 28.3 events ppy) reported hypoglycemic events, prospectively, while 53.6% patients (IR: 23.0 events ppy) reported hypoglycemic events, retrospectively. Nearly all patients reported hypoglycemia during the prospective period.
Conclusions: This is a first patient-reported dataset on hypoglycemia in Turkish, insulin-treated diabetes patients. A high incidence of patient-reported hypoglycemia confirms that hypoglycemia remains under-estimated. Hypoglycemia increased healthcare utilization impacting patients’ quality of life. Hypoglycemia remains a common side effect with insulin-treatment and strategies to optimize therapy and reduce hypoglycemia occurrence in diabetes patients are required.
Trial registration: Clinicaltrials.gov,NCT02306681(Date of registration: 12 Nov 2014; retrospectively registered). Keywords: Diabetes, Turkey, Hypoglycemia, IO HAT, Insulin, Non-interventional
Background
Insulin therapy remains integral to treatment of type I diabetes mellitus (T1DM) and long-term type II diabetes mellitus (T2DM) [1]. A good glycemic control is essen-tial to minimize development of microvascular compli-cations and macrovascular events [2]. Hypoglycemia is the main hurdle for achieving optimal glycemic control
in patients on insulin therapy [3]. Development of strat-egies or therapies to control hypoglycemia is important to help individuals achieve glycemic targets [4]. Achiev-ing optimum glycemic control followAchiev-ing the diagnosis of T2DM is vital to improving clinical outcomes, yet many patients and clinicians are hesitant to initiate and inten-sify insulin therapy. Reasons for this are manifold including lack of time, clinical expertise and patient un-derstanding. However, considerable progress can be achieved with patient education and awareness programs soon after diagnosis [5].
* Correspondence:[email protected]
1Department of Endocrinology and Metabolic Diseases, Ankara University,
Faculty of Medicine,İbn-i Sina Hospital, Academic Region M1/09, Samanpazarı, 06100 Ankara, Turkey
Full list of author information is available at the end of the article
© The Author(s). 2018 Open Access This article is distributed under the terms of the Creative Commons Attribution 4.0 International License (http://creativecommons.org/licenses/by/4.0/), which permits unrestricted use, distribution, and reproduction in any medium, provided you give appropriate credit to the original author(s) and the source, provide a link to the Creative Commons license, and indicate if changes were made. The Creative Commons Public Domain Dedication waiver (http://creativecommons.org/publicdomain/zero/1.0/) applies to the data made available in this article, unless otherwise stated.
Despite the apparent high risk of hypoglycemia, only a few studies have been conducted to evaluate the incidence
rate of hypoglycemia in a real-world setting.
Hypoglycemia is commonly reported in a clinical trial context; however, these studies seldom reflect real-life clinical practice due to rigorous inclusion and exclusion criteria involved, and continuous treatment and follow-up. Increasing evidence on growing incidence of diabetes in low- and middle-income countries has been reported [6]. According to two population-based studies, the prevalence of T2DM in Turkey increased from 7.2% to 16.5% within 12 years [7,8]. Current knowledge on hypoglycemia comes from a few studies in North American or European popu-lations and very limited data are available on hypoglycemia in Turkish diabetes patients [9,10].
This paper describes the results from the Turkey cohort of the International Operations Hypoglycemia Assessment Tool (IO HAT) study which was conducted in 9 countries. The IO HAT study builds on findings from the global HAT study that was conducted in 24 countries [11]. The IO HAT study is an observational study aimed at enhan-cing the clinical understanding of hypoglycemia, and its clinical, social and economic consequences. In turn, this will help to identify cost-effective solutions to improve blood glucose control and Quality of Life (QOL) for patients with diabetes. The current study aims to assess hypoglycemia retrospectively and prospectively among in-sulin treated patients with T1DM or T2DM.
Methods Study design
The Turkey cohort of the IO HAT study was a non-interventional, multi-center, 6-month and 4-week
retrospective and 4-week prospective study to assess hypoglycemia in insulin-treated diabetes patients.
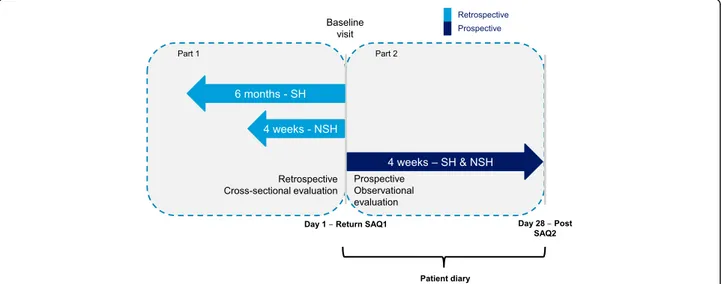
The study was carried out at 92 sites in Turkey. The study design is described in Fig. 1. The study protocol and assessments were conducted in accordance with the Declaration of Helsinki (2013) and the Guidelines for Good Pharmacoepidemiology Practices (2007), and approved by an Ethics Committee. All study materials were translated into Turkish, and data obtained were translated back into English for analysis.
Study population
The study was conducted in male or female T1DM or T2DM patients treated with insulin for more than 12 months and who were 18 years or older, ambulatory, literate, and had given informed consent to participate in the study. To minimize selection bias, eligible patients were enrolled consecutively during routine clinic visits.
Assessments
This study comprised of a two-part self-assessment questionnaire (SAQ) including a retrospective cross-sectional evaluation (SAQ1) and a prospective observa-tional evaluation (SAQ2).
SAQ1 assessed baseline demographic and treatment in-formation, hypoglycemia unawareness and perceptions of hypoglycemia, history of severe hypoglycemia for 6 months before the baseline visit, and “any” and “nocturnal” hypoglycemia for 4 weeks before the baseline visit.
SAQ2 assessed severe and symptomatic hypoglycemia and its effect on productivity and healthcare utilization for 4 weeks from the baseline visit.
SAQ2 also included a validated diabetes-specific qual-ity of life (DSQOL) questionnaire. To assist patients
Fig. 1 IO HAT Study design. Severe hypoglycemia: an event requiring assistance of another person to actively administer carbohydrate, glucagon, or other resuscitative actions; Non-severe hypoglycemia: documented symptomatic (symptoms and blood glucose measurement≤3.9 mmol/L [70 mg/dL]) and probable symptomatic (symptoms only). NSH = non-severe hypoglycemia; SH = severe hypoglycemia; SAQ = self-assessment questionnaire
recall, and as a reminder to complete SAQ2, patients were provided with a diary to capture hypoglycemic epi-sodes. Paired responses to SAQ1 and SAQ2 were used to estimate the differences in the frequency of hypoglycemic episodes between the retrospective and prospective periods. The incidence of severe and symp-tomatic hypoglycemia (defined below) was calculated according to the frequency of episodes over the timeframe stated in the corresponding question. The diary which allowed patients to summarize hypoglycemia information on a daily basis over the 4-week period following the base-line visit was used to evaluate the incidence of hypoglycemia. If there were discrepancies between the diary and the SAQ2 questionnaire, the frequency of hypoglycemia was calculated using the highest recorded total frequency as stated on either of these forms.
Hypoglycemia unawareness was evaluated through the question:‘Do you have symptoms when you have a low sugar level?’ where the response, ‘occasionally’ denoted impaired awareness and ‘never’ denoted severely im-paired awareness [12]. Fear of hypoglycemia was re-ported as rated by the patient on a scale of 0 (not afraid at all) to 10 (absolutely terrified).
Study objectives
The primary objective of the study was to determine the percentage of patients experiencing at least 1 hypoglycemic episode during the 4-week prospective observational period among insulin-treated T1DM or T2DM patients.
The secondary objectives included: incidence of hypoglycemic episodes, difference in the incidence of hypoglycemic episodes before and after the baseline visit, relationship between patient demography, treatment, and hypoglycemia, use of health-care resources, and types of behaviors against hypoglycemia. Diabetes-related late complications, treatment regimen and glycemic control were ascertained from questions com-pleted in the presence of the participant’s health-care professional to improve accuracy.
All other study points including the primary end-point of interest were determined from questions com-pleted by the patient.
Hypoglycemia classification
Severe hypoglycemia was defined as: requiring third-party assistance, based on the American Diabetes Association (ADA) definition [13]; non-severe hypoglycemia: managed by patient alone; any hypoglycemia: the sum of severe and non-severe hypoglycemia; nocturnal hypoglycemia: event occurring between midnight and 06:00 h.
Sample size
Sample size of the total cohort across 9 countries of the IO HAT study was determined to be 6000 patients
assuming a worst case scenario proportion of patients (50%) reporting at least 1 hypoglycemic episode during the 4-week prospective observation period, and that the range of the 95% confidence interval was < 3 percentage point for the total cohort. Of these, 2000 patients were planned to be recruited from Turkey.
Evaluability of patients for analysis
Patients who returned any part of any SAQ or patient diary containing answers to any of the questions re-ceived was also included in the Full Analysis Set (FAS).
Statistical methods
All statistical tests were two-sided and regarded as ex-ploratory, with the criterion for statistical significance set atp < 0.05. The p-values from 0.01 to 0.05 were taken to indicate a modest evidence of a difference, and p-values of < 0.01 were taken to indicate moderate evidence.
For the primary endpoint, the percentage of patients who experienced at least 1 hypoglycemic episode during the 4-week prospective observational period among T1DM or T2DM patients was calculated together with the confidence interval for this percentage. For second-ary endpoints, the incidence of various types of hypoglycemia was calculated as number of episodes per patient-year (ppy) as expressed by the following formula (together with the 95% confidence interval).
Incidence rate = Total number of events / Total follow-up time (patient-years).
The incidence rate (IR) was reported by diabetes type: T1DM and T2DM patients. No imputation of missing data was performed except for calculation of Well-Being Questionnaire-5 summary scores where more than half the items were non-missing. All analyses were con-ducted in the FAS.
Relationship between HbA1c at baseline and
log-transformed number of hypoglycemia events reported by patients was shown by the scatter plot with regression line and 95% confidence interval (CI) and R-squared values were calculated.
Baseline refers to data collected using the Part 1 SAQ; follow-up refers to data collected using the Part 2 SAQ and, where applicable, patient diaries.
Results
Patient characteristics
Overall, 2348 patients (306 with T1DM and 2042 with T2DM) from Turkey enrolled and completed the Part 1 SAQ in the Turkey cohort constituting the FAS. Of these, 252 patients (82.4%) with T1DM and 1781 pa-tients (87.2%) with T2DM completed the Part 2 SAQ; and 247 patients (80.7%) with T1DM and 1749 patients (85.7%) with T2DM completed the patient diary and were included in the completers analysis set (CAS).
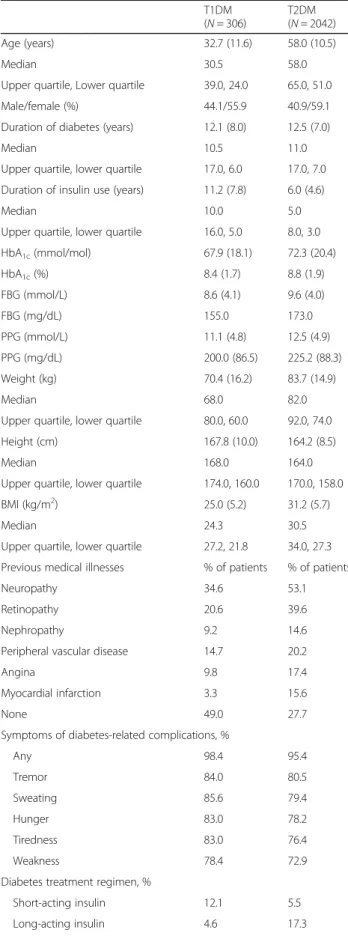
Baseline characteristics for T1DM and T2DM patients in the FAS are presented in Table1. Patients with T1DM were younger than those with T2DM (32.7 years vs. 58.0 years, respectively) and had a longer median duration of insulin use (11.2 years vs. 6.0 years, respect-ively). Mean HbA1c was lower in patients with T1DM
(8.4% [67.9 mmol/mol]) than in those with T2DM (8.8% [72.3 mmol/mol]).
Frequency of hypoglycemia Any hypoglycemia
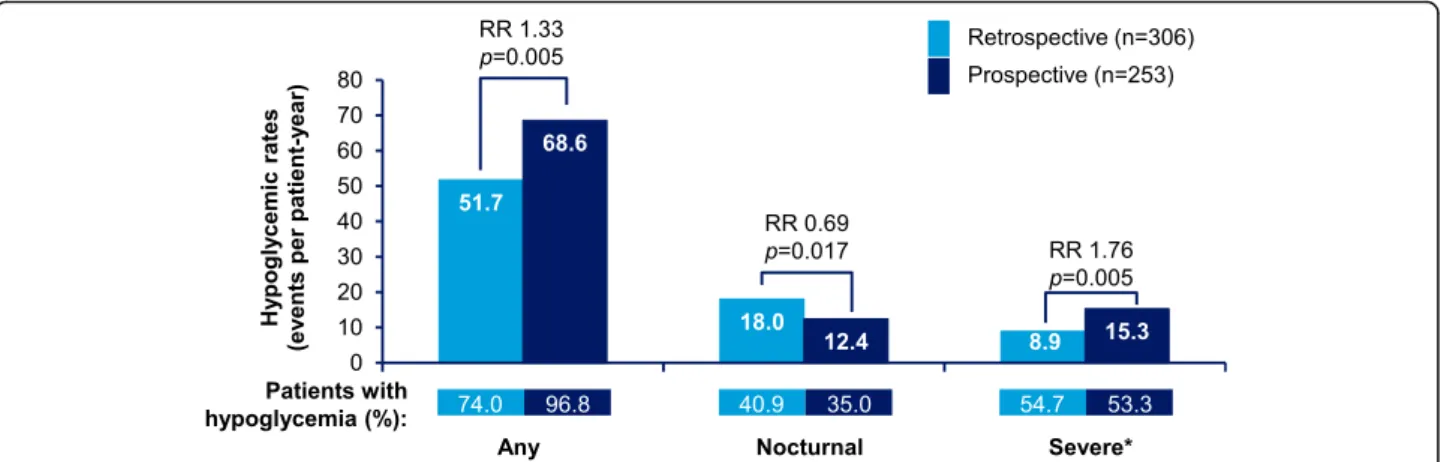
Any hypoglycemia rates in T1DM and T2DM patients are presented in Figs. 2 and 3, respectively. In T1DM patients, 96.8% patients reported hypoglycemic events (IR: 68.6 events ppy), prospectively, while 74.0% patients reported hypoglycemic events (IR: 51.7 events ppy), retrospectively. In T2DM patients, 95.9% patients (IR: 28.3 events ppy) reported hypoglycemic events, pro-spectively, while 53.6% patients (IR: 23.0 events ppy) reported hypoglycemic events, retrospectively.
The rates of any hypoglycemia were significantly higher in the prospective period compared with the retrospective period in both T1DM and T2DM patients (T1DM,p = 0.005; T2DM, p < 0.001).
Nocturnal hypoglycemia
Nocturnal hypoglycemia rates in T1DM and T2DM patients are presented in Figs. 2 and 3, respectively. Unlike, any hypoglycemia, the retrospective rates for nocturnal hypoglycemia were higher compared to the prospective rates in both T1DM and T2DM patients; 40.9% vs. 35.0% (IR: 18.0 ppy vs. 12.4 ppy) in T1DM, 15.2% vs. 10.6% (IR:5.0 ppy vs. 2.6 ppy) in T2DM; (T1DM,p = 0.017; T2DM, p < 0.001).
Severe hypoglycemia
Severe hypoglycemia rates in T1DM and T2DM patients are presented in Figs.2and3, respectively. In T1DM pa-tients, in the 6-month retrospective period, severe hypoglycemia was reported by 54.7% (IR: 8.9 events ppy) patients, while in the 4-week prospective period, severe hypoglycemia was reported by 53.3% (IR: 15.3 events ppy) patients. In T2DM patients, 50.1% (IR: 4.1 events ppy) and 61.9% (IR: 10.0 events ppy) patients reported severe hypoglycemia, retrospectively and prospectively. The rates of severe hypoglycemia were significantly higher in the prospective period compared with those in the retrospect-ive period (T1DM,p = 0.005; T2DM, p < 0.001).
Use of health system resources
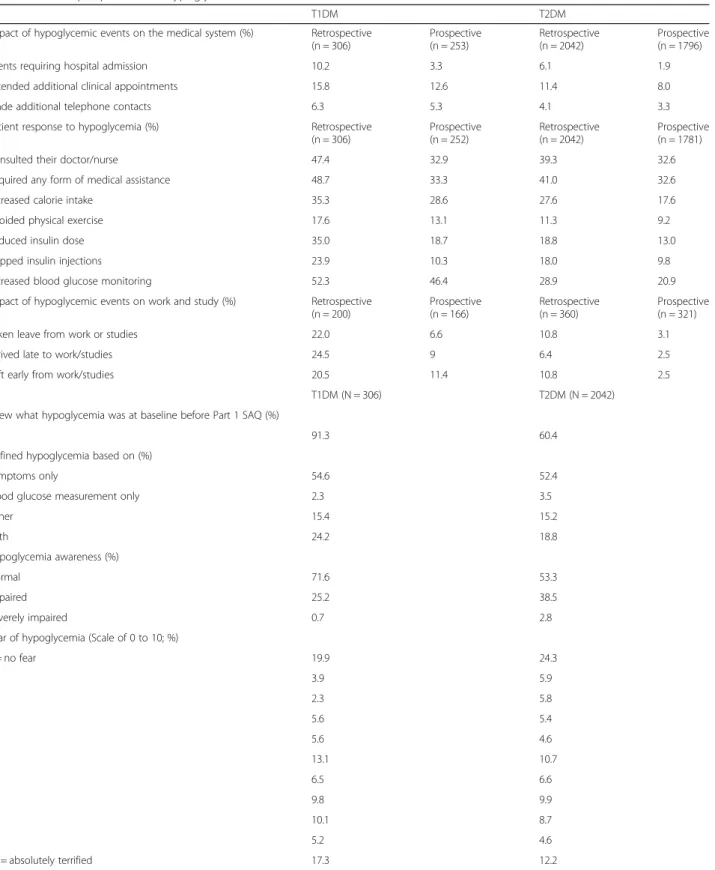
The impact of hypoglycemia on the medical system was higher in the 6-month retrospective period than in the 4-week prospective period for both T1DM and T2DM patients (Table2).
Hypoglycemia requiring hospitalization
In T1DM patients, 10.2% patients (6-month retrospective period) and 3.3% patients (4-week prospective period) re-ported hypoglycemia requiring hospitalization. In T2DM patients, 6.1% patients (6-month retrospective period) and 1.9% patients (4-week prospective period) reported hypoglycemia requiring hospitalization (Table2).
Requiring additional clinic appointments
In T1DM patients, 15.8% (6-month retrospective period) and 12.6% (4-week prospective period) patients required additional clinic appointments. In T2DM patients, 11.4% (6-month retrospective period) and 8.0% (4-week pro-spective period) required additional clinic appointments (Table2).
Requiring number of additional telephone contacts made
In T1DM patients, 6.3% patients (6-month retrospective period) and 5.3% patients (4-week prospective period) made additional telephone contacts. In T2DM patients, 4.1% patients (6-month retrospective period) and 3.3% patients (4-week prospective period) made additional telephone contacts (Table2).
Patient response to hypoglycemia
The overall patient actions resulting from hypoglycemia were more in the 6-month retrospective period than in the 4-week prospective period in both T1DM and T2DM patients (Table2). For patients with T1DM, the 6-month retrospective and 4-week prospective data, respectively, were: the percentage of patients who consulted their doctor or nurse (47.4% vs. 32.9%), required any form of medical assistance (48.7% vs. 33.3%), increased calorie in-take (35.3% vs. 28.6%), avoided physical exercise (17.6% vs. 13.1%), reduced insulin dose (35.0% vs. 18.7%), skipped insulin injections (23.9% vs. 10.3%), and increased blood glucose monitoring (52.3% vs. 46.4%).
In the T2DM patients, the 6-month retrospective and 4-week prospective data, respectively, were: the percent-age of patients who consulted their doctor or nurse (39.3% vs. 32.6%), required any form of medical assist-ance (41.0% vs. 32.6%), increased calorie intake (27.6% vs. 17.6%), avoided physical exercise (11.3% vs. 9.2%), reduced insulin dose (18.8% vs. 13.0%), skipped insulin injections (18.0% vs. 9.8%), and increased blood glucose monitoring (28.9% vs. 20.9%).
Impact of hypoglycemia on work/studies
Higher percentage of patients took leave from work/ studies, arrived late or left early from work/studies in the retrospective period than the prospective period (Table 2). In T1DM patients, the 6-month retrospective and 4-week prospective data, respectively were: 22.0% vs. 6.6% patients had taken leave from work/studies,
24.5% vs. 9.0% patients had arrived late to work/studies, and 20.5% vs. 11.4% patients left early from work/stud-ies. In T2DM patients, the 6-month retrospective and 4-week prospective data, respectively were: 10.8% vs. 3.1% patients had taken leave from work/studies, 6.4% vs. 2.5% patients had arrived late to work/studies, and 10.8% vs. 2.5% patients left early from work/studies.
Hypoglycemia awareness
More patients with T1DM than with T2DM had know-ledge of hypoglycemia before reading the definition in the Part 1 SAQ (91.3% [T1DM] and 60.4% [T2DM]) and had a higher normal hypoglycemia awareness (71.6% [T1DM] and 53.3% [T2DM]) (Table2). There were no notable dif-ferences between patients with T1DM or T2DM with re-spect to fear of hypoglycemia, with a mean (standard deviation) score of 5.3 (3.6) for patients with T1DM and 4.5 (3.6) for patients with T2DM (Table2).
Hypoglycemia by insulin regimen
Incidence rates of any hypoglycemia in T1DM and
T2DM patients in the 4-week retrospective and
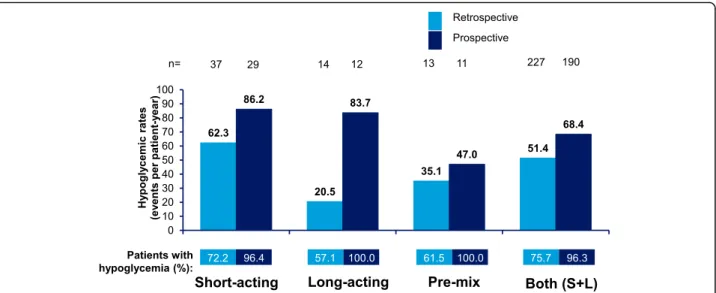
prospective assessment periods by insulin regimen (short-acting, acting, pre-mix, and short- plus long-acting) are shown in Figs. 4 and 5, respectively. Estimated IRs of any and severe hypoglycemia increased whilst estimated IRs of nocturnal hypoglycemia generally decreased in the prospective period versus the retro-spective period in patients with T1DM and T2DM.
The estimated IRs of any hypoglycemic events in the 4-week retrospective and 4-week prospective assessment were highest in patients with T1DM using short-acting insulin in the prospective period (86.2 ppy) and lowest in patients with T2DM using long-acting insulin, in the retrospective period (11.9 ppy).
The IRs of nocturnal hypoglycemia were highest in pa-tients with T1DM using short-acting insulin in the 4-week retrospective period (20.5 events ppy) and lowest
Table 1 Baseline characteristics
T1DM (N = 306) T2DM (N = 2042) Age (years) 32.7 (11.6) 58.0 (10.5) Median 30.5 58.0
Upper quartile, Lower quartile 39.0, 24.0 65.0, 51.0 Male/female (%) 44.1/55.9 40.9/59.1 Duration of diabetes (years) 12.1 (8.0) 12.5 (7.0)
Median 10.5 11.0
Upper quartile, lower quartile 17.0, 6.0 17.0, 7.0 Duration of insulin use (years) 11.2 (7.8) 6.0 (4.6)
Median 10.0 5.0
Upper quartile, lower quartile 16.0, 5.0 8.0, 3.0 HbA1c(mmol/mol) 67.9 (18.1) 72.3 (20.4) HbA1c(%) 8.4 (1.7) 8.8 (1.9) FBG (mmol/L) 8.6 (4.1) 9.6 (4.0) FBG (mg/dL) 155.0 173.0 PPG (mmol/L) 11.1 (4.8) 12.5 (4.9) PPG (mg/dL) 200.0 (86.5) 225.2 (88.3) Weight (kg) 70.4 (16.2) 83.7 (14.9) Median 68.0 82.0
Upper quartile, lower quartile 80.0, 60.0 92.0, 74.0 Height (cm) 167.8 (10.0) 164.2 (8.5)
Median 168.0 164.0
Upper quartile, lower quartile 174.0, 160.0 170.0, 158.0 BMI (kg/m2) 25.0 (5.2) 31.2 (5.7)
Median 24.3 30.5
Upper quartile, lower quartile 27.2, 21.8 34.0, 27.3 Previous medical illnesses % of patients % of patients
Neuropathy 34.6 53.1
Retinopathy 20.6 39.6
Nephropathy 9.2 14.6
Peripheral vascular disease 14.7 20.2
Angina 9.8 17.4
Myocardial infarction 3.3 15.6
None 49.0 27.7
Symptoms of diabetes-related complications, %
Any 98.4 95.4 Tremor 84.0 80.5 Sweating 85.6 79.4 Hunger 83.0 78.2 Tiredness 83.0 76.4 Weakness 78.4 72.9
Diabetes treatment regimen, %
Short-acting insulin 12.1 5.5
Long-acting insulin 4.6 17.3
Table 1 Baseline characteristics (Continued)
T1DM (N = 306)
T2DM (N = 2042)
Pre-mix 4.2 33.3
Both short- and long-acting 74.2 41.1 Both short-acting and pre-mix 0.3 0.6 Both long-acting and pre-mix 3.3 1.4 Short- and long-acting and pre-mix 0.0 0.0
Missing 1.3 0.8
Data are presented as mean (SD) unless otherwise stated
BMI = body mass index, FBG = fasting blood glucose, HbA1c = glycated hemoglobin, N = total number of patients participating, PPG = postprandial glucose, SD = standard deviation, T1DM = type I diabetes mellitus, T2DM = type II diabetes mellitus
in the 4-week prospective period in T2DM patients using short-acting insulin (1.1 events ppy).
The IRs of severe hypoglycemia were highest in T1DM patients using pre-mix insulin in the 4-week pro-spective period (19.6 ppy) and lowest in T1DM patients using long-acting insulin in the 6-month retrospective period (1.2 ppy).
Associations between hypoglycemia and continuous or predictor variables
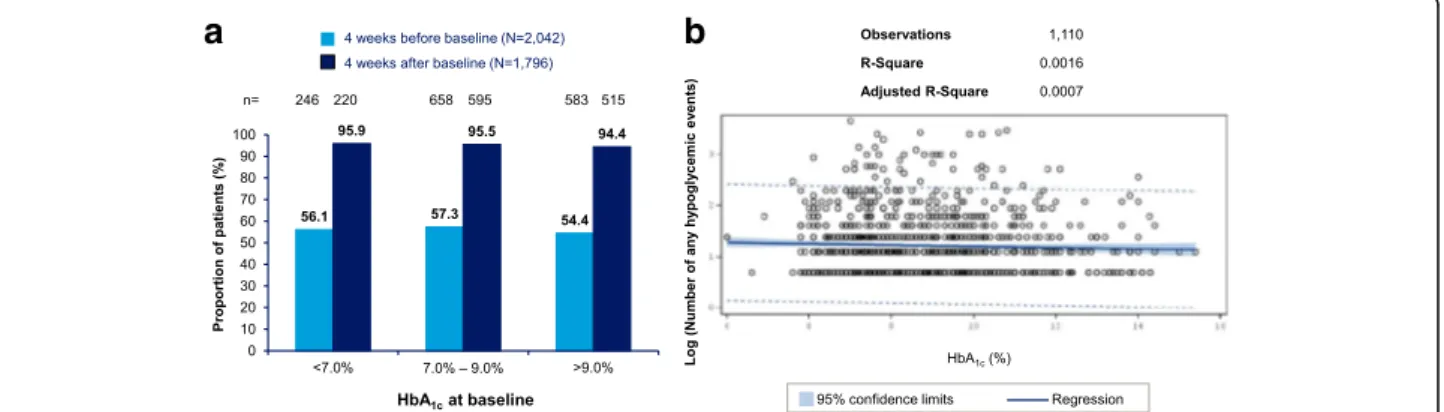
In this study, no correlation was observed between baseline HbA1c and any hypoglycemia events in both T1DM and
T2DM populations (Figs.6and7, respectively). No signifi-cant association between hypoglycemia and duration of diabetes or duration of insulin therapy was seen (Additional files 1and 2, respectively). Patients who mea-sured their blood glucose levels more frequently reported higher rates of hypoglycemia compared to those who moni-tored their blood glucose levels less frequently (Fig.8).
Discussion
This paper describes the results from the Turkey cohort of the international, non-interventional, multicenter, retrospective and prospective study to assess the inci-dence of patient-reported hypoglycemia in insulin-treated diabetes patients.
This is a first report of an observational study to assess hypoglycemia both retrospectively and prospectively in
the Turkish T1DM and T2DM patients. While
hypoglycemia has been reported from a few observa-tional studies in Turkish population, the main aim of these studies were not to assess hypoglycemia. Minor hypoglycemia rates of 1.08 and 2.56 ppy were prospect-ively observed in the insulin detemir and insulin glargine group, respectively, in the Turkish T2DM cohort from
the observational SOLVE study [10]. The lower
hypoglycemic frequencies obtained in these studies could be explained by the fact that hypoglycemia assess-ment was not the primary objective of these studies and
Fig. 3 Estimated rate of retrospective and prospective hypoglycemia in T2DM (any, nocturnal, and severe hypoglycemia).‘Any’ and ‘Nocturnal’ based on 4-week period for both retrospective and prospective analyses. *Retrospective data based on 6-month period and prospective data based on 4-week period. RR = rate ratio; T2DM = type II diabetes mellitus
Fig. 2 Estimated rate of retrospective and prospective hypoglycemia in T1DM (any, nocturnal, and severe hypoglycemia).‘Any’ and ‘Nocturnal’ based on 4-week period for both retrospective and prospective analyses. *Retrospective data based on 6-month period and prospective data based on 4-week period. RR = rate ratio; T1DM = type I diabetes mellitus
Table 2 Patient perspectives on hypoglycemia
T1DM T2DM
Impact of hypoglycemic events on the medical system (%) Retrospective (n = 306) Prospective (n = 253) Retrospective (n = 2042) Prospective (n = 1796)
Events requiring hospital admission 10.2 3.3 6.1 1.9
Attended additional clinical appointments 15.8 12.6 11.4 8.0
Made additional telephone contacts 6.3 5.3 4.1 3.3
Patient response to hypoglycemia (%) Retrospective (n = 306) Prospective (n = 252) Retrospective (n = 2042) Prospective (n = 1781)
Consulted their doctor/nurse 47.4 32.9 39.3 32.6
Required any form of medical assistance 48.7 33.3 41.0 32.6
Increased calorie intake 35.3 28.6 27.6 17.6
Avoided physical exercise 17.6 13.1 11.3 9.2
Reduced insulin dose 35.0 18.7 18.8 13.0
Skipped insulin injections 23.9 10.3 18.0 9.8
Increased blood glucose monitoring 52.3 46.4 28.9 20.9
Impact of hypoglycemic events on work and study (%) Retrospective (n = 200) Prospective (n = 166) Retrospective (n = 360) Prospective (n = 321)
Taken leave from work or studies 22.0 6.6 10.8 3.1
Arrived late to work/studies 24.5 9 6.4 2.5
Left early from work/studies 20.5 11.4 10.8 2.5
T1DM (N = 306) T2DM (N = 2042)
Knew what hypoglycemia was at baseline before Part 1 SAQ (%)
91.3 60.4
Defined hypoglycemia based on (%)
Symptoms only 54.6 52.4
Blood glucose measurement only 2.3 3.5
Either 15.4 15.2 Both 24.2 18.8 Hypoglycemia awareness (%) Normal 71.6 53.3 Impaired 25.2 38.5 Severely impaired 0.7 2.8
Fear of hypoglycemia (Scale of 0 to 10; %)
0 = no fear 19.9 24.3 1 3.9 5.9 2 2.3 5.8 3 5.6 5.4 4 5.6 4.6 5 13.1 10.7 6 6.5 6.6 7 9.8 9.9 8 10.1 8.7 9 5.2 4.6 10 = absolutely terrified 17.3 12.2
Hypoglycemia unawareness was evaluated through the question:‘Do you have symptoms when you have a low sugar level?’ where the response, ‘occasionally’ denoted impaired awareness and‘never’ denoted severely impaired awareness
N = total number of patients participating; n = number of patients who responded to the set of questions; SAQ = self-assessment questionnaire; T1DM = type I diabetes mellitus; T2DM = type II diabetes mellitus
the reported frequency is for minor hypoglycemia which may not encompass a total hypoglycemic rate. Total hypoglycemic episodes in the 4-week retrospective period in the PREDICTIVE study were 47.5 ppy in pa-tients with T1DM and 9.2 ppy in papa-tients with T2DM in the European cohort (Turkey population was included) [14], which are comparable to those for T1DM popula-tion but less compared to T2DM populapopula-tion observed in the current study (51.7 ppy and 23.0 ppy, respectively).
The hypoglycemia rates seen in the IO HAT Turkey co-hort aligned with the overall IO HAT results [15]. The fre-quency of overall hypoglycemia in the prospective period in the Turkey cohort was comparable to global HAT in T1DM patients but was considerably higher in T2DM pa-tients (28.3 events ppy) than the global HAT study (19.3
events ppy). The reason for this could be the country-specific variations in the prevalence and management of diabetes and hypoglycemia in the two studies.
Similar to the overall IO HAT results, higher frequency of patients reported hypoglycemia in the prospective period as compared to the retrospective period in both T1DM and T2DM patients in the Turkey cohort. The rea-son for this could be the use of patient diary during the prospective period. While a patient recorded data daily using patient diary during the prospective period, the data for the retrospective period was collected at baseline visit
based on the patient’s memory of the previous
hypoglycemic events, possibly causing under-reporting. The patient education on hypoglycemia at the baseline visit could have also led to an improved reporting of
Fig. 4 Estimated rate of any hypoglycemic event by insulin regimen in T1DM. Data based on 4-week period for both retrospective and prospective analyses. S + L = short-acting and long-acting insulin; T1DM = type I diabetes mellitus; n = number of patients
Fig. 5 Estimated rate of any hypoglycemic event by insulin regimen in T2DM. Data based on 4-week period for both retrospective and prospective analyses. S + L = short-acting and long-acting insulin; T2DM = type 2 diabetes mellitus; n = number of patients
hypoglycemia in the prospective period. On similar lines, the higher frequency of severe hypoglycemia observed during the prospective period over the retrospective period in both T1DM and T2DM patients could also be explained. However, a lower frequency of nocturnal hypoglycemia was reported in the prospective period over the retrospective period. This could be because of a well-defined cut-off for the nocturnal hypoglycemia, midnight to 06.00 am, during the prospective period. The perceived fear of nocturnal hypoglycemia could also probably cause an over-reporting of events during the retrospective period based on patient recall. Also, difficulty in using a diary during the night-time could have affected the report-ing of nocturnal hypoglycemia durreport-ing the prospective period. Interestingly, though the prospectively reported “any” and “severe” hypoglycemia rates were higher than retrospectively reported rates, a higher proportion of pa-tients reported increased utilization of healthcare re-sources (hospital admissions, additional clinical appointments) in the retrospective period than the
prospective period. Similarly, a higher proportion of pa-tients reported that the hypoglycemic events impacted their work and study in the retrospective period than in the prospective period. The reason for this could be be-cause the patients were well-informed about hypoglycemia at the baseline visit leading to less impact on patients’ quality of life in the prospective period. Another explan-ation could be that the assessment period for some of the parameters in the retrospective period was of 6 months compared to 4 weeks during the prospective period and hence the difference.
In the PREDICTIVE study, the frequency of
hypoglycemia in insulin-treated patients showed a signifi-cant, positive association with duration of diabetes, and number of insulin injections but was inversely related to HbA1c[14]. Unlike the global HAT study [11], no
signifi-cant correlation of hypoglycemia with duration of diabetes and insulin therapy was seen in the current study. Also,
no significant correlation between HbA1c and
hypoglycemia was observed which is in line with global
a
b
Fig. 6 Relationship between HbA1cand number of events– any hypoglycemic event in T1DM. a Proportion of patients experiencing any hypoglycemia
during the retrospective and prospective periods, stratified by HbA1clevels at baseline b Scatter plot with regression line and 95% confidence interval for
relationship between HbA1cat baseline and log-transformed number of events for patients experiencing any hypoglycemia before or after baseline.
HbA1c= hemoglobin A1c; T1DM = type I diabetes mellitus
a
b
Fig. 7 Relationship between HbA1cand number of events– any hypoglycemic event in T2DM. a Proportion of patients experiencing any hypoglycemia
during the retrospective and prospective periods, stratified by HbA1clevels at baseline b Scatter plot with regression line and 95% confidence interval for
relationship between HbA1cat baseline and log-transformed number of events for patients experiencing any hypoglycemia before or after baseline.
HAT study results [11] and recent findings that the in-verse correlation between HbA1c and hypoglycemia has
diminished due to advances in therapy in the recent years [16]. A regular self-monitoring of blood glucose is import-ant to detect hypoglycemia and for overall diabetes man-agement [17]. A positive correlation between frequency of blood glucose monitoring and reported hypoglycemia rates was seen in the current study which suggests its im-portance to detect hypoglycemia.
Conclusions
The current study has enabled to obtain real-world data on hypoglycemia rates from Turkey where very few data were available in spite of a high rate of diabetes prevalence. The results from this study confirms that hypoglycemia remains under-reported. The higher hypoglycemic rates observed in Turkish population could be because of higher burden of diabetes combined with lack of standard care and treat-ment as compared to European and North American population and needs to be investigated further. The hypoglycemia data in Turkish cohort is an important step towards a customized country-specific healthcare plan to control diabetes.
Additional file
Additional file 1:Estimated rate of any hypoglycemic event by duration of diabetes in T1DM and T2DM patients. Percentages represent percent of patients with hypoglycemia in each quartile. PPY = per patient-year; T1DM = type 1 diabetes mellitus; T2DM = type 2 diabetes mellitus. (PPTX 361 kb)
Additional file 2:Estimated rate of any hypoglycemic event by duration of insulin therapy in T1DM and T2DM patients. Percentages represent percent of patients with hypoglycemia in each quartile. PPY = per patient-year; T1DM = type 1 diabetes mellitus; T2DM = type 2 diabetes mellitus. (PPTX 362 kb)
Abbreviations
ADA:American Diabetes Association; CAS: Completers analysis set; CI: Confidence interval; DSQOL: Diabetes-related quality of life; FAS: Full analysis set; IO HAT: International Operations Hypoglycemia Assessment Tool;
IR: Incidence rate; ppy: Per patient-year; QOL: Quality of life; SAQ: Self-assessment questionnaire; T1DM: Type I diabetes mellitus; T2DM: Type II diabetes mellitus
Acknowledgements
Statistical analysis was performed by Paraxel International. The authors acknowledge medical writing and submission support provided by Archana Gandhe from Cognizant Technology Solutions. Novo Nordisk was involved in the study design; collection, analysis and interpretation of data; and decision to submit the article for publication.
Funding
Financial support for the conduct of the research was provided by Novo Nordisk. Availability of data and materials
The datasets used and/or analyzed during the current study are available from the corresponding author on reasonable request.
Authors’ contributions
RE conceptualized the study design, was involved in acquisition of data, analyzed and interpreted the data, and finalized the manuscript. TT, IS, RS, AK, IY, and NT contributed towards study design, data acquisition, data interpretation, and preparation and finalization of the manuscript. SC contributed to study design, data interpretation, and preparation and finalization of the manuscript. All authors had input into the data interpretation and preparation of the final manuscript for publication, met the ICMJE criteria for authorship, and have approved the final article for submission.
Ethics approval and consent to participate
Istanbul University Cerrahpasa Medical Faculty Clinical Trial Ethics Committee (Nb:83,045,809/604.01/02-42,378) approved this study. All patients provided written informed consent.
Consent for publication Not applicable. Competing interests
RE: Speaker fees from Novo Nordisk, MSD, AstraZeneca, Boehringer, Sanofi; participation in advisory boards from Novo Nordisk, Sanofi, AstraZeneca. TT: Speaker fees from Gen Pharmaceuticals, Novartis, Lilly, Novo Nordisk, MSD, AstraZeneca, Boehringer, Sanofi, Bilim; participation in advisory boards from Novo Nordisk, Sanofi, Lilly.
IS: Speaker fees from Novo Nordisk, MSD, AstraZeneca, Boehringer, Sanofi, Lilly and Novartis; participation in advisory boards from Sanofi, Lilly, Novo Nordisk and AstraZeneca.
RS: Speaker fees from Novo Nordisk, MSD, AstraZeneca, Boehringer, Sanofi, Lilly, Novartis; participation in advisory boards from Sanofi, AstraZeneca. Fig. 8 Estimated rate of any hypoglycemic event by glucose monitoring frequency in T1DM and T2DM patients. Percentages represent percent of patients with hypoglycemia in each quartile. PPY = per patient-year; T1DM = type 1 diabetes mellitus; T2DM = type 2 diabetes mellitus
AK: Speaker fees from Novo Nordisk, AstraZeneca, Boehringer, Sanofi, Lilly, Novartis; participation in advisory boards from Sanofi, AstraZeneca, NovoNordisk.
IY: Speaker fees from Novo Nordisk, AstraZeneca, Boehringer, Sanofi, Novartis, Lilly; participation in advisory boards from Novo Nordisk, Sanofi, AstraZeneca. SC: Employee of Novo Nordisk.
NT: Speaker fees from Novo Nordisk, MSD, AstraZeneca, Boehringer, Sanofi, Novartis, Lilly; participation in advisory boards from Novo Nordisk, Sanofi, AstraZeneca.
Publisher’s Note
Springer Nature remains neutral with regard to jurisdictional claims in published maps and institutional affiliations.
Author details
1
Department of Endocrinology and Metabolic Diseases, Ankara University, Faculty of Medicine,İbn-i Sina Hospital, Academic Region M1/09, Samanpazarı, 06100 Ankara, Turkey.2Faculty of Medicine, Department of
Endocrinology and Metabolic Diseases, Çukurova University, Adana, Turkey.
3
Endocrinology and Metabolism Department, Inonu University School of Medicine, Malatya, Turkey.4Division of Endocrinology and Metabolism,
School of Medicine, Akdeniz University, Antalya, Turkey.5Division of
Endocrinology and Metabolism, Meram School of Medicine, Necmettin Erbakan University, Konya, Turkey.6Division of Endocrinology and Metabolism, School of Medicine, Gazi University, Ankara, Turkey.7Medical
Department, Novo Nordisk, Istanbul, Turkey.8Division of Endocrinology and
Metabolism, School of Medicine, Baskent University, Ankara, Turkey.
Received: 19 September 2017 Accepted: 1 February 2018
References
1. Cryer PE. Managing diabetes: lessons from type 1 diabetes mellitus. Diabet Med. 1998;15(Suppl 4):S8–12.
2. Gumprecht J, Nabrdalik K. Hypoglycemia in patients with insulin-treated diabetes. Pol Arch Med Wewn. 2016;126(11):870–8.
3. Blumer I, Clement M. Type 2 diabetes, hypoglycemia, and basal Insulins: ongoing challenges. Clin Ther. 2017;39(8S2):S1–S11.https://doi.org/10.1016/ j.clinthera.2016.09.020.
4. McCrimmon RJ. RD Lawrence lecture 2015 old habits are hard to break: lessons from the study of hypoglycaemia. Diabet Med. 2017;34(2):148–55. 5. Khunti K, Millar-Jones D. Clinical inertia to insulin initiation and
intensification in the UK: a focused literature review. Prim Care Diabetes. 2017;11(1):3–12.
6. Whiting DR, Guariguata L, Weil C, Shaw J. IDF diabetes atlas: global estimates of the prevalence of diabetes for 2011 and 2030. Diabetes Res Clin Pract. 2011;94(3):311–21.
7. Satman I, Yilmaz T, Sengul A, Salman S, Salman F, Uygur S, et al. Population-based study of diabetes and risk characteristics in Turkey: results of the turkish diabetes epidemiology study (TURDEP). Diabetes Care. 2002;25(9):1551–6. 8. Satman I, Omer B, Tutuncu Y, Kalaca S, Gedik S, Dinccag N, et al.
Twelve-year trends in the prevalence and risk factors of diabetes and prediabetes in Turkish adults. Eur J Epidemiol. 2013;28(2):169–80.
9. Besen BD, Sürücü HA, Koşar C. Self-reported frequency, severity of, and awareness of hypoglycemia in type 2 diabetes patients in Turkey. Peer J. 2016;4:e2700. eCollection 2016
10. Damci T, Emral R, Svendsen AL, Balkir T, Vora J, SOLVE™ study. Lower risk of hypoglycaemia and greater odds for weight loss with initiation of insulin detemir compared with insulin glargine in Turkish patients with type 2 diabetes mellitus: local results of a multinational observational study. BMC Endocr Disord. 2014;14:61.https://doi.org/10.1186/1472-6823-14-61. 11. Khunti K, Alsifri S, Aronson R, Cigrovski Berković M, Enters-Weijnen C, Forsén
T, et al. Rates and predictors of hypoglycaemia in 27 585 people from 24 countries with insulin-treated type 1 and type 2 diabetes: the global HAT study. Diabetes Obes Metab. 2016;18(9):907–15.
12. Pedersen-Bjergaard U, Pramming S, Thorsteinsson B. Recall of severe hypoglycaemia and self-estimated state of awareness in type 1 diabetes. Diabetes Metab Res Rev. 2003;19:232–40.
13. American Diabetes Association Workgroup on Hypoglycemia. Defining and reporting hypoglycemia in diabetes: a report from the American Diabetes Association workgroup on hypoglycemia. Diabetes Care. 2005;28:1245–9.
14. Lüddeke HJ, Sreenan S, Aczel S, Maxeiner S, Yenigun M, Kozlovski P, et al. PREDICTIVE- a global, prospective observational study to evaluate insulin detemir treatment in types 1 and 2 diabetes: baseline characteristics and predictors of hypoglycaemia from the European cohort. Diabetes Obes Metab. 2007;9(3):428–34.
15. Emral R, Pathan F, Cortes C, El-Hefnawy MH, Goh S, Gómez AM, et al. Self-reported hypoglycemia in insulin-treated patients with diabetes: results from an international survey of 7289 patients from nine countries. Diabetes Res Clin Pract. 2017;134:17–28.
16. Karges B, Rosenbauer J, Kapellen T, Wagner VM, Schober E, Karges W, et al. Hemoglobin A1c levels and risk of severe hypoglycemia in children and young adults with type 1 diabetes from Germany and Austria: a trend analysis in a cohort of 37,539 patients between 1995 and 2012. PLoS Med. 2014;11(10):e1001742.https://doi.org/10.1371/journal.pmed.1001742. 17. Czupryniak L, Barkai L, Bolgarska S, Bronisz A, Broz J, Cypryk K, et al.
Self-monitoring of blood glucose in diabetes: from evidence to clinical reality in central and Eastern Europe—recommendations from the international central-eastern European expert group. Diabetes Technol Ther. 2014;16(7):460–75.
• We accept pre-submission inquiries
• Our selector tool helps you to find the most relevant journal • We provide round the clock customer support
• Convenient online submission • Thorough peer review
• Inclusion in PubMed and all major indexing services • Maximum visibility for your research
Submit your manuscript at www.biomedcentral.com/submit