ScienceDirect
Available online at Available online at www.sciencedirect.comwww.sciencedirect.com
ScienceDirect
Energy Procedia 00 (2017) 000–000
www.elsevier.com/locate/procedia
1876-6102 © 2017 The Authors. Published by Elsevier Ltd.
Peer-review under responsibility of the Scientific Committee of The 15th International Symposium on District Heating and Cooling.
The 15th International Symposium on District Heating and Cooling
Assessing the feasibility of using the heat demand-outdoor
temperature function for a long-term district heat demand forecast
I. Andrić
a,b,c*, A. Pina
a, P. Ferrão
a, J. Fournier
b., B. Lacarrière
c, O. Le Corre
c aIN+ Center for Innovation, Technology and Policy Research - Instituto Superior Técnico, Av. Rovisco Pais 1, 1049-001 Lisbon, PortugalbVeolia Recherche & Innovation, 291 Avenue Dreyfous Daniel, 78520 Limay, France
cDépartement Systèmes Énergétiques et Environnement - IMT Atlantique, 4 rue Alfred Kastler, 44300 Nantes, France
Abstract
District heating networks are commonly addressed in the literature as one of the most effective solutions for decreasing the greenhouse gas emissions from the building sector. These systems require high investments which are returned through the heat sales. Due to the changed climate conditions and building renovation policies, heat demand in the future could decrease, prolonging the investment return period.
The main scope of this paper is to assess the feasibility of using the heat demand – outdoor temperature function for heat demand forecast. The district of Alvalade, located in Lisbon (Portugal), was used as a case study. The district is consisted of 665 buildings that vary in both construction period and typology. Three weather scenarios (low, medium, high) and three district renovation scenarios were developed (shallow, intermediate, deep). To estimate the error, obtained heat demand values were compared with results from a dynamic heat demand model, previously developed and validated by the authors.
The results showed that when only weather change is considered, the margin of error could be acceptable for some applications (the error in annual demand was lower than 20% for all weather scenarios considered). However, after introducing renovation scenarios, the error value increased up to 59.5% (depending on the weather and renovation scenarios combination considered). The value of slope coefficient increased on average within the range of 3.8% up to 8% per decade, that corresponds to the decrease in the number of heating hours of 22-139h during the heating season (depending on the combination of weather and renovation scenarios considered). On the other hand, function intercept increased for 7.8-12.7% per decade (depending on the coupled scenarios). The values suggested could be used to modify the function parameters for the scenarios considered, and improve the accuracy of heat demand estimations.
© 2017 The Authors. Published by Elsevier Ltd.
Peer-review under responsibility of the Scientific Committee of The 15th International Symposium on District Heating and Cooling.
Keywords: Heat demand; Forecast; Climate change
Energy Procedia 156 (2019) 2–6
1876-6102 © 2019 The Authors. Published by Elsevier Ltd.
This is an open access article under the CC BY-NC-ND license (https://creativecommons.org/licenses/by-nc-nd/4.0/)
Selection and peer-review under responsibility of the 2018 5th International Conference on Power and Energy Systems Engineering, CPESE 2018, 19–21 September 2018, Nagoya, Japan.
10.1016/j.egypro.2018.11.073
10.1016/j.egypro.2018.11.073 1876-6102
Available online at www.sciencedirect.com
ScienceDirect
Energy Procedia 00 (2018) 000–000
www.elsevier.com/locate/procedia
1876-6102 © 2018 The Authors. Published by Elsevier Ltd.
This is an open access article under the CC BY-NC-ND license (https://creativecommons.org/licenses/by-nc-nd/4.0/)
Selection and peer-review under responsibility of the 2018 5th International Conference on Power and Energy Systems Engineering, CPESE 2018, 19–21 September 2018, Nagoya, Japan.
2018 5th International Conference on Power and Energy Systems Engineering, CPESE 2018,
19–21 September 2018, Nagoya, Japan
An integrated review and analysis of multi-energy transition from
fossil fuels to renewables
Volkan Ş. Ediger
a,*
aKadir Has University, Center for Energy and Sustainable Development (CESD), Cibali, Istanbul 34083, Turkey
Abstract
We are in the midst of a transition from a fossil fuel-dominated energy regime to a more sustainable lower-carbon one in which natural gas is a bridge fuel. Since the 1970s oil crises, however, the forecasts for gas and coal have changed three times. Gas is currently achieving a major position in the world’s energy mix but under challenging geopolitical forces; for this reason, different countries will follow different paths for adopting gas. This article uses a ternary diagram to shows that the fossil fuel consumption paths of the powers have greatly diverged over time. The close relationship between world hegemony and the dominant energy source (coal and then oil) in the past will be replaced by a multi-energy transition in which different countries choose different energy regimes in a multipolar international system.
© 2018 The Authors. Published by Elsevier Ltd.
This is an open access article under the CC BY-NC-ND license (https://creativecommons.org/licenses/by-nc-nd/4.0/)
Selection and peer-review under responsibility of the 2018 5th International Conference on Power and Energy Systems Engineering, CPESE 2018, 19–21 September 2018, Nagoya, Japan.
Keywords: Energy transition; trend reversal; multi-energy transition
1. Introduction
The rate of fossil fuel consumption increased rapidly with the advance of industrialization, providing cheap and continuous energy to power the rapid development of Western economies, most notably [1]. However, some authors debate whether fossil fuels actually contributed to global development [e.g., 2,3]. Fossil fuels certainly have some
* Corresponding author. Tel.: +90-532-797-0799. E-mail address: [email protected]
© 2019 The Authors. Published by Elsevier Ltd.
This is an open access article under the CC BY-NC-ND license (https://creativecommons.org/licenses/by-nc-nd/4.0/)
Selection and peer-review under responsibility of the 2018 5th International Conference on Power and Energy Systems Engineering, CPESE 2018, 19–21 September 2018, Nagoya, Japan.
Volkan Ş. Ediger et al. / Energy Procedia 156 (2019) 2–6 3 Available online at www.sciencedirect.com
ScienceDirect
Energy Procedia 00 (2018) 000–000
www.elsevier.com/locate/procedia
1876-6102 © 2018 The Authors. Published by Elsevier Ltd.
This is an open access article under the CC BY-NC-ND license (https://creativecommons.org/licenses/by-nc-nd/4.0/)
Selection and peer-review under responsibility of the 2018 5th International Conference on Power and Energy Systems Engineering, CPESE 2018, 19–21 September 2018, Nagoya, Japan.
2018 5th International Conference on Power and Energy Systems Engineering, CPESE 2018,
19–21 September 2018, Nagoya, Japan
An integrated review and analysis of multi-energy transition from
fossil fuels to renewables
Volkan Ş. Ediger
a,*
aKadir Has University, Center for Energy and Sustainable Development (CESD), Cibali, Istanbul 34083, Turkey
Abstract
We are in the midst of a transition from a fossil fuel-dominated energy regime to a more sustainable lower-carbon one in which natural gas is a bridge fuel. Since the 1970s oil crises, however, the forecasts for gas and coal have changed three times. Gas is currently achieving a major position in the world’s energy mix but under challenging geopolitical forces; for this reason, different countries will follow different paths for adopting gas. This article uses a ternary diagram to shows that the fossil fuel consumption paths of the powers have greatly diverged over time. The close relationship between world hegemony and the dominant energy source (coal and then oil) in the past will be replaced by a multi-energy transition in which different countries choose different energy regimes in a multipolar international system.
© 2018 The Authors. Published by Elsevier Ltd.
This is an open access article under the CC BY-NC-ND license (https://creativecommons.org/licenses/by-nc-nd/4.0/)
Selection and peer-review under responsibility of the 2018 5th International Conference on Power and Energy Systems Engineering, CPESE 2018, 19–21 September 2018, Nagoya, Japan.
Keywords: Energy transition; trend reversal; multi-energy transition
1. Introduction
The rate of fossil fuel consumption increased rapidly with the advance of industrialization, providing cheap and continuous energy to power the rapid development of Western economies, most notably [1]. However, some authors debate whether fossil fuels actually contributed to global development [e.g., 2,3]. Fossil fuels certainly have some
* Corresponding author. Tel.: +90-532-797-0799. E-mail address: [email protected]
Available online at www.sciencedirect.com
ScienceDirect
Energy Procedia 00 (2018) 000–000
www.elsevier.com/locate/procedia
1876-6102 © 2018 The Authors. Published by Elsevier Ltd.
This is an open access article under the CC BY-NC-ND license (https://creativecommons.org/licenses/by-nc-nd/4.0/)
Selection and peer-review under responsibility of the 2018 5th International Conference on Power and Energy Systems Engineering, CPESE 2018, 19–21 September 2018, Nagoya, Japan.
2018 5th International Conference on Power and Energy Systems Engineering, CPESE 2018,
19–21 September 2018, Nagoya, Japan
An integrated review and analysis of multi-energy transition from
fossil fuels to renewables
Volkan Ş. Ediger
a,*
aKadir Has University, Center for Energy and Sustainable Development (CESD), Cibali, Istanbul 34083, Turkey
Abstract
We are in the midst of a transition from a fossil fuel-dominated energy regime to a more sustainable lower-carbon one in which natural gas is a bridge fuel. Since the 1970s oil crises, however, the forecasts for gas and coal have changed three times. Gas is currently achieving a major position in the world’s energy mix but under challenging geopolitical forces; for this reason, different countries will follow different paths for adopting gas. This article uses a ternary diagram to shows that the fossil fuel consumption paths of the powers have greatly diverged over time. The close relationship between world hegemony and the dominant energy source (coal and then oil) in the past will be replaced by a multi-energy transition in which different countries choose different energy regimes in a multipolar international system.
© 2018 The Authors. Published by Elsevier Ltd.
This is an open access article under the CC BY-NC-ND license (https://creativecommons.org/licenses/by-nc-nd/4.0/)
Selection and peer-review under responsibility of the 2018 5th International Conference on Power and Energy Systems Engineering, CPESE 2018, 19–21 September 2018, Nagoya, Japan.
Keywords: Energy transition; trend reversal; multi-energy transition
1. Introduction
The rate of fossil fuel consumption increased rapidly with the advance of industrialization, providing cheap and continuous energy to power the rapid development of Western economies, most notably [1]. However, some authors debate whether fossil fuels actually contributed to global development [e.g., 2,3]. Fossil fuels certainly have some
* Corresponding author. Tel.: +90-532-797-0799. E-mail address: [email protected]
Volkan Ş. Ediger / Energy Procedia 00 (2018) 000–000
benefits, such as affordable energy, energy security, employment, foreign exchange, and geopolitical power, as well as some negative one such as environmental degradation, dispossessing of local communities and other human rights violations, concentration of wealth and power, Dutch disease and geopolitical instability [4].
The two biggest fossil fuel-related challenges in the twenty-first century have been environmental degradation and resource scarcity. Environmental concerns include global climate change, environmental externalities, ozone non-attainment, air toxics, solid waste disposal, and others [e.g., 5]. Resource scarcity arises from fossil fuel’s exhaustible nature and uneven distribution in the world [e.g., 6-9]. In addition, energy geopolitics, which has been growing in recent years among the powers, creates further challenges.
At present, the global energy system is 85.5% dependent on fossil fuels, but fossil fuel dependency varies from 32.1% to 100% in different countries. Fossil-fuel dependency is 87.0% in China is among the highest, at 87%, while the U.S. is 85.3%, the EU 75.4%, India 92.5%, Russia 87.1%, and Japan 90.8%. Out of 87 countries, which have production and consumption values in [10], 45 consume more fossil fuels than they produce. The other 42 produce more than they consume. The EU is the largest importer with 926.8 million-tons-of-oil-equivalent, mtoe, with China (645.6 mtoe), Japan (403.6 mtoe), and the U.S. (339.2 mtoe) following. Russia is the largest exporter, with Saudi Arabia (417.7 mtoe), and Australia (268.2 mtoe) thereafter. The high rate of fossil-fuel import dependency, especially of the largest consumers, creates energy-supply security problems. At the same time, the world has considerable reserves of fossil fuels, amounting to 839.7 billion-tons-of-oil-equivalent (btoe) of which 51.4% is coal, 28.6% is oil, and 20.0% is natural gas, and their average R/P ratio is 93.5 yr. compared to coal (152.7 yr.), gas (52.5 yr.), and oil (50.7 yr). The U.S. has the largest reserves (15.5%), followed by Russia (13.4%) and China (7.7%), but 88.7% of fossil fuels in the US, 61.2% in Russia, and 91.2% in China are coal. Therefore, according to the Fossil Fuel Sustainability Index (FFSI), the present fossil fuel-dominated global energy system is unsustainable. [11]
We are currently in a transition from fossil fuel-dominated energy regime to a more sustainable one in which gas is a bridge fuel. Nevertheless, it remains unclear whether gas is a transition fuel or a destination fuel for a sustainable low-carbon global economy as claimed by Jérôme Ferrier, President of the International Gas Union in 2014 [12]. The purpose of this study is, therefore, to evaluate historical patterns and contemporary developments to better understand major aspects of the transition from fossil fuels to renewables. I attempted to discuss specifically the unexpected changes in global energy shift/substitution trends in order to make reasonable prognostications about the future. The paper is structured as follows: Section 2 discusses the relationship between energy transitions and power struggle in history. Section 3 is devoted to the major changes in trends and energy crises. Section 4 reveals fossil fuel use patterns. Finally, Section 5 concludes. Unless otherwise stated, data used in this study is from [10].
2. Energy transitions and power struggle
The fossil fuel era began after 1780, when coal surpassed renewables during the Industrial Revolution and was mined extensively starting in Britain [13]. Britain’s position as the world’s largest coal producer, consumer, and reserve holder during the nineteenth century allowed it to become the global hegemon [14-16]. However, oil immediately started to eclipsed coal in 1859, when modern drilling methods were first applied in the U.S. Oil became the dominant energy source by the 1940s and allowed the United States to become the global hegemon. Though the relationship between global hegemony and the dominant energy source is not firmly established, the global hegemon in the fossil fuel era has always been the largest or one of the largest producers of the dominant energy source and the leader in producing that source’s related technologies– the British with coal from 1815-1873 and the United States with oil from 1945 to the present [14-17].
Gas was viewed as the best alternative for oil at the close of the nineteenth century. Because of some advantages, the use of gas in electricity generation was considered better for the lighting of towns at comparable cost than steam engines. [18]. Unfortunately, gas has long only been used in the local markets, re-injected back into the producing fields to increase pressure, or is flared off [19]. The U.S. was the first country to use gas economically in the 1950s [20]. Gas’ share in the world energy mix rose from less than 1% in 1885 to 28.2% today.
4 Volkan Ş. Ediger / Energy Procedia 00 (2018) 000–000 Volkan Ş. Ediger et al. / Energy Procedia 156 (2019) 2–6
3. Changes in trends during the energy crises
Logistic substitution models suggest that a new energy source and its associated technology enters the market, struggles with the dominating source, and, if sufficiently competent, wins the competition by increasing its market share [21-23]. The new energy source should be better than the previous one in terms of calorific value, environmentally friendly and practicability in use to be able to replace it [16]. This model, which explains the transition from wood to coal and coal to oil, would have predicted that gas would rise became dominant.
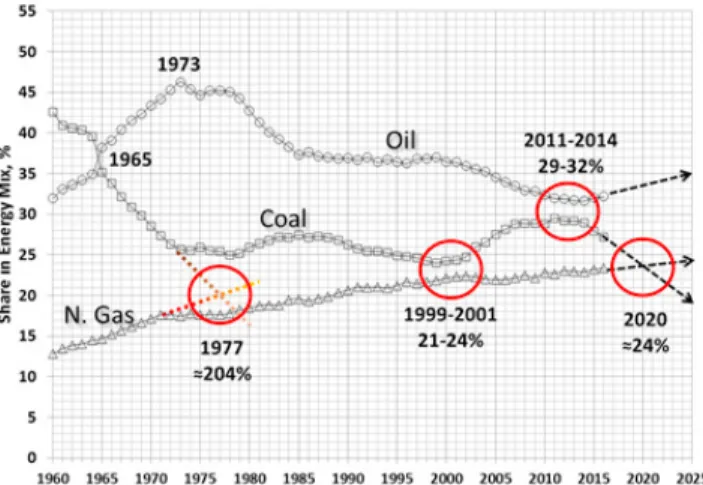
A bidirectional relationship exists between global energy geopolitics and fossil fuels during the periods of major price upheaval in the 1970s and 2000s [16]. They identified two major geostrategic challenges, energy substitution and resource scarcity in these periods. The expected patterns of gas and coal based on past trends have changed three times; the first one during the first crises period of 1973-1986 and the second and third ones during the second crises period of 1998-present (Fig. 1).
Fig. 1. Trend reversals in shares of fossil fuels in world’s energy mix, 1960-2016.
In the first period, gas was expected to continue its rise while coal to continue its rapid decrease before meeting at 20.4% in 1977. Instead, oil’s share peaked in 1973 (46.2%), coal stopped declining after 1974 (25.5%), and gas’s ascent slowed after 1971 (17.6%). During this period, oil’s market share (9.0%) was replaced by nuclear (4.1%), gas (2.0%), coal (1.7%), hydro (1.0%), and renewables (0.1%). High prices and oil-supply security concerns especially in the developed world, drove these changes.
Similarly, during the second crises period since 1998, gas was expected to rise until it cut the coal’s curve at 21-24% to become the second most used energy source after oil sometime from 1999 to 2001. Instead, coal increased and gas decreased. Finally, from 2011 to 2014, coal was expected to increase and cut the decreasing curve of oil at 29-32%, but oil began to increase and coal started to decline. In this phase, oil (-5.7%) and nuclear (-1.7%) were substituted by coal (3.8%), renewables (2.3%), gas (1.1%), and hydro (0.3%). In this period, though the long-term historical trend would have predicted that coal’s share would continue to decline, coal replaced gas.
China has driven this change. Due to increases in coal consumption, oil’s share also decreased from 38.7% to 32.9%, but oil consumption continued to grow on a global scale. Significant decreases in the first crisis period from high oil prices have not been experienced in this period. In other words, high oil prices did not affect oil consumption, primarily due to the developments in unconventional oil and gas. In this period, renewable energy sources other than hydro increased their shares to a much higher value than the previous period from 43.4 mtoe (0.5%) in 1998 to 364.9 mtoe (2.8%) in 2015. On the other hand, while hydro increased in both phases, nuclear grew in the first one and declined in the second. At present, oil and gas are rising whereas coal is declining, and coal curve is expected to decrease until it meets with slightly rising gas curve at around 24% in 2020. This means gas will become the second most used energy source after oil around 2020, if present trends continue.
Volkan Ş. Ediger / Energy Procedia 00 (2018) 000–000
4. Differences in fossil fuel paths
The rise of energy geopolitical competition between the powers during the crisis periods has caused trend reversals in the past. The major dynamics of these periods are: (1) intensification of geopolitical tensions on a global scale, (2) differences between states in terms of energy needs and possession of indigenous supplies, and (3) ambiguity regarding the role of the state and the market at the implementation level [24]. Powers, in other words, will try to solve their energy-security problems using domestic assets, human resources, technology, etc.
The ternary diagram, showing the shares of coal, oil, and gas consumption, displays the divergence of fossil fuel consumption paths between the global powers over time (Fig. 2). The paths of China and Russia are very different from the U.S. and EU. Coal has always been dominant in China, and while its share decreased from 90.5% in 1965 to 71.1% in 2016, oil’s share rose from 8.7% to 21.8%. Gas has always dominant in Russia, and while coal’s share decreased from 26% in 1985 to 14.9% in 2016, gas’s share rose from 41.5% to 59.9%, replacing coal. China will continue to give emphasis on coal while Russian on gas. The renewable energy revolution, which occurred recently in China, will certainly substitute the negative effects of coal with clean renewables. On the other hand, Russia will continue to consume conventional oil and gas.
Fig. 2. Ternary diagram of fossil fuel consumption in selected countries and in the world. World: 1850-2016 while others are 1965-2016 except RF (1985-2016). Data is from [10, 25].
Alternatively, the US and EU are more diversified, and their paths are similar to the world average. The share of fossil fuels in the US has not changed very much over time; coal decreased from 23.5% to 18.5% while oil and gas increased from 44.4% to 44.5% and from 32.0% to 37.0%, respectively, from 1965 to 2016. We expect the U.S. to continue with a diversified energy mix by using science and technology for the development of its fossil fuel resources. Conversely, the EU had a significant transformation to end up with a similar mix; coal decreased from 53.9% to 19.0% while oil and gas rose from 42.4% to 49.6% and from 3.6% to 31.2%, respectively, during the same period. The EU’s high ratio of fossil fuel import dependency, and the current renewable energy revolution mean that it will continue to improve energy efficiency and increase renewable energy usage in the future.
5. Conclusions
Almost everyone agrees that the global economy is unlikely to leave fossil fuels as the dominant energy source and their production will continue to grow for some decades, even if their share decreases [26-27]. It is also obvious that the transition to low carbon economy will only be possible with decarbonisation, which may be made possible by two ways: (1) increasing the share of low-carbon intensity fossil fuel such as gas and, (2) increasing share of renewables. Gas seems unlikely to become dominant under present energy geopolitical circumstances; for this reason, different countries will follow different paths for adopting gas and other energy sources.
Volkan Ş. Ediger et al. / Energy Procedia 156 (2019) 2–6 5
Volkan Ş. Ediger / Energy Procedia 00 (2018) 000–000
3. Changes in trends during the energy crises
Logistic substitution models suggest that a new energy source and its associated technology enters the market, struggles with the dominating source, and, if sufficiently competent, wins the competition by increasing its market share [21-23]. The new energy source should be better than the previous one in terms of calorific value, environmentally friendly and practicability in use to be able to replace it [16]. This model, which explains the transition from wood to coal and coal to oil, would have predicted that gas would rise became dominant.
A bidirectional relationship exists between global energy geopolitics and fossil fuels during the periods of major price upheaval in the 1970s and 2000s [16]. They identified two major geostrategic challenges, energy substitution and resource scarcity in these periods. The expected patterns of gas and coal based on past trends have changed three times; the first one during the first crises period of 1973-1986 and the second and third ones during the second crises period of 1998-present (Fig. 1).
Fig. 1. Trend reversals in shares of fossil fuels in world’s energy mix, 1960-2016.
In the first period, gas was expected to continue its rise while coal to continue its rapid decrease before meeting at 20.4% in 1977. Instead, oil’s share peaked in 1973 (46.2%), coal stopped declining after 1974 (25.5%), and gas’s ascent slowed after 1971 (17.6%). During this period, oil’s market share (9.0%) was replaced by nuclear (4.1%), gas (2.0%), coal (1.7%), hydro (1.0%), and renewables (0.1%). High prices and oil-supply security concerns especially in the developed world, drove these changes.
Similarly, during the second crises period since 1998, gas was expected to rise until it cut the coal’s curve at 21-24% to become the second most used energy source after oil sometime from 1999 to 2001. Instead, coal increased and gas decreased. Finally, from 2011 to 2014, coal was expected to increase and cut the decreasing curve of oil at 29-32%, but oil began to increase and coal started to decline. In this phase, oil (-5.7%) and nuclear (-1.7%) were substituted by coal (3.8%), renewables (2.3%), gas (1.1%), and hydro (0.3%). In this period, though the long-term historical trend would have predicted that coal’s share would continue to decline, coal replaced gas.
China has driven this change. Due to increases in coal consumption, oil’s share also decreased from 38.7% to 32.9%, but oil consumption continued to grow on a global scale. Significant decreases in the first crisis period from high oil prices have not been experienced in this period. In other words, high oil prices did not affect oil consumption, primarily due to the developments in unconventional oil and gas. In this period, renewable energy sources other than hydro increased their shares to a much higher value than the previous period from 43.4 mtoe (0.5%) in 1998 to 364.9 mtoe (2.8%) in 2015. On the other hand, while hydro increased in both phases, nuclear grew in the first one and declined in the second. At present, oil and gas are rising whereas coal is declining, and coal curve is expected to decrease until it meets with slightly rising gas curve at around 24% in 2020. This means gas will become the second most used energy source after oil around 2020, if present trends continue.
Volkan Ş. Ediger / Energy Procedia 00 (2018) 000–000
4. Differences in fossil fuel paths
The rise of energy geopolitical competition between the powers during the crisis periods has caused trend reversals in the past. The major dynamics of these periods are: (1) intensification of geopolitical tensions on a global scale, (2) differences between states in terms of energy needs and possession of indigenous supplies, and (3) ambiguity regarding the role of the state and the market at the implementation level [24]. Powers, in other words, will try to solve their energy-security problems using domestic assets, human resources, technology, etc.
The ternary diagram, showing the shares of coal, oil, and gas consumption, displays the divergence of fossil fuel consumption paths between the global powers over time (Fig. 2). The paths of China and Russia are very different from the U.S. and EU. Coal has always been dominant in China, and while its share decreased from 90.5% in 1965 to 71.1% in 2016, oil’s share rose from 8.7% to 21.8%. Gas has always dominant in Russia, and while coal’s share decreased from 26% in 1985 to 14.9% in 2016, gas’s share rose from 41.5% to 59.9%, replacing coal. China will continue to give emphasis on coal while Russian on gas. The renewable energy revolution, which occurred recently in China, will certainly substitute the negative effects of coal with clean renewables. On the other hand, Russia will continue to consume conventional oil and gas.
Fig. 2. Ternary diagram of fossil fuel consumption in selected countries and in the world. World: 1850-2016 while others are 1965-2016 except RF (1985-2016). Data is from [10, 25].
Alternatively, the US and EU are more diversified, and their paths are similar to the world average. The share of fossil fuels in the US has not changed very much over time; coal decreased from 23.5% to 18.5% while oil and gas increased from 44.4% to 44.5% and from 32.0% to 37.0%, respectively, from 1965 to 2016. We expect the U.S. to continue with a diversified energy mix by using science and technology for the development of its fossil fuel resources. Conversely, the EU had a significant transformation to end up with a similar mix; coal decreased from 53.9% to 19.0% while oil and gas rose from 42.4% to 49.6% and from 3.6% to 31.2%, respectively, during the same period. The EU’s high ratio of fossil fuel import dependency, and the current renewable energy revolution mean that it will continue to improve energy efficiency and increase renewable energy usage in the future.
5. Conclusions
Almost everyone agrees that the global economy is unlikely to leave fossil fuels as the dominant energy source and their production will continue to grow for some decades, even if their share decreases [26-27]. It is also obvious that the transition to low carbon economy will only be possible with decarbonisation, which may be made possible by two ways: (1) increasing the share of low-carbon intensity fossil fuel such as gas and, (2) increasing share of renewables. Gas seems unlikely to become dominant under present energy geopolitical circumstances; for this reason, different countries will follow different paths for adopting gas and other energy sources.
6 Volkan Ş. Ediger / Energy Procedia 00 (2018) 000–000 Volkan Ş. Ediger et al. / Energy Procedia 156 (2019) 2–6
Changes in hegemony and world international system also support this argument. During the last century, the world international system started out as multipolar, evolved first into bipolar during the Cold War, and then into unipolar after the Soviet Union dissolved. Today power is more diffuse, and the system is evolving into a nonpolar [28] or a multipolar [29] world. Whether or not international security, fair development and stability can be achieved best in a multipolar world [30-32] is not within the scope of this study, but we should expect a multi-energy transition in which different countries choose different energy regimes.
In 1983, the conclusion reached at the well-attended conference on Renewable Energy Resources organized by The British Association for the Advancement of Science was: “The future for renewables remains uncertain but the potential for their exploitation, it seems, has now been accepted widely.” [33]. This conclusion appears just as salient today as it was then and will remain so for the foreseeable future.
Acknowledgements
The author would like to thank Dr. John V. Bowlus, Visiting Scientist, Kadir Has University, Center for Energy and Sustainable Development (CESD) for critically editing the manuscript and M. Burak Şuşoğlu, Graduate Student, ESD Master’s Program, for helping in preparation of the figures.
References
[1] Fells I. Fossil fuels, 1850 to 2000. Energy World July-August 1991, 13-16.
[2] Mumford L. Technics and civilization. London: Routledge & Kegan Paul Ltd.; 1934.
[3] Cole SA. Which came first, the fossil or the fuel? Social Studies of Science 1996;26(4):733-766.
[4] Kartha S., Lazarus M, Tempest K. Fossil fuel production in a 2°C world: The equity implications of a diminishing carbon budget. Stockholm: Stockholm Environment Institute, Discussion Brief; 2016.
[5] Godley PF. The state of play and future of fossil fuels. Natural Resources & Environment 1997; 11(3):3-6. [6] Cook E. Limits and exploitation of non-renewable resources. Science 1976;191:677-682.
[7] Mohr SH, Wang J, Ellem G, Ward J, Giurco, D. Projection of world fossil fuels by country. Fuel 2015; 141:120–135. [8] Shafiee S, Topal E. When will fossil fuel reserves be diminished? Energy Policy 2009; 37:181–189.
[9] Abas N, Kalair A, Khan N. Review of fossil fuels and future energy technologies. Futures 2015;69:31–49. [10] BP Statistical Review of World Energy June 2017. http://www.bp.com/statisticalreview.
[11] Ediger VŞ, Hoşgör E, Sürmeli AN, Tatıdil H. Fossil Fuel Sustainability Index: An application of resource management. Energy Policy 2007; 35(5): 2969–2977.
[12] Jérôme Ferrier, President, International Gas Union, Natural gas: The destination fuel for a sustainable low-carbon global economy. The 14th
IEF Ministerial Meeting, 15-16 May 2014, Moscow. https://www.ief.org/events/ief14-ministerial.
[13] Volland CS. Comprehensive theory of long wave cycles. Technological Forecasting and Social Change 1987; 32:123-45.
[14] Modelski G. The long cycle of global politics and the nation-state. Comparative Studies in Society and History 1978; 20(2):214-235. [15] Podobnik B. Global energy shifts: Fostering sustainability in a turbulent age. Philadelphia: Temple University Press, 2006.
[16] Ediger VŞ, Bowlus JV. A farewell to King Coal: Global power and the transition to oil, 1901-17”. The Historical Journal, 2018, In Press. [17] Keohane RO. After hegemony: Cooperation and discord in the world political economy. Princeton, NJ: Princeton University Press; 1984. [187] Hiscox GD. Gas, gasoline and oil vapor engines. 4th edition. New York: Norman W. Henley & Co.; 1901.
[19] Siddayao CN. Is netback value of gas economically efficient? OPEC Review 1997; 21(3):151-189. [20] Samsam Bakhtiari AM, Shahbudaghlou F. OPEC and natural gas. OPEC Review 1998; September: 185-199.
[21] Marchetti C, Nakicenovic N. The dynamics of energy systems and the logistic substitution model. Laxenburg: IIASA; 1978.
[22] Ediger VŞ. Energy transition periods: Lessons learnt from the past. In: The oil era: Emerging challenges. Abu Dhabi: ECSSR (The Emirates Center for Strategic Studies and Research) Publications; 2011, p. 175-202.
[23] Ediger VŞ. New world order in energy and Turkey. In Akademi Forumu No. 67. Ankara: TÜBA-Turkish Academy of Sciences, 62 p., 2011. [24] Ediger VŞ, Berk I. Geostrategic challenges in the oil and gas sectors. In: Dorsman A, Ediger VŞ, Karan MB, editors. Energy economy,
finance and geostrategy. Springer Verlag; 2018, In Press.
[25]Grübler A. Technology and global change. Cambridge University Press; 2003. [26] Lincoln SF. Fossil fuels in the 21st century. Ambio 2005; 34(8):621-627.
[27] Covert T, Greenstone M, Knittel, CR. Will we ever stop using fossil fuels? The Journal of Economic Perspectives 2016;30(1):117-137. [28] Haass RN. The age of nonpolarity: What will follow U.S. dominance. Foreign Affairs 2008; 87(3):44-56.
[29] Väyrynen R. Bipolarity, multipolarity, and domestic political systems. Journal of Peace Research 1995; 32(3):361-371. [30] Waltz KN. Nuclear myths and political realities. The American Political Science Review 1990; 84(3):731-745. [31] Hopf T. Polarity, the offense defence balance, and war. The American Political Science Review 1991; 85(2):475-493. [32] Staack M. The US new world order policy and old Europe. Procedia Social and Behavioral Sciences 2010; 2:7509–7516. [33] Anonymous. Renewable energy resources. Energy Exploration & Exploitation 1983;2(2):171-172.