Scientific paper
Fabrication and Application of a New
Modified Electrochemical Sensor Using Newly
Synthesized Calixarene-Grafted MwCNts for Simultaneous
Determination of Cu(II) and Pb(II)
Semahat Kucukkolbasi,
1,* Serkan Sayin
2and Mustafa Yilmaz
11 Selcuk University, Faculty of Science, Department of Chemistry, 42075 Konya, Turkey
2 Department of Environmental Engineering, Faculty of Engineering, Giresun University, Giresun-28200, Turkey
* Corresponding author: E-mail: [email protected] Tel:+ 903322233857
Received: 12-18-2018
Abstract
A rapid, simple, selective and highly sensitive simultaneous determination of Cu(II) and Pb(II) via newly fashioned 5,11,17,23-tetra-tert-butyl-25,27-dihydrazinamidecarbonylmethoxy-26,28-dihydroxycalix[4]arene-grafted multi-wall-ed carbon nanotubes-modifimulti-wall-ed carbon paste electrode (CNT-Calix/CPE) by differential pulse anodic stripping voltam-metry (DPASV) has been introduced. It was observed that CNT-Calix/CPE exhibits higher selectivity and stability for Cu(II) and Pb(II). Different operational parameters such as pH, deposition potential/time, pulse amplitude (5, −1.0 V vs. Ag/AgCl, 300 s, 2 s, 0.05 V) were also optimized for calculation and statistical evaluation of linear range, detection limit and limit of quantification. Interference study shows that the electrode is highly selective for the simultaneous determi-nation of Cu(II) and Pb(II). Standard addition method was used to apply CNT-Calix/CPE in waste water, plant leaves and soft drinks and it was found that the concentration of Cu(II) and Pb(II) were corresponding to standardized values.
Keywords: Calixarene; MWCNT; modified carbon paste electrode; sensor
1. Introduction
In recent years, attention has been paid by scientists to the heavy metal ion discharge into the environment be-cause of their highly toxic effects for the living organisms even at trace concentrations.1,2 Exposure to the lead, which
is known as one of the most toxic elements, may result in bioaccumulation processes in the hematopoietic, hepatic, renal, and gastrointestinal systems of humans; therefore, it can cause serious toxic effects on human health.3
Anthro-pogenic activities are the main source of lead along with industrial emissions. Particularly water and food samples are highly affected by lead contamination near sources.4
Copper is an essential element in the nutrition of plants and animals, but higher concentrations of copper can cause symptoms of gastroenteritis with nausea, hypercu-premia, vomiting, myalgia, and hemolysis.5
Because heavy metal ions are toxic even at trace con-centrations, they should be present in limited values in
environmental and biological materials. Therefore, rapid, simple, and accurate analytical methods with low detec-tion limits are necessary for the determinadetec-tion of trace level of Pb(II) and Cu(II) in the environment, food, and drinks. A number of qualitative and quantitative methods have been utilized such as atomic absorption spectrome-try (AAS), inductively coupled plasma mass spectromespectrome-try (ICP MS), inductively coupled plasma optical emission spectrometry (ICP OES) and UV-Vis spectrometry.6,7 But
these methods require some time-consuming manipula-tion steps, expensive instruments and special training.8,9
Calixarenes comprising of phenol and formalde-hyde via the poly-condensation reaction display immense fundamental role as receptors of a large variety of molec-ular and ionic guest systems and have the fascinating framework.10–12 In the past few years, various calixarene
derivatives, which were functionalized with cationic, an-ionic, and organic/bimolecular-binding groups, have shown outstanding vehicle properties for the extraction
or recognition of cations, anions, and organic/biomole-cules.13–15
Electrochemical methods, especially anodic strip-ping voltammetry, provide great advantages compared to other techniques due to their high sensitivity and selectiv-ity, good response with saline matrices, high-speed analy-sis, multi-elemental analyanaly-sis, and low-cost.16 During the
simultaneous voltammetric determination of heavy met-als, the hanging mercury drop electrode (HDME) and mercury film electrode (MFE) were used as traditional working electrodes. However, the toxicity of mercury leads to the development of alternative working electrodes. Therefore, mercury-free electrodes such as bismuth film electrode, gold microwire electrode, carbon paste elec-trodes, carbon nanotube elecelec-trodes, and silver electrodes have been developed to determine metal ions.17,18
To improve the electrochemical performance of elec-trodes, chemical or physical modification is carried out by altering their surfaces. Because carbon paste electrodes (CPEs) can be easily modified, renewed, and prepared, they have been widely used as matrices for the preparation of the modified electrodes. Moreover, CPEs provide broad potential usages compared to other modified electrodes,19
and also show relative residual currents 10 times lower than the solid graphite electrode.20 Functionalization of
CNTs with molecules having an affinity toward heavy met-als is a good strategy to accumulate higher amounts of metal ions on the surface and to achieve lower detection limits while using lower accumulation times.21 Nowadays,
carbon nanotubes (CNTs) have also been used in carbon paste electrodes.22,23 CNTs have very interesting
physico-chemical properties, such as ordered structure with high aspect ratio, ultra-light weight, high mechanical strength, high electrical conductivity, high thermal conductivity, metallic or semi-metallic behavior, and high surface area.24
In this work, a new chemically modified carbon paste electrode with calixarene-grafted multi walled carbon nano-tubes (MWCNT) has been prepared for the simultaneous determination of trace amounts of Cu(II) and Pb(II) by dif-ferential pulse anodic stripping voltammetry (DPASV). Such properties caused observing low detection limits in the voltammetric determinations with modified CPEs as a working electrode. It was successfully applied as a selective agent for the voltammetric determination of copper and lead at a carbon paste electrode. The created selectivity in this method makes the electrode very suitable for the detection of trace amounts of these metal ions in various real samples.
2. Materials and Methods
2. 1. General
All starting materials and reagents used were of stan-dard analytical grade from Merck or Aldrich and used with-out further purification. All commercial grade solvents were distilled, and then stored over molecular sieves. Dry THF
was distilled from the ketyl prepared from sodium and ben-zophenone. CH2Cl2 was distilled from CaCl2, while MeOH
was distilled over Mg and stored over molecular sieves. All reactions, unless otherwise noted, were conducted under a nitrogen atmosphere. TLC was performed on DC Alufolien-Kieselgel 60 F254 (Merck). 1H NMR was recorded on a
Vari-an 400 MHz spectrometer. IR spectra were acquired on a Perkin–Elmer 1605 FTIR spectrometer through KBr pellets. All aqueous solutions were prepared with deionized water that was obtained via a Millipore Milli-Q Plus water purifi-cation system and 100/ATR Sampling Accessory. Thermal gravimetric analysis (TGA) was carried out with Seteram thermogravimetric analyzer. The sample mass was 15–17 mg. Analysis was performed from room temperature to 900 °C at a heating rate of 10 °C/min under argon atmosphere with a gas flow rate of 20 mL/min. Elemental analyses were performed using a Leco CHNS-932 analyzer. Melting points were determined on a Gallenkamp apparatus in a sealed capillary glass tube and are uncorrected. Scanning electron microscopy (SEM-JSM 5600) coupled with Energy disper-sive analysis of X-ray (EDX) were used for surface morphol-ogy and identification of elemental composition of samples. Differential pulse anodic stripping voltammeter (DP-ASV) by CHI 600 D was used with conventional three-elec-trode measuring cells: carbon paste electhree-elec-trode (BAS MF 2010) as working electrode, an Ag/AgCI (3 M NaCI) elec-trode (BAS MF 2052), and a platinum wire (BAS MW 1034) as reference and auxiliary electrode, respectively, for the si-multaneous determination of Pb(II) and Cu(II). 0.2 M PBS (Na2HPO4-NaH2PO4) electrolyte showed best
voltammet-ric signals for these metals using carbon paste working elec-trode. To avoid accidental contamination, voltammetric cell was rinsed every day before the measurements with supra pure concentrated HNO3. All measurements were made at
room temperature in solutions deoxygenated with N2 for
300 s and kept under a nitrogen atmosphere during the measurement. Teflon-coated magnetic stirring bar was used for stirring the sample solutions in electrolysis step. pH was measured by Orion 410A + pH meter. CEM-MDS 2000 closed vessel microwave system was used in this study to prepare real and certified samples.
2. 2. Synthesis
The syntheses of compounds 1–3 were carried out according to the procedures in literature.25–27 Carbon
nanotubes (CNTs) were oxidized to afford carboxylic acid functionalized CNTs (CNT-COOH) according to the liter-ature procedure.28 Calixarene-adorned CNT (CNT-Calix)
is herein reported for the first time.
2. 2. 1. Synthesis of p-tert-butylcalix[4] arene-diester (2)
Yield: 14 g (63.4 %); mp: 202–207 oC. FTIR (KBr):
1750 cm–1 (C=O). 1H-NMR (CDCl
1.24 (s, 18H, But), 3.35 (d, 4H, J = 12.6 Hz, Ar-CH 2-Ar),
3.85 (s, 6H, -OCH3), 4.45 (d, 4H, J = 12.6, Ar-CH2-Ar),
4.78 (s, 4H, -OCH2CO), 6.85 (s, 4H, ArH), 7.05 (s, 4H,
ArH), 7.10 (s, 2H, OH). 2. 2. 2. Synthesis of 5,11,17,23-tetra-tert-butyl- 25,27-dihydrazinamidecarbonylmethoxy-26,28-dihydroxy-calix[4]arene (3) Yield: 1.6 g (53.3 %); mp: 330–333 oC. FTIR (KBr): 1687 cm–1 (N–C=O). 1H-NMR (400 MHz, CDCl 3): δ 1.02 (s, 18H, But), 1.26 (s, 18H, But), 2.15 (d, 4H, J = 1.6 Hz, NH2), 3.42 (d, 4H, J = 13.3 Hz, Ar-CH2-Ar), 4.11 (d, 4H, J
= 13.2 Hz, Ar-CH2-Ar), 4.63 (s, 4H, -OCH2), 6.92 (s, 4H,
ArH), 7.10 (s, 4H, ArH), 7.70 (s, 2H, -OH), 9.61 (brs, 2H, NH).
2. 2. 3. Preparation of CNt-Calix
A mixture of CNT-COOH (0.4 g), DCC (0.25 g, 1.21 mmol) and HOBt (0.16 g, 1.21 mmol) in 15 mL of DMF was stirred at room temparature for 15 min. Then, dihydrazine amide derivative of calix[4]arene 3 (0.4 g, 0.50 mmol) was added to the mixture and allowed to stir for further 3 days. The mixture was filtered and washed with CH2Cl2 to remove unbound calixarene derivative 3,
and washed with water to adjust pH 7.0, and the residual solid was then vacuum-dried to yield 0.51 g of
CNt-Ca-lix.
2. 2. 2. Preparation of Unmodified Carbon Paste Electrode (CPE) and Carbon Paste Modified by CNt-Calix/CPE
The unmodified CPE was prepared by mixing fine graphite powder with appropriate amount of paraffin oil and thorough hand mixing in a mortar and pestle (79:21, w/w). The modified CNT-Calix/CPE was prepared by hand-mixing graphite powder 72.5% (w/w) with the CNT-Calix 5.0% (w/w) and then paraffin oil 22.5% (w/w) was mixed thoroughly for approximately 20 min to form the homogeneous modified carbon paste electrodes. Af-terwards, the paste was positioned into the bottom of the working electrode body (BAS MP 5023) and the electrode surface was polished with a weight paper to have a smooth surface. Calibration curves were plotted for each electrode and the optimum composition was obtained by comparing their sensitivities and working ranges. The electrodes were washed with distillated water and working buffer between measurements. Electrodes were stored in refrigerator at +4 °C when not in use.
2. 3. Analytical Procedure
A certain amount of standard or sample solution and 6.0 mL of PBS (pH 5.0) were transferred into the
electrochemical cell and degassed with highly pure nitro-gen gas for at least 5 min. The electrochemical behavior of CNT-Calix was investigated by cyclic voltammetry (CV) in K3Fe(CN)6/K4Fe(CN)6 solution. The analysis of
Cu(II) and Pb(II) using DPASV was carried out in the following steps: (a) deposition step: electrode was held at starting potential of 1.5 V vs. Ag/AgCl in stirred solution for 60 s by applying chronoamperometric method before each measurement to confirm dissolution of the residual deposits on the surface of the modified electrode; (b) the deposition step proceeded at −1.0 V vs. Ag/AgCl in stirred solution for 300 s; at the end of the deposition time, stirring was stopped and a 2 s resting time was al-lowed for the solution to become quiescent; (c) the differ-ential pulse anodic stripping voltammograms were re-corded when swept from −0.8 V to 0.3 V vs. Ag/AgCl. The peak currents at about 0.11 and −0.42 V vs. Ag/AgCl for Cu(II) and Pb(II) were measured, respectively. All measurements were carried out at room temperature. Calibration curve was obtained between net anodic peak currents vs. Cu(II) and Pb(II) concentrations. % recovery was calculated by carrying out the recovery studies with a synthetic sample solution with a wide range of concen-tration. Synthetic binary mixtures sample solutions were prepared from standard solutions and obtained by add-ing varyadd-ing amounts of Pb(II) in a linear concentration range to Cu(II).Various known amounts of Cu(II) and Pb(II) were subsequently analyzed by the proposed elec-trode.
2. 4. Preparation of Real Samples
For the validation, applicability, and reliability of the method, several real samples, including waste water, dried horse chestnut leaf, apple juice, and turnip juice were pre-pared and analyzed by the proposed method. Waste water samples were taken from KOSKI (Konya Water and Sew-erage Administration) without pretreatment before deter-mination. Apple juice, turnip juice were purchased from a local market in Konya, Turkey. The pH of the samples was adjusted before Cu(II) and Pb(II) content determination as described in Section 3.4.
For the determination of Cu(II) and Pb(II) in horse chestnut leaves samples, dried leaf samples were homoge-nized in a blender and one gram of homogenate was di-gested by microwave digestion system. CEM-MDS 2000 closed vessel microwave system (maximum pressure 800 psi, maximum temperature 220 °C) was used. Digestion conditions for microwave system for the samples were ap-plied as 2 min for 250 W, 2 min for 0 W, 6 min for 250 W, 5 min for 400 W, 8 min for 550 W and ventilation for 8 min. After digestion, the residues were diluted to 25 mL with deionized water.
The measurements were evaluated according to Ap-ple Leaves standards 1515 which were provided by the High-Purity Standards, NIST.
3. Results and Discussion
3. 1. Preparation of Calixarene-Grafted
MwCNt
In this study, p-tert-butylcalix[4]arene 1 has been used as the starting compound, which was synthesized according to the literature.24 p-tert-Butylcalix[4]arene 1
was functionalized with methylbromoacetate in the pres-ence of K2CO3 to afford di-ester derivative 2.26 Di-ester
derivative 2 was then treated with hydrazine under suit-able reaction conditions following the literature to obtain dihydrazine amide derivative of calix[4]arene 3 with free primary amine groups.27 Synthesized dihydrazine amide
derivative 3 was grafted onto carbon nanotubes contain-ing COOH groups, which oxidized with HNO3/H2SO4
according to the literature28 in order to investigate
bind-ing efficiencies of CNT-Calix towards Cu(II) and Pb(II), which is reported for the first time in this article (Scheme
1). Characterization of CNT-Calix was assessed by a
combination of FTIR, SEM, TGA and elemental analysis techniques.
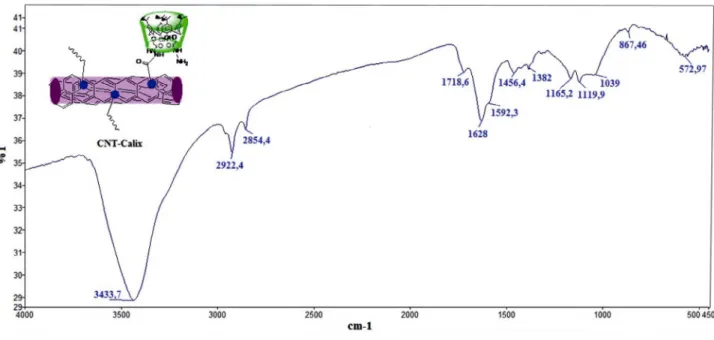
FTIR spectroscopy was used to elaborate on the structure of CNT-Calix. Carbon nanotubes with COOH (CNT-COOH) have a characteristic peak at 1700 cm–1
as-sociated with the carboxylic groups and also provide the absorbance at around 1100 cm–1 corresponding to the
oth-er side-groups. On the CNT-Calix curve, the introduction of dihydrazine amide derivative of calix[4]arene 3 is as-signed to three different carbonyl peaks which appeared at 1718 cm–1 indicating unbinding COOH unit with calix[4]
arene derivative 3, 1628 and 1592 cm–1 associated with the
transformation of the carboxylic group to an amide group. In addition, the peaks at 1456 and 1382 cm–1 are attributed
to the bending vibration of the aromatic C-C bonds of the calix[4]arene derivative (Fig. 1).
The thermogravimetric analysis (TGA) was used to estimate the amount of dihydrazine amide derivative of calix[4]arene 3 onto CNT-COOH. As depicted in Fig. 2, the TGA curve of CNT-Calix reveals that the weight loss of 28.4% mass was due to decomposition of dihydrazine am-ide derivative of calix[4]arene 3 and unbound CNT-COOH[27] at the range of 200–750 oC.
To obtain more direct information about the amount of loaded dihydrazine amide derivative of ca-lix[4]arene 3 on CNT-COOH, the elemental analysis was evaluated. The results show that CNT-Calix contains 3.59% nitrogen corresponding to 10.27 mmol of Calix/g of CNT (table 1).
Scheme 1. The synthetic route for the calixarene-functionalized carbon nanotubes (CNt-Calix). Reaction conditions: (i) Methyl bromoacetate, K2CO3, CH3CN (ii) Hydrazine, CH2Cl2/CH3OH; (iii) HNO3, H2SO4; (iv) DCC, HOBt, DMF.
3. 2. Characterization of Carbon Paste
Electrode
SEM
Scanning electron microscopy (SEM) was used to characterize the morphology of the bare carbon paste elec-trode and carbon paste elecelec-trode modified with CNT-Calix. Fig. 3A represents the SEM morphology of the prepared electrode. Fig. 3A shows the SEM images of the bare carbon
Fig. 1. FTIR spectra of CNT-Calix
Fig. 2. TGA curve of CNT-Calix
table 1. Elemental analysis results of CNT-Calix
C(%) H(%) N(%) Bound amount
(mmol/g)a
CNt-Calix 75.18 3.84 3.59 10.27
a Calculated according to the nitrogen content.
paste electrode and carbon paste electrode modified with CNT-Calix. The SEM image of the bare carbon paste elec-trode displayed a microstructure with a discontinuous grain growth with a large unclear crystal structure and graphite particles covered by a very thin film of paraffin wax, while at the surface of CPE, the layer of irregular flakes of graphite powder was present and isolated with each other.
Fig. 3B shows that the surface of the carbon paste
electrode was modified with CNT-Calix. By addition of CNT-Calix to the carbon paste, most of the MWCNTs were in the form of small bundles or single tubes. It can be seen that MWCNTs were distributed on the surface of the electrode with special three-dimensional structures.29
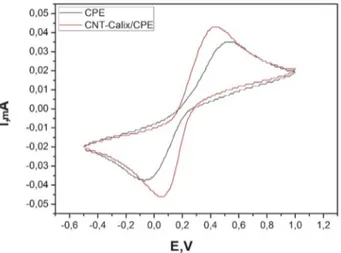
Cyclic Voltammetry
0.20 mol L−1 PBS solution containing 0.05 M
K3Fe(CN)6 + 0.05 M K4Fe(CN)6 was selected as a probe to
evaluate the performance of the bare CPE and CNT-Ca-lix/CPE electrodes. Fig.4 shows cyclic voltammetry ob-tained with the bare CPE (dotted line) and Calix-arene-grafted Multi-Walled Carbon Nanotubes CPE (solid line) electrodes. The CNT-Calix-CPE electrode exhibits the highest activity towards K4[Fe(CN)6] /
K3[Fe(CN)6] redox reactions as promising
electrocatalyt-ic materials. It was observed that the peak current of CNT-Calix/CPE greatly increased together with an obvi-ous decrease of ΔEp, behaving as a quasi-reversible tron transfer process. With the CNT-Calix/CPE elec-trode, the peak currents are significantly increased compared to the bare carbon paste systems. So we can say
3. 3. Electrochemical Behaviors of Pb(II)
and Cu(II) on the Modified Electrode
The performance of the newly modified carbon paste electrode is based on the deposition of Cu(II) and Pb(II) from aqueous solution onto the surface of the modified electrode by forming complexes with the modifier. The electrochemical performance of the metal ion on the car-bon paste electrode modified with CNT-Calix was ex-plored with respect to the effect on the stripping parame-ter. Lastly, a calibration curve was plotted and under optimized parameters the recovery of lead and copper ions using the modified carbon paste electrode evaluated.
The possible steps are expained below with the opti-mized experimental values, the likely phases are clarified (“aqueous” or “surface” subscript means the compound is in aqueous solution or on the electrode surface, respectively):
Deposition of M(II)30
M2+
(aqueous) + (CNT-Calix) (surface)→
[M2+− (CNT-Calix)] (surface)
Reduction of accumulated M(II) in PBS [M2+− (CNT-Calix)]
(surface) + 2e–→
[M0− (CNT-Calix)]
(surface)( at −1,0 V)
Stripping of reduced M(II) in PBS [M0−(CNT-Calix)]
(surface)→ M2+(aqueous)
+ (CNT-Calix)(surface) + 2e– (scan from −1.0 to +0.0 V)
3. 4. Effect of Parameters
Different parameters such as supporting electrolyte, pH, deposition potential, deposition time, stirring rate, and the amount of modifier for a 1.0 × 10⁻⁶ mol L−1 Cu(II)
and 5.0 × 10⁻⁶ mol L−1 Pb(II) solution were studied in
or-der to obtain the optimum experimental conditions. Trials to set up the optimum conditions for the simultaneous de-termination of the two elements were as follows.
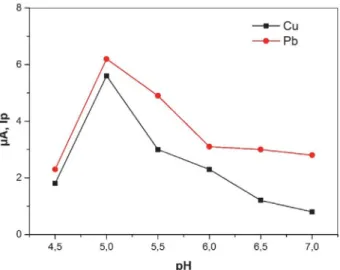
3. 4. 1. Effect of Supporting Electrolyte and pH
The influences of different types of supporting elec-trolytes including phosphate buffer (PBS), Britton–Robin-son (BR) buffer, KNO3, HCl, and acetate buffer were
inves-tigated. Higher anodic peak currents, better defined peak shapes and the best sensitivity were observed utilizing 0.20 mol L−1 PBS. The lowest background current, the highest
and well-shaped voltammetric peaks were obtained in PBS during the recording of voltammetric peaks in different electrolytes Fig. 5 shows the voltammetric behavior of modified carbon paste electrode at different pH values. Higher current values were obtained at pH 5.0 for both Pb(II) and Cu(II) ions. It is obvious that the two peaks are distinct and far enough to serve as the basis for quantita-tive analysis of Pb(II) and Cu(II). When the pH value was below 5.0, the ligand can strictly be protonated, and slowly
Fig. 4. Cyclic voltammograms of CPE and CNT-Calix at 100 mV s‒1, in 0.20 mol L−1 PBS solution containing 0.05 M K
3Fe(CN)6/
K4Fe(CN)6 (1:1, pH = 5.0) solution.
that the CNT-Calix/CPE electrode can accelerate elec-tron transfer for 0.05 M K3[Fe(CN)6] redox probe as
compared to CPE electrode. In other words, the prepared electrode has the advantages of high electrical conductiv-ity and high resistance to interferences compared to un-modified CPE.
dissolve in acidic solution because of the free amine group of calixarene 3 with CNT-COOH, and lose its complex-ability towards Pb(II) and Cu(II) ions. At pH higher than 5.0, the decrease in the anodic peak current may be due to the hydrolysis of cations.31
3. 4. 2. Effect of Electrode Composition
The use of CNT-Calix as a modifier can greatly im-prove the sensitivity and selectivity of determinations. The effect of the amount of CNT-Calix within carbon paste electrode on the DPASV in PBS of pH 5.0 and deposition time of 300 s was investigated. As Fig. 6 showed that the
stripping peak current intensities of the two metal ions were increased by increasing the amount of modifier. At 5.0% (w/w) of the modifier, the largest peak current was obtained and decreased at higher amounts. When the amount of CNT-Calix was more than 5.0% (w/w), the peak currents decreased dramatically since excessive modifier may result in a decrease in the conductivity of the elec-trode. Therefore the best carbon paste composition of 5.0% (w/w) CNT-Calix, 72.5% (w/w) graphite powder and 22.5% (w/w) paraffin oil was used for all experiments.
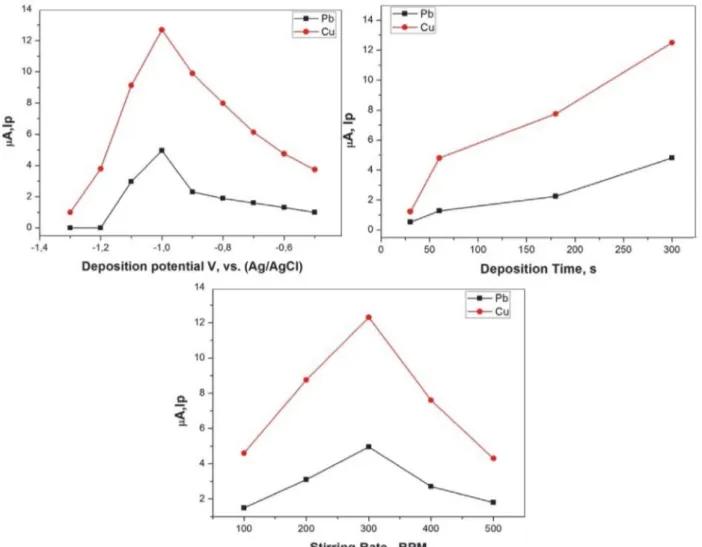
3. 4. 3. Effect of Deposition Potential, Deposition time and Stirring Rate
The effects of deposition potential and time on the peak currents were examined to optimize the sensitivity and selectivity. Fig. 7 shows variation of peak current with the deposition potential between –1.3 to –0.50 V with an increment of 0.10 V, recorded as DPASV voltammogram. In the range of –1.30 to –1.20 V the peak currents for Pb(II) and Cu(II) are low and sudden increase in range of –1.20 V to –1.00 V and –1.00 V deposition potential was selected as optimum deposition potential.
Pb(II) and Cu(II) determination can be actually af-fected by deposition time. An increase in deposition time in the range of 0–15 min resulted in an increase in strip-ping peak current with an increase in the amount of re-duced Pb(II) and Cu(II) on the surface of the modified electrode. With further increases in deposition time, the peak current flattened out, as the active points on the sur-face of the modified electrode were completely covered by reduced Pb(II) and Cu(II). Taking into account both sen-sitivity and efficiency, deposition time was set at 5 min in the following experiments.
3. 5.Analytical Characteristics
The differential pulse anodic stripping voltammo-grams at different concentrations of Pb(II) and Cu(II) un-der optimum conditions are shown in Fig. 8. The peak currents increase linearly with Pb(II) and Cu(II) concen-tration over the range of 0.1–1.6 µg L–1..The characteristics
of the calibration graphs are given in table 2. The limits of detection (LOD) and quantification (LOQ) under the present optimized conditions were calculated by Equation (A.1) and Equation. (A.2), respectively, where δ is the stan-dard deviation (8 replicate determinations of the blank signals) of blank and s is the slope of calibration curve.31
(1)
(2)
The lowest qualitative and quantitative concentra-tions (LOD and LOQ) of the tested range of linearity were
Fig. 5. Effect of pH on the stripping peak current for a solution con-taining 0.20 mol L−1 PBS, 1.0 × 10⁻⁶ mol L−1 Cu(II) and 5.0 × 10⁻⁶
mol L−1 Pb(II); deposition potential: −1.0 V vs. Ag/AgCl,
deposi-tion time: 300 s, resting time: 2 s, stirring rate: 300 rpm, scan rate: 0.10 V s−1.
Fig. 6. Effect of amount of modifier on the stripping peak current for a solution containing 0.20 mol L−1 PBS (pH = 5), 1.0 × 10⁻⁶ mol
L−1 Cu(II) and 1.0 × 10⁻⁶ mol L−1 Pb(II); deposition potential: −1.0
V vs. Ag/AgCl, deposition time: 300 s, resting time: 2 s, stirring rate: 300 rpm, scan rate: 0.1 V s−1.
calculated for Pb(II): 0.061 and 0.18 µg L–1, and for Cu(II):
0.096 and 0.29 µg L–1, respectively.
Fig. 7. Effect of deposition potential, deposition time, and stirring rate on the stripping peak current for a solution containing 0.20 mol L−1 PBS (pH
= 5), 1.0 × 10⁻⁶ mol L−1 Cu(II) and 1.0 × 10⁻⁶ mol L−1 Pb(II); scan rate: 0.1 V s−1.
Fig. 8. DPSAV curves of different concentrations of Pb(II) and Cu(II) (a-i, 0.1, 0.2, 0.4, 0.6, 0.8, 1.0, 1.2, 1.4, 1.6 µg L–1) at
CNT-Ca-lix/CPE in 0.20 M PBS pH 5.0 buffer solution. deposition potential: ‒1.0 V; deposition time: 300 s; pulse amplitude: 0.05 V; pulse width: 0.2 s; scan rate: 0.1 V s‒1.
3. 6. Accuracy and Precision
Accuracy and precision of the described DPASV method for simultaneous determination of Pb(II) and Cu(II) at the modified carbon paste electrode (CNT-Calix/ CPE) were calculated as recoveries (R%) and standard
de-table 2. Analytical parameters for calibration curves of Cu(II) and Pb(II) obtained with DPASV method. The values of the slopes and intercepts were calculated with a confidence interval of 95%. Num-ber of points in the calibration curves was 9.
Parameter Cu(II) Pb(II)
Linear range (µg L–1) 0.1–1.6 0.1–1.6
Equation y = a + bx y = a + bx Slope (µA L µg–1) 7.41 ± 0.22 4.00 ± 0.08
Intercept point (µA) –1.05 ± 0.21 –0.11 ± 0.07 Regression coefficient (R2) 0.99265 0.99697
LOD (µg L–1) 0.096 0.061
LOQ (µg L–1) 0.29 0.18
Repeatibility (t*s√2) 0,17 0,28
viation (SD%) by analyzing laboratory-made mixtures prepared with reference standard solutions of each of the investigated metal ions for four replicate times. Syntheti-cally prepared mixtures were prepared as follows: Two dif-ferent series of stock solutions were prepared from stan-dard solutions. In one of the prepared series, Cu(II) is added in a constant amount of Pb(II) in a linear concen-tration range. In the other series prepared, synthetic bina-ry mixtures were obtained by adding Pb(II) in a linear concentration range in varying amounts to Cu(II). Mean percentage recoveries of lead and copper from different synthetic samples and standard deviations were obtained by applying standard addition methods and are given in
table 3 and table 4. Recoveries (%) are constantly
in-creased for Pb concentration in table 3 and Cu concentra-tion, in table 4. This is the consequence of added (in-creased concentration of) Cu and Pb, respectively. These increases are acceptable in the confidence limit of 95%.
analysis of prepared samples. An example voltammogram for chestnut leaves sample are shown in Fig. 9. The results listed in table 5 indicate that no matrix effect was ob-served.
table 4. Results of Cu recoveries obtained with DPASV method in laboratory-made synthetic samples
Cu Pb Sample taken (ng/L) (ng/L) Found Recovery (%) Added (ng/L)
1 600 598 99.7 150 2 600 602 100.3 300 3 600 604 100.7 450 4 600 610 101.7 600 MEAN: 100.6 SD: 0.8
table 3. Results of Pb recoveries obtained with DPASV method in laboratory-made synthetic samples
Pb Cu Sample taken (ng/L) Found (ng/L) Recovery (%) Added (ng/L)
1 600 586 97,6 150 2 600 587 97,8 300 3 600 592 98,7 450 4 600 602 100,5 600 MEAN: 98,6 SD: 1.2
3. 7. Application to Real Samples
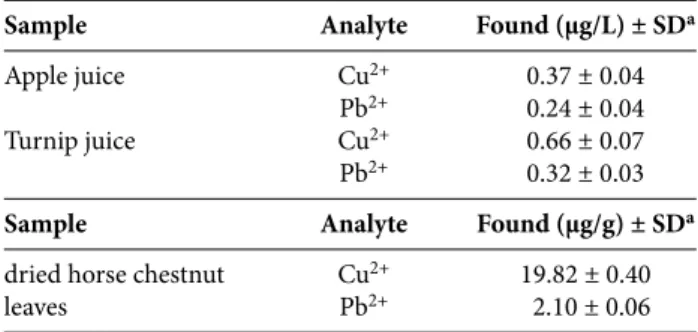
The applicability efficiency of the DPASV method combined with CNT-Calix/CPE for the analysis of real samples with different matrices was assessed by its applica-tion to the simultaneous determinaapplica-tion of Pb(II) and Cu(II) ions in various real samples including wastewater, dried horse chestnut leaves, apple juice, and turnip juice samples. The standard addition method was used for the
Fig. 9. DPSAV curves of blank solution (a), real sample without addi-tion of Pb(II) and Cu(II) (b) and after additiaddi-tion of different concen-trations of Pb(II) and Cu(II) (c–f) at CNT-Calix/CPE in 0.20 M PBS pH 5.0 buffer solution. Deposition potential: ‒1.0 V; deposition time: 300 s; pulse amplitude: 0.05 V; pulse width: 0.2 s; scan rate: 0.1 V s‒1.
3. 8. Applications to the SRM
The accuracy of the proposed method was verified with the analysis of the NIST SRM Apple Leaves standards 1515 after microwave digestion. The reference leave sam-ple was analyzed according to the recommended proce-dure after the appropriate dilution. The Pb(II) and Cu(II) concentrations in this leave sample were 0.469±0.022 μg g–1 and 5.85±0.20 μg g–1 with the developed method,
re-spectively. F test was applied for comparison in which cal-culated F values were compared with F critic value. F val-ues for Pb and Cu (0.012 and 1.2) are less than the critical F value (6.39) where n1 = 4 and n2 = 4 at 95% confidence
level. Furthermore, t-test was carried out and the t values found were smaller than the theoretical t value (2.78) in the confidence limit of 95%. A good agreement with the certified values was achieved (table 6).
table 5. Simultaneous determination of metal ions in several real samples by the proposed method (n = 5).
Sample Analyte Found (µg/L) ± SDa
Apple juice Cu2+ 0.37 ± 0.04
Pb2+ 0.24 ± 0.04
Turnip juice Cu2+ 0.66 ± 0.07
Pb2+ 0.32 ± 0.03
Sample Analyte Found (µg/g) ± SDa
dried horse chestnut Cu2+ 19.82 ± 0.40
leaves Pb2+ 2.10 ± 0.06
4. Conclusion
In the present study, we synthesized p-tert-butylca-lix[4]arene dihydrazine amide derivative and grafted onto COOH groups-modified carbon nanotube. The structure of all synthesized compounds was characterized using FTIR, NMR, TGA, and elemental analysis techniques. The calix-arene-grafted carbon nanotube was used as a new material in the preparation of carbon paste-modified electrode. The surface morphology of the modified electrode was assessed by the Scanning Electron Microscopy (SEM) technique. The novel carbon paste modified electrode was employed as an efficient vehicle to determine selectively Pb(II) and Cu(II) ions in both synthetic and real samples. It was found that the modified electrode showed an excellent selectivity and stability for these metals determinations and for accel-erated electron transfer between the electrode and the ana-lyte. Regarding high sensitivity and selectivity, and very low detection limits together with the ease of preparation and surface regeneration of the modified electrode makes the proposed modified electrode a good alternative method.
The results reveal that the selectivity and sensitivity of the modified carbon paste electrode with calix-arene-grafted MWCNT towards Cu(II) and Pb(II) were high. These findings clearly address that the calixarene, which is grafted on CNT by means of chemical bonding, is capable of the selectivity and sensitivity in the determina-tion of these metal ions due to well-known complexability of calixarenes including host-guest, self-assembly, and co-ordination-complementary properties, which depends upon the modified unit over the calixarene such as free amine, carboxylic acid, amide, etc. The obtained results agree well with those of SRM. These made the system promising to be used in routine analytical applications.
Conflicts of interest
There are no conflicts to declare.
Acknowledgement
The authors are grateful for kind financial support provided by Selcuk University Coordination Scientific Re-search Projects SU-BAP and 13401121.
5. References
1. B. B. Rodriguez, J. A. Bolbot and I. E. Tothill, Biosensors and
Bioelectronics 2004, 19, 1157–1167.
DOI:10.1016/j.bios.2003.11.002
2. C. Zhao, H. Liu and L. Wang, Analytical Methods 2012, 4, 3586–3592. DOI:10.1039/c2ay25525a
3. A. Afkhami, M. Saber-Tehrani and H. Bagheri, Journal of
Hazardous Materials 2010, 181, 836–844.
DOI:10.1016/j.jhazmat.2010.05.089
4. A. M. Beltagi, E. M. Ghoneim and M. M. Ghoneim,
Inter-national Journal of Environmental Analytical Chemistry 2011, 91, 17–32. DOI:10.1080/03067310902962577
5. K. Leopold, M. Foulkes and P. J. Worsfold, Trac-Trends in
Analytical Chemistry 2009, 28, 426–435.
DOI:10.1016/j.trac.2009.02.004
6. P. Bermejo-Barrera, M. A. Nancy, D. L. Cristina and B. B. Adela, Microchimica Acta 2003, 142, 101–108.
7. L. Ebdon, Evans, E. H., Fisherondo, A., Hill, S. F., An Intro-duction to Analytical Atomic Spectrometry, Wiley, Cheches-ter, U.K, 1998.
8. T. Oymak, Ş. Tokalıoğlu, V. Yılmaz, Ş. Kartal and D. Aydın,
Food Chemistry 2009, 113, 1314–1317.
DOI:10.1016/j.foodchem.2008.08.064
9. A. Afkhami, F. Soltani-Felehgari, T. Madrakian, H. Ghaedi and M. Rezaeivala, Analytica Chimica Acta 2013, 771, 21–30. DOI:10.1016/j.aca.2013.02.031
10. E. Macerata, F. Castiglione, W. Panzeri, M. Mariani, F. San-sone, A. Casnati and A. Mele, New Journal of Chemistry 2010,
34, 2552–2557. DOI:10.1039/c0nj00269k
11. C. D. Gutsche, Book Calixarenes Revitised, Cambridge, 1998. 12. R. Joseph and C. P. Rao, Chemical Reviews 2011, 111, 4658–
4702. DOI:10.1021/cr1004524
13. S. Sayin, M. Yilmaz and M. Tavasli, Tetrahedron 2011, 67, 3743–3753. DOI:10.1016/j.tet.2011.03.012
14. S. Sayin and M. Yilmaz, Journal of Chemical & Engineering
Data 2011, 56, 2020–2029. DOI:10.1021/je1010328
15. E. Akceylan and M. Yilmaz, Tetrahedron 2011, 67, 6240–6245. DOI:10.1016/j.tet.2011.06.050
16. J. Barek, A. G. Fogg, A. Muck and J. Zima, Critical Reviews in
Analytical Chemistry 2001, 31, 291–309.
DOI:10.1080/20014091076776
17. A. Afkhami, T. Madrakian, H. Ghaedi and H. Khanmoham-madi, Electrochimica Acta 2012, 66, 255–264.
DOI:10.1016/j.electacta.2012.01.089
18. S. Vasanthi, M. Devendiran and S. S. Narayanan, Applied
Sur-face Science 2017, 422, 138–146.
DOI:10.1016/j.apsusc.2017.05.153
19. A. Afkhami, T. Madrakian, S. J. Sabounchei, M. Rezaei, S. Samiee and M. Pourshahbaz, Sensors and Actuators B:
Chem-ical 2012, 161, 542–548.
DOI:10.1016/j.snb.2011.10.073
20. M. H. Mashhadizadeh and M. Akbarian, Talanta 2009, 78, 1440–1445. DOI:10.1016/j.talanta.2009.02.040
21. G. Aragay and A. Merkoçi, Electrochimica Acta 2012, 84, 49– 61. DOI:10.1016/j.electacta.2012.04.044
table 6. Analytical results of Pb(II) anb Cu(II) determination in Certified Reference Material of Spiked Natural Leave Samples with the proposed method (n = 4)
NISt SRM 1515 Apple leaves ( μg g–1)
Leave Sample Certified value Our Valuea texpb
Cu(μg g–1) 5.64±0.24 5.85±0.20 0.42
Pb(μg g–1) 0.47±0.02 0.47±0.02 0.01
a Average of 4 determinations. b t
22. B. Rezaei and S. Damiri, IEEE Sensors Journal 2008, 8, 1523– 1529. DOI:10.1109/JSEN.2008.923585
23. M. Siswana, K. Ozoemena and T. Nyokong, Sensors 2008, 8, 5096. DOI:10.3390/s8085096
24. P. M. Ajayan, Chemical Reviews 1999, 99, 1787–1800. DOI:10.1021/cr970102g
25. C. D. Gutsche and K. C. Nam, Journal of the American
Chem-ical Society 1988, 110, 6153–6162. DOI:10.1021/ja00226a034
26. E. M. Collins, M. A. McKervey, E. Madigan, M. B. Moran, M. Owens, G. Ferguson and S. J. Harris, Journal of the Chemical
Society, Perkin Transactions 1 1991, 3137–3142.
DOI:10.1039/p19910003137
27. E. A. Alekseeva, V. A. Bacherikov and A. I. Gren, Russian
Journal of General Chemistry 2000, 70, 490–491.
28. T. Zhang, M. Xu, L. He, K. Xi, M. Gu and Z. Jiang, Carbon
2008, 46, 1782–1791. DOI:10.1016/j.carbon.2008.07.033
29. A. Afkhami, H. Ghaedi, T. Madrakian and M. Rezaeivala,
Electrochimica Acta 2013, 89, 377–386.
DOI:10.1016/j.electacta.2012.11.050
30. S. Kucukkolbasi, Z. O. Erdogan, J. Barek, M. Sahin and N. Kocak, International Journal of Electrochemical Science 2013,
8, 2164–2181.
31. N. Kocak, M. Sahin, S. Kücükkolbasi and Z. O. Erdogan,
International Journal of Biological Macromolecules 2012, 51,
1159–1166. DOI:10.1016/j.ijbiomac.2012.09.003
Povzetek
Predstavljamo hitro, preprosto, selektivno in visoko občutljivo hkratno določitev Cu(II) in Pb(II) z novo narejeno ele-ktrodo iz ogljikove paste, modificirane z 5,11,17,23-tetra-terc-butil-25,27-dihidrazinamidkarbonilmetoksi-26,28-dihi-droksikaliks[4]arenom na večstenskih ogljikovih nanocevkah (CNT-Calix/CPE) ob uporabi diferencialne pulzne anodne inverzne voltametrije (DPASV). CNT-Calix/CPE kaže večjo selektivnost in stabilnost za Cu(II) in Pb(II). Optimizirali smo različne delovne pogoje, kot so pH, potencial in čas depozicije, amplituda pulza (5, −1,0 V vs. Ag/AgCl, 300 s, 2 s, 0,05 V) ter izračunali in statistično ovrednotili linearno območje, meje zaznave in kvantifikacije. Interferenčna študija kaže, da je elektroda visoko selektivna za hkratno določitev Cu(II) in Pb(II). S pomočjo metode standardnega dodatka smo CNT-Calix/CPE uporabili za odpadno vodo, rastlinske liste in brezalkoholne pijače ter določili koncentracije Cu(II) in Pb(II), ki se skladajo s standardnimi vrednostmi.
Except when otherwise noted, articles in this journal are published under the terms and conditions of the Creative Commons Attribution 4.0 International License