THE RELATIONSHIP BETWEEN STOCK PERFORMANCE
AND THE EFFICIENCY IN TURKISH BANKING SECTOR
TÜRK BANKACILIK SEKTÖRÜNDE HİSSE SENEDİ PERFORMANSI VEETKİNLİK ARASINDAKİ İLİŞKİ
Hakan AYGÖREN
(1), M. Ensar YEŞİLYURT
(2),
Bülent GÜLOĞLU
(3), İlhan KÜÇÜKKAPLAN
(4) (1) Pamukkale University, Department of Business Administration(2) Pamukkale University, Department of Economics (3) ITU, Faculty of Management, Department of Economics
(4) Pamukkale University, Department of International Trade and Finance (1) [email protected]; (2) [email protected]; (3) [email protected];
ABSTRACT: This study aims to investigate the relationship between efficiency and
the stock performance of the banking sector in Turkey. Efficiency analysis is conducted via Stochastic Frontier Analysis (SFA). Subsequently, the market-to-book value as a measure of stock performance is regressed against the percentage change in efficiency using panel data analysis. SFA shows that the concentration ratios and capital adequacy ratio have a positive effect on the efficiency of stocks, whereas the number of employees per unit of branches and age influence stocks negatively. The results also show that investors perceive efficiency to be a significant factor in terms of stock performance.
Key Words: Efficiency; Banking Sector; Stochastic Frontier (SFA); Stock
Performance; Panel Data
JEL Classifications: G14; G21; C33
ÖZET: Bu çalışma Türkiye’deki bankacılık sektöründeki hisse senedi performansı ve etkinlik arasındaki ilişkiyi analiz etmektir. Etkinlik analizleri Stokastik Frontier Analizi (SFA) ile gerçekleştirilmiştir. Daha sonra bir hisse senedi performans ölçümü olarak piyasa defter değeri, panel veri analizleri kullanılarak etkinliğin oransal değişimiyle regresyona tabi tutulmuştur. SFA, şube başına çalışan sayısı ve banka yaşı hisse senetlerinin etkinlikleri üzerinde negatif yoğunlaşma oranı ve sermaye yeterlilik oranı pozitif bir etkiye sahip olduğunu göstermiştir. Sonuçlar aynı zamanda hisse senedi performansını değerlendirirken bankaların etkinlik seviyesini anlamlı bir faktör olarak dikkate aldıklarını göstermiştir.
Anahtar Kelimeler: Etkinlik; Bankacılık Sektörü; Stokastik Frontier Analizi (SFA); Hisse Senedi Performansı; Panel Veri
1. Introduction
The role of financial markets and institutions is to contribute to the prosperity and economic growth of a society by eliminating the market frictions that prevent the direct channeling of savings into profitable projects. A well developed financial system contributes to higher production and efficiency in the overall economy via steady and relatively inexpensive flow of funds from savers to final users or investors (Fabbozzi, Modigliani and Ferri, 1994). Such a financial system acquires and processes information about economic entities and investment projects, allocates the savings of the society to most productive and profitable investments, implements the
monitoring process for investors, aims at diversification in order to reduce risks, and facilitates the exchange of goods and services through the payment services. The purpose of this study is to analyze the link between accounting information as well as efficiency as a new measure and stock earnings of banks. It is reasonable to focus on efficiency of banks as an additional measure because efficiency is directly related to profitability of banks.
The structure of the study is as follows: next section briefly describes the banking sector in Turkey. The third section involves literature survey. The fourth section explains data set, the design of the research, and the methodological approach. The fifth section presents empirical results of the analysis. The final section is the conclusion remarks of the study.
2. Banking Sector in Turkey
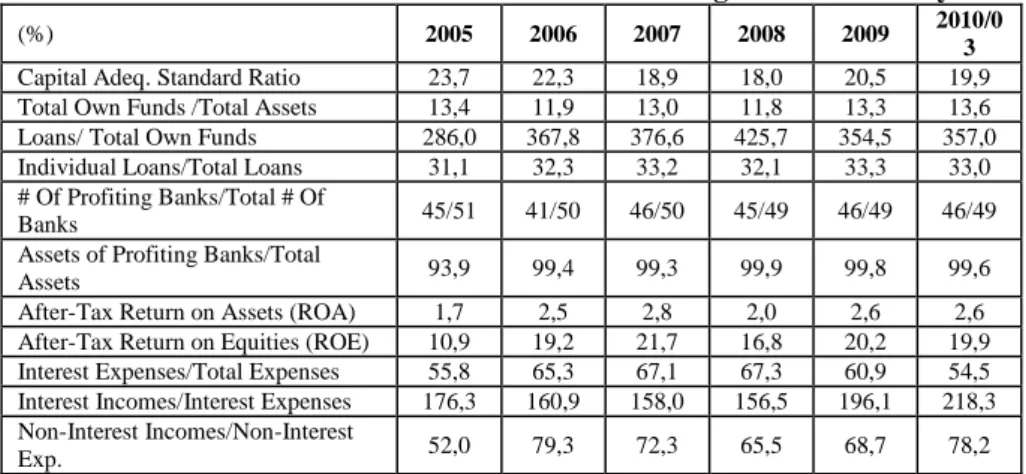
After the 2001 economic crises, banking sector in Turkey has faced tight regulations and transformation of the banking sector is being carried on. Table 1 presents data for banking services for the period 2005-2010. As of 2010, there are 49 banks. The number of branches and personnel is continuously growing. The total number of branches has increased to 9.601 from 9.581 in 2010 when compared to 2009. The number of personnel has the same performance parallel to the growth of branches. Especially, increased utilization of POS machines and internet is an indication of technological improvement in the banking sector.
Table 1. Data for Banking Services in Turkey
2005 2006 2007 2008 2009 2010/03 #of Banks 51 50 50 49 49 49 #of Branches 6.568 7.302 8.122 9.304 9.581 9.601 # of Personnel 138.724 150.966 167.760 182.667 184.216 186.619 # of ATMs 14.836 16.513 18.795 21.953 23.952 24.593 # of POS Machines (Th.) 1.141 1.283 1.629 1.886 2.048 2.067
# Of Int.. Active Cust (Th.) 3.177 3.368 4.274 5.169 5.974 6.006
Source: Banking Regulation and Supervision Agency (BRSA), 2010
Table 2 illustrates the financial indicators for Turkish banking sector. As of 2010 the strong structure of banking sector is preserved within the first quarter. Capital adequacy ratio of the sector is well above the legal limit. In terms of profits all banks seem to have good position, in 2009 and 2010. 46 out of 49 banks are profiting banks representing the 99% of the whole banking sector. While return on asset (ROA) ranges between 1,7% and 2,8% during the period 2005 and 2010, the return on equity (ROE) doubled from 10,9% to 19,9% for the same period. This may be the result of relatively higher debt levels of banks in 2009 and 2010. As can be seen from Table 2 the ratio of interest expenses to total expenses keeps increasing since 2005. It has dropped to 60,9 in 2009 and started decreasing in 2009.
Over all, after the 2001 financial crises in Turkey with the result of tight regulations and relatively intense auditing of banking sector has put the banks in a good shape for the last 5 years. Table 2 illustrates that the performance and the strong structure of banking sector have helped Turkish economy to cope with the financial crises in 2008 and 2009. For instance, the capital adequacy ratio is well above 8% criteria, and also the number of profitable banks is 46 out of 49 in 2008 and 2009.
Table 2. Relevant Financial Indicators for Banking Sector in Turkey
(%) 2005 2006 2007 2008 2009 2010/0
3
Capital Adeq. Standard Ratio 23,7 22,3 18,9 18,0 20,5 19,9
Total Own Funds /Total Assets 13,4 11,9 13,0 11,8 13,3 13,6
Loans/ Total Own Funds 286,0 367,8 376,6 425,7 354,5 357,0
Individual Loans/Total Loans 31,1 32,3 33,2 32,1 33,3 33,0
# Of Profiting Banks/Total # Of
Banks 45/51 41/50 46/50 45/49 46/49 46/49
Assets of Profiting Banks/Total
Assets 93,9 99,4 99,3 99,9 99,8 99,6
After-Tax Return on Assets (ROA) 1,7 2,5 2,8 2,0 2,6 2,6
After-Tax Return on Equities (ROE) 10,9 19,2 21,7 16,8 20,2 19,9
Interest Expenses/Total Expenses 55,8 65,3 67,1 67,3 60,9 54,5
Interest Incomes/Interest Expenses 176,3 160,9 158,0 156,5 196,1 218,3
Non-Interest Incomes/Non-Interest
Exp. 52,0 79,3 72,3 65,5 68,7 78,2
Source: Banking Regulation and Supervision Agency (BRSA), 2010
3. The Related Literature
In the recent years, developments in technological innovations and rapid globalization of financial system put competitive pressure on the financial markets. Therefore, the need to enhance the competitiveness of financial system against this pressure and to compete in a more liberalized environment has become one of the major issues of managers, governments and other economic actors. The result of these changes has moved financial institutions to be more market-oriented rather than being traditional intermediaries. Thus, the efficiency of financial institutions is of importance for a well-functioning economy.
Considering the importance of the financial system in attaining the overall economic performance with changes in the regulatory environment and the globalization of financial markets, a great amount of study has been conducted to investigate the efficiency of financial institutions by using parametric or non-parametric frontier techniques (Berger and Humphrey, 1991; Berger, 1993, Miller and Noulas, 1996, Berger and Humphrey, 1997, Ercan et al. 2007). Researches on efficiency of financial intermediaries mainly concentrate on managerial performances of these institutions, informing policy makers by assessing the effects of regulations and mergers on efficiency, and comparing different efficiency techniques (non-parametric and parametric techniques). Berger and Humphrey (1997) surveyed the results of 130 financial institution efficiency studies. The results of the survey exhibit that researches intensely focus on efficiency of banks and insurance firms.
Studies mainly concentrate on the effects of deregulation and financial liberalization on the efficiency of the banking sector. Zaim (1995) analyzed the efficiency of banking sector and concluded that after the liberalization policies in Turkey banks improved their efficiencies. In response to the deregulation of interest rates in the early 1980s in U.S. banks raised fees for deposit services, reduced branch operating costs, and shifted to higher earning assets in order to improve profit efficiency (Humphrey and Pulley, 1997). A more recent study by Canhoto and Dermine (2003) investigated the impact of deregulation process in Portugal banking sector. They concluded that new banks outperformed the older ones in terms of efficiency.
Other studies focused on the effects of mergers on the efficiency. For example, evidence from the merger cases of Australian trading banks shows that acquiring banks are more efficient than target banks (Avkiran, 1999). Some other studies aim to determine the changes in efficiency during the period of financial disruption and economic crisis. Aktaş (1999) has concluded that overall efficiency remained almost the same during the economic crisis period in Turkey.
Specifically, studies on the efficiency of insurance firms intensify on the methodological approach in determination of efficiency. For example, Brockett et al (2005) argue that “financial intermediary approach” in determining the efficiency of insurance firms is more appropriate than the alternative approach referred to as “production approach” by Berger and Humphrey (1997)1. However, “production
approach” is used in other studies in determination of efficiency of insurance firms such as Cummins and Weiss (1993) and Cummins, Weiss and Zi (1999).
Despite a great amount of literature on banking efficiency there are only few studies that investigate the relationship between bank efficiency and stock performance. For instance, Chu and Lim (1998) conducted a detailed analysis to investigate the relationship between efficiency and stock returns of six Singapore-listed banks. They have concluded that the changes in bank stock prices are more related to changes in profit rather than cost efficiency. A more recent study by Kirkwood and Nahm (2006) showed that changes in profit efficiency are statistically significant in determining the stock returns of banks. To our best knowledge this study will be the first research for
Turkish banking sector in terms of relating efficiency to stock returns.
4. Data Set and Methodology
I
n efficiency literature there are number of studies that apply non-parametric Data Envelop Analysis (DEA) and parametric Stochastic Frontier Analysis (SFA) methods2. In this study SFA is used in order to measure the performance of brokeragehouses. We prefer SFA because it is a parametric method, thus, it provides more information about the validity of the analysis3.
The analysis involves three steps in this study. The first step is to determine the efficiency scores of the banks and the firm attributes that influence the efficiency via SFA. In the second step panel data regression is applied to explain the relationship between market value to book value ratio and basic accounting measures such as firm size and financial leverage of banks. Finally, in order to understand whether efficiency is an explanatory variable for bank stock returns or not, efficiency scores of banks are included to the panel data regression analysis.
4.1. Data
As described in the previous section we employ three steps. In the first step the efficiency scores of the banks and the firm attributes that influence the efficiency is
1 See Brockett et al (2005) for a discussion of “intermediary approach” and “production approach” in
determination of efficiency for insurance firms.
2 See Berger and Humphrey (1997) for a detailed literature survey.
3 The key drawback of DEA is that it is assumed to have no random error and no measurement error in the
construction of the frontier. Therefore this can lead to severe problems in shaping and positioning the frontier. Additionally, due to the use of relative efficiency measures rather than absolute measures, it may lead to inaccurate comparisons among economic units (firms) (Schmidt, 1986).
determined via SFA. In the second step panel data regression is applied to explain the relationship between market value to book value ratio and basic accounting measures such as firm size and equity. In the last step efficiency scores are used as additional explanatory variable with accounting measures in panel data regression analysis to see the relationship between stock performance and efficiency scores.
For efficiency analysis, translog cost function is constructed and three outputs and three inputs are used in the SFA. The total cost is defined as the sum of total operating expenses and interest expenses. Total loans, other earning assets (investment securities) and total deposits are the outputs of the analysis. The price of physical capital, price of purchased funds and the price of labor are the inputs of the analysis. The price of physical capital is calculated as thetotal operating cost net of personnel expenses/total fixed assets. The price of purchase funds is calculated as the total interest expenses/corresponding liabilities (deposits etc.). The price of labor is
calculated as the total personnel expenses/total assets. Therefore, in our analysis we include both operating and financial costs in estimation of the cost function. Depending on the literature we applied in Section 3 and Section 5 the following bank attributes might impact on the efficiency of banks: Total assets (or firm size), Loans/Total Assets, Age of a bank, Interest Expense/Total Asset, The number of branches, The number of employees.
The relationship between stock performance and efficiency is investigated using panel data regression analysis. In the analysis bank stock performance is represented by market value to book value ratio (MV/BV)4.
To determine the relationship between accounting measures annual percentage change in total assets (change in firm size) and annual percentage change in equity and annual changes in MV/BV are regressed against the annual change in total assets and equity to total assets. The data for the analysis period is provided from publicly available balance sheets and income statements of banks. As the third step, to investigate the link between efficiency and the stock performance annual changes in MV/BV are regressed against the corresponding annual change in efficiency scores, and accounting variables. The annual percentage change in efficiency scores in year t is calculated as follows: 1 1 .. .. .. .. t t t t Score Efficiency Score Efficiency Score Efficiency Change Efficiency (1)
4.2. Stochastic Frontier Analysis (SFA)
Aigner et al. (1977) and Meeusen and van den Broeck (1977) proposed SFA independently in the measurement of efficiency. A considerable number of studies applied this method in efficiency literature. Stevenson (1980), for example, proposed the truncated normal distribution, whereas Greene (1990) used the two-parameter gamma distribution. Richmond (1974) introduced the COLS estimators as a different estimator in SFA, and Battase and Corra (1977) introduced a new variance parameter.
4 In the finance literature that investigates the relationship between stock performance and efficiency stock
returns are considered as a means of stock performance. However, in this study MV/BV ratios are considered as the indicator of stock performance because MV/BV links market expectations to financial statement information.
Coelli (1995) argued that in SFA analyses, the use of one-sided Log-likelihood statistics may provide more sensitive results than the Wald statistics. Kumbhakar et al (1991) and Reifschneider and Stevenson (1991) and Battese and Coelli (1995) defined the reasons for inefficiency in terms of a second disturbance or error term. Coelli (1992) and Coelli (1996) developed a computer program called FRONTIER for the estimation of stochastic frontier models. This program stimulated SFA analyses. Stochastic frontier analysis (SFA) is a functional form for the relationship between input and an output. This method includes an error term which has two components, one to account for random effects and another to account for technical inefficiency. In this study the proposed stochastic frontier production model form is specified as follows: i i i i i i
f
w
y
z
v
u
TC
ln
(
,
,
,
;
,
)
ln
for i1,2,...,N (2) Where,TC
i is the observed total cost of the ith firm,w
i,
y
i,
z
i denote the vectors of input prices, output and firm specific variables (
s in Table 3.).
and
represent a vector of unknown parameters. The first error termv
i incorporates the random effect and is assumed to follow a symmetrical normal distribution(
(
0
,
2))
N
v
i
.The second error term
u
i corresponds to the effects of banks’ efficiency, involves both allocative and technical inefficiency. Since inefficiency cannot be negative, the value ofu
i must be greater or equal to zero and is assumed to follow asymmetric, usually half normal distributionN
(
it,
uit2)
. These two error terms together constitute the composed error term(
i
v
i
u
i)
, where v and u are independently distributed.From Equation 1 the coefficients and the combined error term,
i, are estimated and then efficiency scores are calculated for each observation in the sample. Maximum likelihood function can be used to compute the estimates of this model (Olson et al, 1980). Efficiency levels are estimated by using the regression errors.The estimated of inefficiency is taken by utilizing the mean of the inefficiency term conditional on the estimate of the composed error term,
i i i u v u
E . The mean of this
conditional distribution is defined as;
i i i i i F f I u E ) / ( 1 ) / ( 1 2 (3)Where
u/
v and total variance 2 2 2 v u
; F() and f() are the standard normal distribution and density functions respectively. E(uI
) is an unbiased estimator ofi
u
. In the model
measures the amount of variation emanating from inefficiency relative to noise for the sample.SFA needs to specify a particular distributional form for the inefficiency term associated with the behavioral assumptions and a functional form for the production function (Coelli et al, 2005). In the analysis the choice of the right functional form is vital. In SFA there some common functional forms such as Cobb-Douglas specifications and translog specifications. In the banking literature, most of the empirical studies have employed translog specifications. In this study we employed the following translog function:
t y t y y t y w TC jit j jt tt hit h jit jh j t jit j j i i ) ln( ) ln( ) ln( 2 1 ) ln( ) ln( 3 1 2 3 1 3 1 3 1 0 1 i h j i tt jt hit jit hi ji h j hit jit jh j j ji ji w
w w
y w
tv u
2 1 2 1 2 1 3 1 2 1 2 1 ) ln( ) ln( ) ln( ) ln( 2 1 ) ln( (4)In order to impose linear homogeneity, total cost(TC), the price of labor(w , price 1) of physical capital(w2), price of purchased funds
(
w
3)
are normalized by price of labor)
(w . Therefore, the 1
w
ji notation in the translog function denotes price of physicalcapital/price of labor( ) 1 2 i i w
w , and Price of purchased funds/price of labor
)
(
1 3 i iw
w
, respectively.4.3. Panel Data Regression Analysis
As argued by Baltagi (2008), panel data having a time-series dimension and cross-section dimension give more information, more variability, less collinearity, more degrees of freedom and more efficiency. The panel data regression can be expressed as follows:
'
it it i it
y
X
u
i1,...,N; t1,2,...,T (5) where i and t denote individuals (banks) and t time period respectively.
i represents individual effects and it takes into account individual heterogeneity.
is the constant
is coefficient vector of Kx1 andX
it is the ith observation on K explanatory variables. Note that individuals effects are treated as fixed since the sample is identical to the population of interest. In this study we use Greene’s (2008) and Baltagi and Lee’s (1995) tests for heteroscedasticity and serial correlation over time respectively. Although these two tests were developed for fixed effects models they are also valid for random effects models as shown by these authors. Furthermore Baltagi and Lee (1995) assume that the disturbances follow a stationary AR(1) process. Therefore we use Fixed effects regression with AR(1) disturbances to correct serial correlation.5. Empirical Results
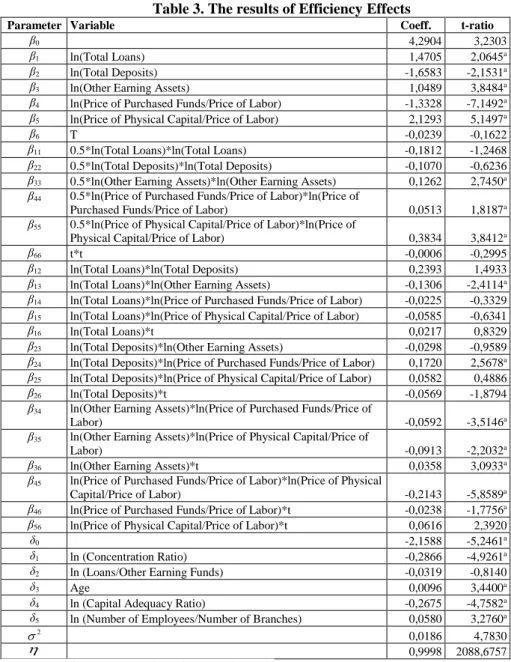
Referring to Table 3 the concentration ratios decrease the inefficiency i.e it has a positive effect on the efficiency of the banks. This can be interpreted as publicly traded banks in Turkey benefit from economies of scale. Kasman (2002), Demsetz (1974), Lambson (1987)] and Shepherd (1982 and 1986) found evidence that support the results of this studies. Chen, Mason and Higgins (2001), however, found controversial results. Some studies suggest that efficiency is one of the determinants of a higher
concentration ratio (Timme and Yang 1991, Berger and Hannan 1993, Berger 1995) based on Berger and Humphrey.
Table 3. The results of Efficiency Effects
Parameter Variable Coeff. t-ratio
β0 4,2904 3,2303
β1 ln(Total Loans) 1,4705 2,0645a
β2 ln(Total Deposits) -1,6583 -2,1531a
β3 ln(Other Earning Assets) 1,0489 3,8484a
β4 ln(Price of Purchased Funds/Price of Labor) -1,3328 -7,1492a
β5 ln(Price of Physical Capital/Price of Labor) 2,1293 5,1497a
β6 T -0,0239 -0,1622
β11 0.5*ln(Total Loans)*ln(Total Loans) -0,1812 -1,2468
β22 0.5*ln(Total Deposits)*ln(Total Deposits) -0,1070 -0,6236
β33 0.5*ln(Other Earning Assets)*ln(Other Earning Assets) 0,1262 2,7450a
β44 0.5*ln(Price of Purchased Funds/Price of Labor)*ln(Price of
Purchased Funds/Price of Labor) 0,0513 1,8187a
β55 0.5*ln(Price of Physical Capital/Price of Labor)*ln(Price of
Physical Capital/Price of Labor) 0,3834 3,8412a
β66 t*t -0,0006 -0,2995
β12 ln(Total Loans)*ln(Total Deposits) 0,2393 1,4933
β13 ln(Total Loans)*ln(Other Earning Assets) -0,1306 -2,4114a
β14 ln(Total Loans)*ln(Price of Purchased Funds/Price of Labor) -0,0225 -0,3329
β15 ln(Total Loans)*ln(Price of Physical Capital/Price of Labor) -0,0585 -0,6341
β16 ln(Total Loans)*t 0,0217 0,8329
β23 ln(Total Deposits)*ln(Other Earning Assets) -0,0298 -0,9589
β24 ln(Total Deposits)*ln(Price of Purchased Funds/Price of Labor) 0,1720 2,5678a
β25 ln(Total Deposits)*ln(Price of Physical Capital/Price of Labor) 0,0582 0,4886
β26 ln(Total Deposits)*t -0,0569 -1,8794
β34 ln(Other Earning Assets)*ln(Price of Purchased Funds/Price of
Labor) -0,0592 -3,5146a
β35 ln(Other Earning Assets)*ln(Price of Physical Capital/Price of
Labor) -0,0913 -2,2032a
β36 ln(Other Earning Assets)*t 0,0358 3,0933a
β45 ln(Price of Purchased Funds/Price of Labor)*ln(Price of Physical
Capital/Price of Labor) -0,2143 -5,8589a
β46 ln(Price of Purchased Funds/Price of Labor)*t -0,0238 -1,7756a
β56 ln(Price of Physical Capital/Price of Labor)*t 0,0616 2,3920
δ0 -2,1588 -5,2461a
δ1 ln (Concentration Ratio) -0,2866 -4,9261a
δ2 ln (Loans/Other Earning Funds) -0,0319 -0,8140
δ3 Age 0,0096 3,4400a
δ4 ln (Capital Adequacy Ratio) -0,2675 -4,7582a
δ5 ln (Number of Employees/Number of Branches) 0,0580 3,2760a
2
0,0186 4,7830
0,9998 2088,6757
Superscript a denotes statistical significance at least 5 %
Contrary to our expectations, the age of the banks has a negative effect on the efficiency. This might be the indication of becoming clumsy as the banks get older. Another possible reason for efficiency differences is that younger banks use newer technologies than older banks, which makes them more cost efficient. In the literature, there is a controversial result about the effect of age on a bank’s efficiency. For example, similar results were found by Ahmad and Noor (2011) and Karim et al.
(2010), while Thi and Vencappa (2008) and Khaddaj (2010) obtained the opposite result.
In terms of the capital adequacy ratio, a higher level of capital adequacy appears to influence efficiency positively. At first glance, the higher ratio may be interpreted as increased costs. However, after the 2001 financial crisis in Turkey, investors may have sought to invest in less risky banks. The number of employees per unit of branches has a negative effect on the efficiency of publicly traded banks, as expected. Finally, we could not find any significant relationship for the Loans/Other Earning funds ratio.
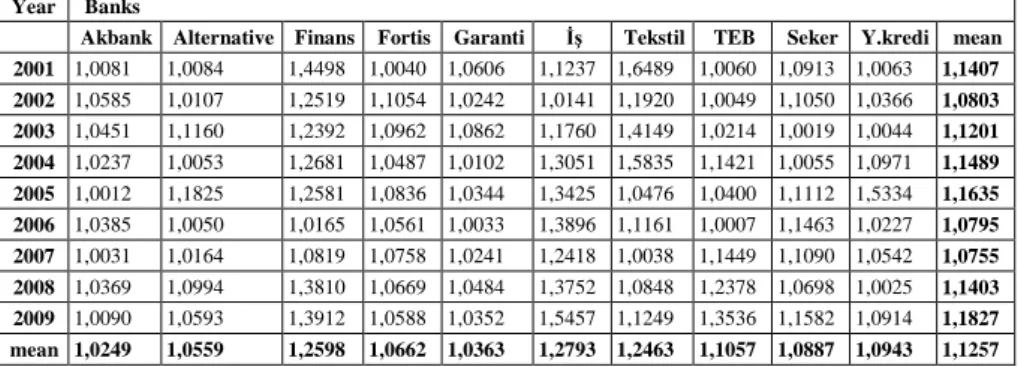
Table 4 illustrates the efficiency scores for the sample period. Overall the mean of efficiency scores is 1,1257 for the period. The most efficient bank is Akbank when compared to the mean of efficiency scores of whole period. Table 5 shows the bank efficiency scores below and above the mean efficiency scores of the mean. The best efficiency scores are achieved in 2006 and 2007 with scores of 1,0795 and 1,0755 respectively. This may be interpreted as the publicly traded banks are trying to compete on the basis of cost efficiency.
Table 4. Efficiency Scores of Banks for the Sample Period.
Year Banks
Akbank Alternative Finans Fortis Garanti İş Tekstil TEB Seker Y.kredi mean 2001 1,0081 1,0084 1,4498 1,0040 1,0606 1,1237 1,6489 1,0060 1,0913 1,0063 1,1407 2002 1,0585 1,0107 1,2519 1,1054 1,0242 1,0141 1,1920 1,0049 1,1050 1,0366 1,0803 2003 1,0451 1,1160 1,2392 1,0962 1,0862 1,1760 1,4149 1,0214 1,0019 1,0044 1,1201 2004 1,0237 1,0053 1,2681 1,0487 1,0102 1,3051 1,5835 1,1421 1,0055 1,0971 1,1489 2005 1,0012 1,1825 1,2581 1,0836 1,0344 1,3425 1,0476 1,0400 1,1112 1,5334 1,1635 2006 1,0385 1,0050 1,0165 1,0561 1,0033 1,3896 1,1161 1,0007 1,1463 1,0227 1,0795 2007 1,0031 1,0164 1,0819 1,0758 1,0241 1,2418 1,0038 1,1449 1,1090 1,0542 1,0755 2008 1,0369 1,0994 1,3810 1,0669 1,0484 1,3752 1,0848 1,2378 1,0698 1,0025 1,1403 2009 1,0090 1,0593 1,3912 1,0588 1,0352 1,5457 1,1249 1,3536 1,1582 1,0914 1,1827 mean 1,0249 1,0559 1,2598 1,0662 1,0363 1,2793 1,2463 1,1057 1,0887 1,0943 1,1257
Table 5. Bank Efficiency Scores Below and Above the Mean Efficiency Score for the Sample Period
2001 2002 2003
Fortis 1,0040 teb 1,0049 şeker 1,0019
Teb 1,0060 alternatif 1,0107 yapı 1,0044
Yapı 1,0063 iş 1,0141 teb 1,0214
Akbank 1,0081 garanti 1,0242 akbank 1,0451
Alternative 1,0084 yapı 1,0366 garanti 1,0862
Garanti 1,0606 akbank 1,0585 fortis 1,0962
Şeker 1,0913 mean 1,0803 alternatif 1,1160
Iş 1,1237 şeker 1,1050 mean 1,1201
Mean 1,1407 fortis 1,1054 iş 1,1760
Finans 1,4498 tekstil 1,1920 finans 1,2392
Tekstil 1,6489 finans 1,2519 tekstil 1,4149
Table 5. Continue
Alternative 1,0053 akbank 1,0012 teb 1,0007
Şeker 1,0055 garanti 1,0344 garanti 1,0033
Garanti 1,0102 teb 1,0400 alternatif 1,0050
Akbank 1,0237 tekstil 1,0476 finans 1,0165
Fortis 1,0487 fortis 1,0836 yapı 1,0227
Yapı 1,0971 şeker 1,1112 akbank 1,0385
Teb 1,1421 Mean 1,1635 fortis 1,0561
Mean 1,1489 alternatif 1,1825 Mean 1,0795
Finans 1,2681 finans 1,2581 tekstil 1,1161
Iş 1,3051 iş 1,3425 şeker 1,1463
Tekstil 1,5835 yapı 1,5334 iş 1,3896
2007 2008 2009
Akbank 1,0031 yapı 1,0025 akbank 1,0090
Tekstil 1,0038 akbank 1,0369 garanti 1,0352
Alternative 1,0164 garanti 1,0484 fortis 1,0588
Garanti 1,0241 fortis 1,0669 alternatif 1,0593
Yapı 1,0542 şeker 1,0698 yapı 1,0914
Mean 1,0755 tekstil 1,0848 tekstil 1,1249
Fortis 1,0758 alternatif 1,0994 şeker 1,1582
Finans 1,0819 Mean 1,1403 Mean 1,1827
Şeker 1,1090 teb 1,2378 teb 1,3536
Teb 1,1449 iş 1,3752 finans 1,3912
Iş 1,2418 finans 1,3810 iş 1,5457
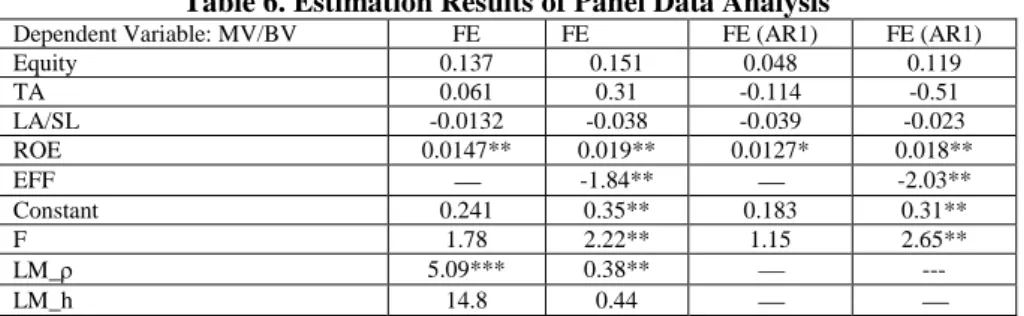
Table 6 illustrates the results of panel data analysis with and without efficiency variable in terms of stock performance. The first two columns show the results obtained by fixed effects estimator and the last two columns show Fixed effects regression results with AR(1) errors. As seen in all cases the coefficients on Return on Equity (ROE) are statistically significant whereas the coefficients associated with the other accounting variables (Capital adequacy ratio denoted as Equity, Concentration ratio denoted as TA, Liquid Assets to Short Term Loans (LA/SL)) are not. The positive coefficient of variable ROE indicates that an increase in ROE increases MV/BV ratio. This can be interpreted as investors are willing to pay higher prices for the banks’ stocks.
Efficiency (EFF) is also statistically significant and of expected sign. As indicated by F tests, models become significant only when efficiency variable is added.
Table 6. Estimation Results of Panel Data Analysis
Dependent Variable: MV/BV FE FE FE (AR1) FE (AR1)
Equity 0.137 0.151 0.048 0.119 TA 0.061 0.31 -0.114 -0.51 LA/SL -0.0132 -0.038 -0.039 -0.023 ROE 0.0147** 0.019** 0.0127* 0.018** EFF -1.84** -2.03** Constant 0.241 0.35** 0.183 0.31** F 1.78 2.22** 1.15 2.65** LM_ 5.09*** 0.38** --- LM_h 14.8 0.44
FE: Fixed Effects Regression, FE (AR1): Fixed effects regression with AR(1) disturbance.
F tests overall significance of the models , LM_ is Baltagi and Lee (1995) test statistic for testing serial correlation and LM_h is Lagrange Multiplier test statistic advanced by Greene (2008) to test for heteroscedasticity.
This result suggests that investors do concern about efficiency of banks in their investment decisions. On the other hand, the coefficient of variable EFF (change in efficiency in time t) is negative showing that if banks move to higher efficiency scores in terms of cost i.e. less cost efficient, then the investors are willing to pay fewer prices for banks’ stocks.
6. Conclusion
Since Adam Smith, efficiency has been stressed as one of the crucial factors for economic wellness, and many researchers have focused on the notion of efficiency. Over time, the applications of efficiency have focused on company efficiency, the determinants of efficiency and effect of efficiency on different variables. This paper analyses the determinants of cost efficiency and the effect of efficiency on the stock performance of banks.
Given the chaotic economic situation during 2005-2010 period, banks must manage many difficult tasks such as managing employees, economic conditions, IT applications, government responsibilities, customer responsibilities and so on. However, there are several factors that may influence banks to overcome these difficult tasks such as size, efficiency, age and financial structure etc.
The results of this paper show that return on equity (ROE) influences the market-to-book value (MV/BV) positively, indicating that investors are willing to pay higher prices for these banks. However, the efficiency levels for banks are a significant factor in valuing their stock prices. It is reasonable that efficiency has effects on the stock price of banks because it is a complex variable that is determined by inputs and outputs.
Another important result of this study is that when the efficiency variable is excluded from the model, other explanatory variables do not produce any statistically significant results in terms of stock prices. It is well known that the banking sector is fragile, so investors emphasize the factors that influence stock performance. Efficiency is one of the crucial factors affecting the current and future performance of banks. Consequently, the findings of this study can be considered to be strong evidence for the importance of efficiency on the stock performance of banks.
7. References
AHMAD, N.H., Noor, M.A.N.M (2011). The determinants efficiency and profitability of World Islamic Banks. 2010 International Conference on E-business, Management and Economics, Hong Kong.
AIGNER, D., Lovell, C.A.K., Schmidt, P. (1977). Formulation and estimation of Stochastic Frontier Production function models. Journal of Econometrics, 6, pp.21-37.
AKTAŞ, H. (1999). Türk bankacılık sektöründe verimlilik: Kamu ve özel bankaların karşılaştırılması. Yöneylem Araştırması ve Endüstri Mühendisliği 20. Ulusal Kongresi, 8-9 Haziran, Kara Harp Okulu, Ankara.
AVKIRAN, N.K. (1999). The evidence on efficiency gains: The role of mergers and the benefits to the public. Journal of Banking and Finance, 23, pp.991-1013.
BALTAGI, B., Lee, Q. (1995). Testing AR (1) against MA (1) disturbances in an error component model. Journal of Econometrics, 68, pp.133-151.
BALTAGI, B.H. (2008). Econometric analysis of panel data, John Wiley and Sons, England. BANKING REGULATION AND SUPERVISION AGENCY (BRSA), 2010
BATTESE, G.E., COELLI, T.J. (1995). A model for technical inefficiency effects in a Stochastic Frontier Production function for panel data. Empirical Economics, 20, pp.325-332.
BATTESE, G.E., CORRA, G.S. (1977). Estimation of a production frontier model: With application to the pastoral zone of eastern Australia. Australian Journal of Agricultural Economics, 21, pp.169-179.
BERGER, A.N., HANNAN, T.H. (1993). Using efficiency measures to distinguish among alternative explanations of the structure-performance relationship in banking. Finance and Economics Discussion Series 93-18, Board of Governors of the Federal Reserve System (U.S.).
BERGER, A.N., HUMPHREY, D.B. (1991). The dominance in efficiencies over scale and product mix economies in banking. Journal of Monetary Economics, 28, pp.117-148. BERGER, A.N., HUMPHREY, D.B. (1997). Efficiency of financial Institutions: International
survey and directions for the future research. European Journal of Operational Research, 98, pp.175-212.
BERGER, A.N., (1995). The profit-structure relationship in banking-Tests of market-power and efficient-structure hypotheses. Journal of Money, Credit, and Banking, 27 (2): pp.401-431.
BROCKETT, P. L., COOPER, W. W., GOLDEN, L. L., ROUSSEAU, J. J., WANG, Y. (2005). Financial intermediary versus production approach to efficiency of marketing distribution systems and organizational structure of insurance companies. The Journal of Risk and Insurance, 72, pp.393-412.
CANHOTO, A., DERMINE, J. (2003). A note on banking efficiency in Portugal: New vs. old banks. Journal of Banking and Finance, 27, pp.2087-2098.
CHEN, J.K., MASON, J.R., HIGGINS, E.J. (2001). Does bank Efficiency change with the Business Cycle? The relationship between monetary policy. Economic growth, and bank condition. Mimeo. Emporia University.
CHU, S.F., LIM, G.H. (1998). Share performance and profit efficiency of banks in an oligopolistic market: Evidence from Singapore. Journal of Multinational Financial Management, 8, pp.155-168.
COELLI, T. (1996). A GUIDE to FRONTIER Version 4.1: A computer progrem for frotier production function estimation. CEPA Working Paper 96/07, Department of Econometrics. University of New England, Armindale.
COELLI, T.J. (1992). A computer program for frontier production function estimation: FRONTIER, Version 2.0. Economic Letters, 39, pp.29-32.
COELLI, T.J., RAO P.D.S., O’DONNELL, C.J., BATTASE, G. (2005). An introduction to efficiency and productivity analysis. Second Edition, Springer.
CUMMINS, J.D., WEISS, M. (1993). Measuring cost efficiency in the property-liability insurance industry. Journal of Banking and Finance, 17, pp.463-481.
CUMMINS, J.D., WEISS, M., ZI, H. (1999). Organizational form and eficiency: The coexistence of stock and mutual in the property-liability insurers. Management Scienc, 45, pp.1254-1269.
DEMSETZ, H. (1974). Two systems of belief about monopoly, in Harvey Goldschmid, et al., eds., Industrial Concentration: The New Learning, Little, Brown Boston.
ERCAN, M.K., ÖZTÜRK, M.B., KÜÇÜKKAPLAN, İ., BAŞCI, E.S., DEMIRGÜNEŞ, K. (2007). Halka açık firmaların beta katsayılarının regresyon modeli ile tespiti ve halka açık olmayan firmalara yönelik uygulanabilirliği. Dozkuz Eylül Üniversitesi, IIBF Dergisi, 22, pp.295-324.
FABBOZZI, F.J., MODIGLIANI, F., FERRI, M.G. (1994). Foundations of financial markets. New Jersey: Prentice-Hall
GREENE, W.H. (2008). Econometric Analysis. 6th Ed., New Jersey: Prentice-Hall.
HUMPHREY, D.B., PULLEY, L.B. (1997). Banks' responses to deregulation: Profits, technology, and efficiency. Journal of Money, Credit and Banking, 29, pp.73-93. KARIM, M.Z. A., CHAN, S.G., HASSAN, S. (2010). Bank efficiency and non-performing
KASMAN, A. (2002). Cost efficiency, scale economies, and technological progress in Turkish banking. Central Bank Review, 1, pp.1-20
KHADDAJ, W.W. (2010). Evaluating banks efficiency in Syria: An empirical study using Data Envelopment Analysis. Social Science Research Network, pp.1-23.
KIRKWOOD, J., NAHM, D. (2006). Australian banking efficiency and its relation to stock returns. The Economic Record, 82, pp.253-267.
KUMBHAKAR, S., GHOSH S. C., MCGUCKIN J.T. (1991). A generalised production frontier approach for estimating determinants of inefficiency in U.S. dairy farms. Journal of Business, Economics and Statistics, 9, pp.279–286.
LAMBSON, V.E. (1987). Is the concentration-profit correlation partly an artifact of lumpyt?. American Economic Review, 77, pp.731-33.
MEEUSEN, W., van den BROECK, J. (1977). Efficiency estimation from Cobb-Douglas production functions with composed error. International Economic Review, 18, pp.435-444.
MILLER, S., NOULAS, A. (1996). The technical efficiency of large bank production. Journal of Banking and Finance, 28, pp.178-199.
OLSON, J.A., SCHMIDT, P., WALDMAN, D.M. (1980). A Monte Carlo study of estimators of stochastic frontier production functions. Journal of Econometrics, 13 (1), pp.67-82. REIFSCHNEIDER, D., STEVENSON, R. (1991). Systematic departures from The Frontier: A
framework for the analysis of firm inefficiency. International Economic Review, 323, pp.715-723.
SCHMIDT, P. (1986). Frontier production functions. Econometric Reviews, 4 (2), pp.289-328. SHEPHERD, W.G. (1986). Tobin’s q and the structure-performance relationship: Comment.
American Economic Review, 76, pp.1205-1210.
SHEPHERD, W.G., (1982). Economies of scale and monopoly profits. in J.V. Craven, ed., Industrial Organization, Antitrust, and Public Policy, Kluwer, Boston.
STEVENSON, R. (1980). Likelihood functions for generalized Stochastic Frontier Estimation. Journal of Econometrics, 13, pp.58 66.
Thi N.A.V., VENCAPPA, D. (2008). Does the Entry Mode of Foreign Banks Matter for Bank Efficiency? Evidence from the Czech Republic, Hungary, and Poland. William Davidson Institute Working Paper, Number 925.
TIMME, S.G., YANG, W.K. (1991). On the use of a direct measure of efficiency in testing structure-performance relationship, Working Paper, Georgia State University.
ZAIM, O. (1995). The effect of financial liberalization on the efficiency of Turkish commercial banks. Applied Financial Economies, 5, pp.257-264.