i
This volume contains papers presented at THE INTERNATIONAL FINANCE, BANKING & INSURANCE CONGRESS, FIBAC 2012. Their inclusion in this publication does not necessarily constitute endorsements by editor or the publisher.
Copyright and Reprint Permission
Copying without a fee is permitted provided that the copies are not made or distributed for direct commercial advantage, and credit to source is given. Please contact the publisher for other copying, reprint, or republication permission.
Copyright © 2013 Istanbul Kultur University Press 185
ii
PROCEEDINGS OF
THE INTERNATIONAL FINANCE, BANKING & INSURANCE CONGRESS, FIBAC 2012
Editor Nazan CAGLAR
Organizing Committee
Assist. Prof. Dr. Hikmet CAGLAR TC Istanbul Kultur University
Assist. Prof. Dr. Nazan CAGLAR TC Istanbul Kultur University
Prof. Dr. Durmus DUNDAR TC Istanbul Kultur University
Prof. Dr. Muge ISERI TC Istanbul Kultur University
Advisory Committee
(R) Ambassador Halil AKINCI Secretary General, Turkic Council
Tevfik ALTINOK The Bank Association of Turkey
Prof. Dr. Turan G. BALI Baruch College, CUNY; USA
Prof. Dr. Sumon BHAUMIK Aston Business School, UK
Osman BIRSEN Former President, Istanbul Stock Exchange - IMKB
Prof. Dr. Josef BRADA Arizona State University, USA
Mehmet BUYUKEKSİ President, Turkish Exporters Assembly - TIM
Huseyin ERKAN President, Istanbul Stock Exchange - IMKB
Prof. Dr. Shawkat HAMMOUDEH Drexel University, USA
Prof. Dr. Evzen KOCENDA CERGE-EI, Charles University, Czech Republic
Prof. Dr. Tamer KOCEL TC Istanbul Kultur University
Tanil KUCUK President, Istanbul Chamber of Industry - ISO
Prof. Dr. Ali M. KUTAN Southern Illinois University Edwardswille
Gulnur MURADOGLU Sir Cass Business School, UK
Suleyman ORAKCIOGLU CEO, Orka Group
H. Ersin OZINCE President, Board of Trustees, Isbank Turkey
Ufuk SOYLEMEZ Former State Minister for Economy of the Republic of Turkey
Dr. Istvan P. SZEKELY European Commission, Belgium
Ercan UYGUR President, Turkey Economic Association
Murat YALCINTAS President, Istanbul Chamber of Commerce - ITO
Durmus YILMAZ Former President, Central Bank of Turkey
Scientific Committee Prof. Dr. Mufit AKYUZ Marmara University
Prof. Dr. Emre ALKIN TC Istanbul Kultur University
Prof. Dr. Abdullah Sulaiman AL RAJHI Managing Director and CEO of Al Rajhi Bank
Lecturer Raif BAKOVA TC Istanbul Kultur University
Prof. Dr. Nihal BAYRAKTAR Pennsylvania State University – Harrisburg, USA
Prof. Dr. Sumon BHAUMIK Aston Business School, UK
iii
Ege CANSEN Journalist, Hurriyet Daily newspaper in Turkey
Assist. Prof. Dr. Nazan CAGLAR TC Istanbul Kultur University
Assist. Prof. Dr. Hikmet CAGLAR TC Istanbul Kultur University
Prof. Dr. Guglielmo Maria CAPORALE Brunel University, London
Prof. Dr. Peyami CARIKCIOGLU TC Istanbul Kultur University
Assoc. Prof. Dr. Ozgur DEMIRTAS Baruch College, CUNY; USA
Prof. Dr. Sel DIBOOGLU University of Missouri St Louis, USA
Prof. Dr. Durmus DUNDAR TC Istanbul Kultur University
Prof. Dr. Nazim EKREN Former Deputy Prime Minister of the Republic of Turkey
Dr. Selim ELEKDAG International Monetary Fund - IMF
Gazi ERCEL Former Governor Central Bank of Turkey
Dr. Hubert GABRISCH Halle Institute for Economic Research, Germany
Prof. Dr. Rajeev K. GOEL Illinois State University, USA
Prof. Dr. Emre GONENSAY Former Minister of Foreign Affairs of the Republic of Turkey
Prof. Dr. Seyfettin GURSEL Bahcesehir University
Prof. Dr. Steve HANKE Professor Applied Economics the Johns Hopkins University
Prof. Dr. Zeyyat HATIPOGLU Gebze Institute of Technology
Dr. Olena HAVRYLCHYK CEPII, France
Dr. Aaro HAZAK Tallinn University of Technology, Estonia
Dr. Deniz O. IGAN International Monetary Fund - IMF
Prof. Dr. Muge ISERI TC Istanbul Kultur University
Prof. Dr. Ilan NOY University of Hawaii, Manoa, USA
Dr. Gul Berna OZCAN University of London, UK
Assoc. Prof. Dr. Erick W. RENGIFO Fordham University, USA
Prof. Dr. Shahrokh M. SAUDAGARAN Secretary General, Asian Academic Accounting Association
Prof. Dr. Pierre L. SIKLOS Wilfrid Laurier University, Canada
Prof. Dr. Munir SAKRAK Marmara University
Prof. Dr. Zafer TUNCA TC Istanbul Kultur University
Assoc. Prof. Dr. Sebnem URALCAN TC Istanbul Kültür University
Prof. Dr. Targan UNAL Istanbul University
Prof. Dr. Besim USTUNEL Former Minister of Finance of the Republic of Turkey
Assoc. Prof. Dr. Jian YANG University of Colorado Denver, USA
Prof. Dr. Erol YARIZ Halic University
Assist. Prof. Dr. Mehmet E. YAYA Eastern Michigan University, USA
Assist. Prof. Dr. Haigang ZHOU Cleveland State University, USA
Keynote Speakers
Prof. Dr. Josef BRADA Arizona State University, USA Editor, EasternEuropeanEconomies; Co-Editor,
ComparativeEconomicStudies
Prof. Dr. Steve HANKE Professor Applied Economics the Johns Hopkins University
Prof. Dr. Ali M. KUTAN Southern Illinois University Edwardswille, Editor, Emerging Markets Finance and
iv
Contents
The Comovements of Emerging Stock Markets of Central and Eastern Europe: Impact of EU Enlargement 1 D.E. ALLEN , A. GOLAB, R. POWELL, G. YAP
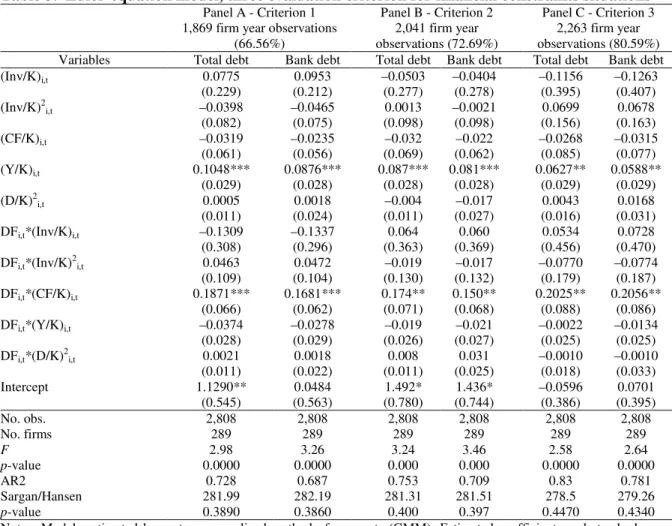
Block Holding by Other Nonfinancial Firms Mitigates Financial Constraints for Investment in Brazil 17 Vicente Lima CRISÓSTOMO, Félix Javier LÓPEZ ITURRIAGA, Eleuterio VALLELADO GONZÁLEZ
The Study of Nanotechnology R&D’s Effect on Economic Growth 29
R. ALEEMRAN, V. KASMAEIPOUR, H. ESMAILI
The Study of The Effects of Monetary And Fiscal Policies on Iran Stock Market 32 R. ALEEMRAN, E. BABAPOUR
The Study of The Effect of Monetary Policy Instability on Total Return of Stock Market in Iran 39 R. ALEEMRAN , S.A. ALEEMRAN
A Case Study Of The Efficacy Of Investment In Human-Capital On Economic Growth Within Organization
Of Islamic Conference 44
Mohammadreza NAHIDI, Rana DELJAVAN
Increase Of Organizational Performance, Effect Of Applying The Procedures Of Staff Management Audit 53 Alunica MORARIU
Importance of Technology, Innovation and R&D in Increasing The Competitive Capacity of Smes in Turkey 59 B. E. ŞAHIN, E. DÜNDAR
Capital Flows to Turkey: Multivariate Var Approach 67
Dervis KIRIKKALELI
The Influence of World Financial Crisis on The Economy of Kazakhstan 76
Gulzhan DOSZHAN, Nurila SHAIMERDINOVA
The Regional Trade Policy of Kazakhstan in Pending Accession to The WTO 82
Gulzhan DOSZHAN, Nurila SHAIMERDINOVA
Friction in Trading Processes: Some Empirical Evidence from The Indexes of The Cee Emerging Stock Markets 89 Joanna OLBRYS, Elzbieta MAJEWSKA
Twin Deficits Phenomenon and Deficits’ Bidirectional Correlation Case in Turkish Economy 98 Fatih YIGIT , Fuzuli ALIYEV
Financing of Energy Infrastructures 106
Selçuk BALI
Financial Development and Optimal Exchange Rate Regime Choice in Developing Countries 111 A.BOUDRIGA, I.KHOUJA
The Study of Economic Security’s Effect on Economic Growth in Selected Countries in 1995 -2009 127 H. ESMAILI, H. AGHAJANI, V. KASMAEIPOUR
Analytic Network Process Approach For Portfolio Selection Problem 132
Esra YILDIRIM, İçlem ER, Gülnur KECEK
How Asymmetric are Stock Market Returns in The Brics? 141
Elizabeth HOWARD
Evaluation of The Changes in Turkish Insurance Sector 165
v
Factors Affecting a Demand for an Agriculture Index Insurance in Poland 170
M. KACZAŁA, K.ŁYSKAWA
Principal Factors Affecting China Actual Environmental Risk (Caer) Advice From Behavior and Area Angle
Given to The Financial Institutions, Enterprises and Governments Performing Environment-Related Operations 181 Changqing LIU
The Role of Latin Alphabet in Economic Integration of Turkic States: New Trends and Opportunities 188 Saduakasov Aidos KARTANBAYULI
Climate Derivatives and an Examination on Weather Risk Insurance 194
Ceren UZAR, G. Cenk AKKAYA
The Mechanisms of Speculation by Financial Derivatives, Synthetic Assets and Overall Picture of Speculation in
Emerging Markets with Local Players 199
1
THE COMOVEMENTS OF EMERGING STOCK MARKETS OF CENTRAL AND EASTERN EUROPE: IMPACT OF EU ENLARGEMENT
D.E. ALLEN 1*, A. GOLAB 2, R. POWELL 3 and G. YAP 4
1-4 Edith Cowan University, School of Accounting, Finance and Economics *Corresponding author e-mail: [email protected]
Abstract
This paper examines the short and long run behaviour of emerging stock markets in Bulgaria, the Czech Republic, Cyprus, Estonia, Hungry, Latvia, Lithuania, Malta, Poland, Romania, Slovakia and Slovenia and assesses the impact of the EU on stock market linkages as revealed by the time series behaviour of their stock market indices.
A time-series framework is adopted which incorporates: cointegration analysis including the Johansen procedure, Granger Causality tests, Variance Decompositions and Impulse Response analyses. Our main empirical results show that mostly one and, on some occasions, two cointegrating vectors exist in both pre- and post- EU periods that confirm the existence of long run relationships between markets. Granger Causality relationships are indentified among the most advanced emerging markets. The Variance Decomposition analyses show that regional integration is evident amongst the markets. Furthermore, the Impulse Response function illustrates that the shocks in returns persist for a very limited period of time; and in less than one week, there is no measurable reaction to the innovations among them in terms of small shock responses. The results hold for all twelve markets in the CEE.
Keywords: Emerging Markets, Johansen Cointegration, Granger Causality, Variance Decomposition, Impulse Response
1. Introduction
The extent of financial market cointegration is one of the most important issues for a large number of economic agents. The size and evolution of the cointegration between market returns in emerging equity markets are important for appropriate portfolio selection. In this paper we examine the implications for European investors of the recent European Union (EU) expansion to encompass former Eastern block economies. Capiello, Engle and Sheppard (2006) question whether the formation of European Monetary Union (EMU) within the EU has increased the correlation of national assets. This clearly has important implications for investors wishing to diversify across national markets. Should investors diversify outside the Central and Eastern European (CEE) countries? It could be argued that the former Eastern block economies constitute emerging markets which typically offer attractive risk adjusted returns for international investors.
In this paper we are concentrating on the twelve emerging markets, which are part of the EU’s largest enlargement ever. The countries concerned are: the Czech Republic, Cyprus, Estonia, Hungry, Latvia, Lithuania, Malta, Poland, Slovakia and Slovenia (EU members since 1st May 2004) along with Bulgaria and Romania (EU members since 1st January 2007). These CEE countries have been in process of liberalization from the communist regime at the end of the 1980s through to the beginning of the 1990s. During this time the CEE countries have established functioning stock markets as part of the transaction process. Throughout the process of preparing for admission to EU these equity markets have been modelled along similar paths of joining procedures to those in developed market economies.
According to the FTSE group, the Czech Republic, Hungary and Poland are regarded as Advanced Emerging Markets Economies. Of these, the Czech Republic has the most developed and industrialized economy in CEE. The aim of this research is to relate the remaining nine emerging markets of the EU to the above three, with Czech Republic being the primary reference point. We explore a number of important aspects of portfolio selection and investment opportunities and their implications for CEE based investors through cointegration analysis of these markets pre- and post- EU expansion. This paper specifically deals with inter-relationships between our twelve emerging markets and does not attempt to include any developed markets. This could form the basis of a further study which we recommend in our conclusions.
2. Literature Review
Various aspects of equity market relationships have been explored, including volatility spillover effects, market correlation structures or market efficiency, and financial crisis contagion. Also the aspect of cointegration between markets has been broadly analysed. (For a discussion of this type of approach, see Allen and MacDonald (1995)) A great number of studies have investigated possible linkages between the world’s developed markets and in particular US and European stock markets. Authors have mainly used cointegration techniques to examine linkages and long-term relationships between developed and emerging markets. Among them are Scheicher (2001), Gilmore and McManus (2002, 2003), Gilmore, Lucey and McManus (2005), Voronkova (2004), Egert and Kocenda (2007), Syriopoulos (2007) and Fadhlaoui, Bellalah, Dherry, and Zouaouii (2009). The study of linkages between the principal emerging stock markets in Europe, namely the Czech Republic, Hungary and Poland, has been conducted by Scheicher (2001), who compared those three markets to the Fiancial Times (FT) index. He reported on the Granger Causality test and found similar influencing patterns between the countries studied, with FT having an impact in all three countries. Scheicher observed shocks’ persistance and found that that in less than one week there is no measurable reaction to the innovations, and these results hold in all three main European markets.
2
Gilmore and McManus (2002) examined the posibility of diversification benefits for US investors in the three most important Central European equity markets, namely the Czech Republic, Hungary and Poland. They concluded that US investors can get a higher level of returns from diversification in CEE markets since thereis no evidence of multilateral cointegrateion for those markets. In their publication in 2003 they, as the first ones, looked for evidence of long-term links of the equity markets of the Czech Republic, Hungary and Poland with the German market. Again they found lack of cointegration. However, in a time period which includes the 2004 expansion, Gilmore, Lucey and McManus (2005) examined bilateral and multilateal cointegration properties of the German market and the three major CEE countries, and found evidence of an emerging long-term relationship between the German and UK markets and the Czech Republic, as well as cointegration within the group of CEE markets.These results are supported by Egert and Kocenda (2007) who reported no robust cointegrating relationship between the relatively new markets of the Czech Republic, Hungary and Poland and the developed ones of Germany, UK and France.
Another study on the existence of long-term relationships between the three CEE markets of the Czech Repuclic, Hungary and Poland and the three developed markets of France, Germany and UK was undertaken by Voronkova (2004). She found evidence of stronger cointegration relationships than had previously been reported. As her paper accepted a more general view of cointegration, the author supported the hypothesis that the emerging CEE markets have become increasingly integrated with world markets. She claimed that international investors should be aware of the implications of this closer international integration for the purpose of risk management strategies.
Chelley-Steeley (2005) found evidence of markets moving away from the segmentation process in the equity markets of Hungary, Poland, the Czech Republic and Russia. While applying the variance decomposition model, the author found evidence of increased market integration.
Fadhlaoui, Bellalah, Dherry, and Zouaouii (2009) examined short and long-term relationships between G7 developed and three Central European emerging markets. The results showed no cointegration between the developed and emerging markets. These results indicate that the increase in financial integration degree and comovements between equity markets has not significantly affected the expected benefits from international diversification in these emerging markets. They explained these results, firstly by the recent emergence of those markets after liberalization from the communist regime in the 1990s, and secondly by the weak economic and financial relationship between the economies of these countries as a group with the economies of developed countries.
Another important topic for discussion is the implementation of one currency, € (euro), across the CEE countries and becoming a member of EMU. In 2007 Slovenia was the first of the studied twelve countries to adopt the European currency, followed by Malta and Cyprus in 2008, Slovakia in 2009 and Estonia in 2011. All the others are progressing towards being accepted into the EMU in the near future. Yang, Min and Li (2003) found that the long-run linkage between eleven developed European markets and the US generally strenghtened after the EMU, because long-run relationships are restored more quickly after system-wide shocks.This is evidenced by the non-member country (UK) showing lessened linkages. At the same time the athours agree that it is diffucult to disentangle the impact of the EMU from other channels that also might affect European stock market integration. A similar conclustion is found by Hardouvelis, Malliaropulos and Priestly (2006), who support the finding of increased stock market integration. Conversely, Syriopoulos (2007) found no dramatic shocks or any particular impact in the post-EMU period while testing cointegration relationships between the emerging markets of Poland, the Czech Republic, Hungary, Slovakia and the developed ones of Germany and the US.
Jorion and Goetzemann (1999) suggested that many emerging markets are actually re-emerging markets that for various reasons have gone through a period of relative decline. They pointed out that Poland, Romania and Czechoslovakia had active equity markets in the 1920s prior to being subsumed into the Eastern block. This means that the attractive returns apparently offered by emerging markets may be a temporary phenomenon, an observation they backed up by simulations.
Overall, the majority of past studies on stock market comovements and integration have concentrated mainly on mature developed markets or advanced emerging markets such as the Czech Republic, Hungary and Poland whilst the behaviour and inter-relationship of all others has been neglected. Little attention is given to the investment potential in CEE equity markets only. Thus the literature lacks a model which analyses the interaction and integration of these markets at a regional and global level. The purpose of this paper is an attempt to fill this gap.
In this paper, we examine the short and long run behaviour of CEE emerging stock markets and assess the impact of the EU on stock market linkages as revealed by the time series behaviour of their stock market indices. This includes the Johansen procedure, Granger Causality tests, Variance Decompositions and Impulse Response analyses. We also attempt to estimate an error correction model to integrate the dynamics of the short-run with the long-run adjustment process.
3. Description of the Data
The statistical data in this study consists of the daily stock market indices of the twelve CEE stock markets1 (Bulgaria, Czech Republic, Cyprus, Estonia, Hungry, Latvia, Lithuania, Malta, Poland, Romania, Slovakia and Slovenia). The data is obtained from DataStream’s database for the period from January 1, 1995 to May 16, 2011. The twelve countries joined the EU during the latest two enlargements which took place on 1st May 2004 for the Czech Republic, Cyprus, Estonia, Hungry, Latvia, Lithuania, Malta, Poland, Slovakia and Slovenia and 1st January 2007 for Bulgaria and Romania. Based on those two accession dates the sample period is divided into three phases: one pre-EU period (1st Jan 1995 -30th Apr 2004) and two post-EU periods (1st May 2004 - 16th May 2012 for the first enlargement and 1st Jan 2007 - 16th May 2012 for the second and final enlargement). One common currency, the euro is used to express stock market
3
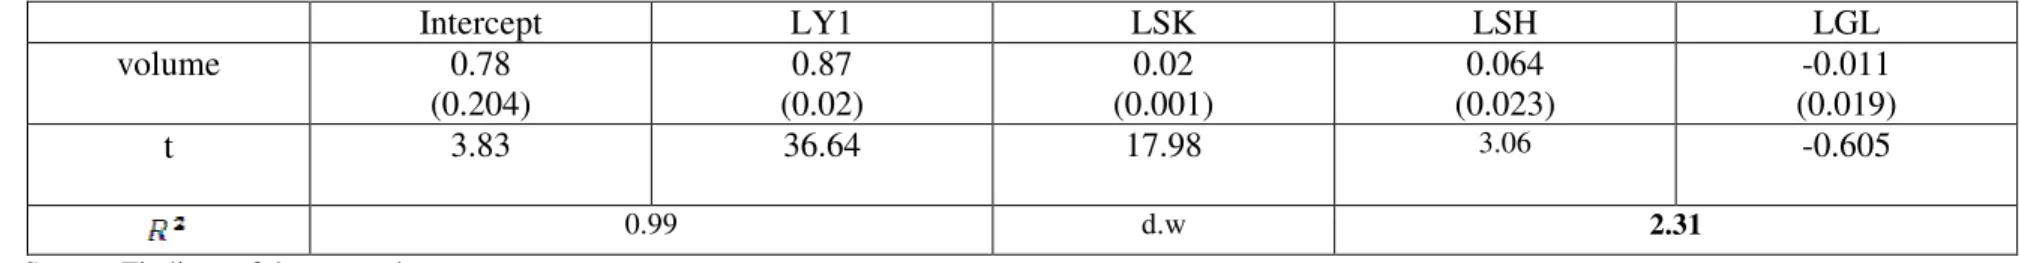
prices in order to provide comparable findings (after Scheicher (2001) and Syriopouls (2007)). The common currency is assumed for a euro-based investor, who does not hedge currency risk. Hata! Başvuru kaynağı bulunamadı. provides some information on the stock exchanges of the twelve markets, such as market capitalization, number of companies and turnover. The CEE stock markets show a growing trend. Stock valuations appear to be at a reasonable level, but the size and liquidity of the markets remain comparatively low in comparison to international markets.
4. Empirical Methodology
4.1 Non-stationarity of time series
A necessary condition in the cointegration analysis is to test each series for the presence of unit roots, which indicates whether the series are nonstationary and integrated of the same order. Therefore, we undertake this using the Augmented Dickey-Fuller test (1981), which is a modified version of the pioneer work of Dickey and Fuller (1979) and the Phillips-Perron (1988) non-parametric test. We employ Akaike Information Criterion and Schwarz Bayesian Criterion to select the appropriate lag length.
4
4.2 Cointegration analysis
Cointegration assesses the long-run link between economic variables. Cointegration of two or more time series suggests that there is a long-run or equilibrium relationship between them. Therefore, the economic interpretation of cointegration is that if two or more series are linked to form an equilibrium relationship spanning the long-run, then, even though the series themselves may be non-stationary, they move closely together over time and their difference will be stationary. Their long-run relationship is the equilibrium to which the system converges over time, and the error term can be interpreted as the disequilibrium error or the distance that the system is always from equilibrium at time . Cointegration has emerged as a powerful technique for investigating common trends in multivariate time series, and provides a sound methodology for modelling both long-term and short-term dynamics in a system. In this paper we applied the Johansen (1991) cointegration testing framework to determine those relationships among all variables of the twelve CEE stock markets.
4.2.1 Johansen Cointegration Test
Let denote a vector that includes n non-stationary variables (n = 11 for pre-EU series data and n = 12 for post-EU series data in this study). Assuming existence of cointegration, the data generating process of can be appropriately developed in an error correction model (ECM) with lags, we can express this using a general VAR model with k lags:
(1)
where represents the difference operator ( ), is a (n × 1) vector of prices, is a (n × n) coefficient matrix whose rank determines the number of cointegrating relationships, is a (n × n) matrix of short-run dynamics coefficients and is a (n × 1) vector of innovations. If the coefficient matrix has reduced rank r < n, then there exist n × r matrices α and β each with rank r such that and is stationary. is stationary in a case when r = 0 which is equivalent to . However, if the rank r = n, the coefficient matrix is of full rank and the variables are non-stationary. r is a number of cointegrating relationships, the elements of α are known as the adjustment parameters in the vector error correction model (VECM) and each column of β is a cointegrating vector.
4.2.2 Vector Error Correction Model
Once the cointegration relationship is established, a vector error correction model (VECM) can be estimated. VECM is a restricted VAR designed for use with non-stationary series which are known to be cointegrated. The VECM has cointegration relations built into the specification so that it restricts the long-run behaviour of the endogenous variables to converge to their cointegration relationships while allowing for the short-run adjustment dynamics. The cointegration term is known as the error correction term (ECT) since the deviation from long-run equilibrium is corrected gradually through a series of partial short-run adjustments. In the presence of cointegration, the coefficient matrix can be express as a system of two matrices and defined as . Thus the equation (1) can be rewritten in the below form:
(2)
where α is a k × n matrix which represents the speed of adjustment of the cointegrated variables towards their equilibrium value, which also is known as ECT. A low value of α implies a fast adjustment to the long-run equilibrium.
4.3 Granger Causality
The Granger causality test is a technique for determining whether one time series is useful in forecasting another (Granger, 1969). Let be the conditional probability distribution of given the bivariate information set consisting of an Lx-length lagged vector
the bivariate of , say , and an Ly-length lagged vector of say . Given
lags Lx and Ly, the time series does not strictly Granger cause if:
(3)
If the above equation does not hold, then knowledge of past Y values helps to predict current and future X values, and Y is said to strictly Granger cause X. Bivariate regression for all possible pairs of (X,Y) series in the group can take a form of:
(4)
where and are white noises, p is the order of the lag for Y and q is the order of the lag for X. The test statistic is the standard Wald F-statistic which is calculated for joint hypothesis: for each equation. The null hypothesis is that x does not Granger cause y in the first regression and that y does not Granger cause x in the second regression.
4.4 Forecast Error Variance Decomposition
Forecast variance error decomposition (FEVD) indicates the amount of information each variable contributes to the other variable in VAR model and determines how much of the forecast error variance of each of the variable can be explained by exogenous shocks to the other variables. This method provides a direct test on the information asymmetry pattern in the short-run dynamics sense (Yang, 2003). If a
5
market informationally leads other, this market’s returns should most significantly be explained by its own innovations and not as much by other markets’ innovations. Instead, innovations from this market should be able to significantly explain other market returns.
If the MA representation in the first difference is given by
(5)
where is the coefficient matrices in the MA representation (as demonstrated in Lutkepohl, 1991 and forwarded by Pesaran and Shin, 1998), the n-step ahead generalized forecast error variance decomposition of variable i due to the shock in variable j in the VAR is given by
(6)
where i,j = 1,2, ...,p; is the iith element of the variance-covariance matrix Σ; is the selection vector defined as where 1 is the ith element in selection vector; is the ith diagonal element of the matrix , which also enters the persistence profile analysis.
4.5 Impulse Response
The concept of generalized impulse response (IR) function is set out in Pesaran and Shin (1998) where was shown that the concept can be applied to multvariate models such as VAR. This analysis deal with the three main issues. Firstly answer the question how the dynamic system was hit by shocks at time t. Secondly, investigate the state of the system at time t−1, before the system was hit by shocks. And finally ilustrate the expectations about future socks and how system might react over the interim period from t + 1 to t + N. For this puprose equation (6) can be written as the sum of squares of the generalized responses of the shocks to the ith equation on the jth variable in the
model, namely , where is given by
(7)
Above equation represents the generalized IR function of a unit shock at the horizon N. The generalized impulse responses are invariant to the ordering of the variables in the VAR. It is also worth to note that the two impulse responses coincide only for the first variable in the VAR, or when Σ is a diagonal matrix.
5. Empirical results
5.1 Cointegration analysis
The first stage in the Johansen procedure is to test whether the time series are stationary. We tested for the presence of unit roots, where the null hypothesis of the ADF and PP tests assume that the series has a unit root and is non-stationary. We found all the price series to be first order integrated (I(1)) and the return series to be stationary at the 5% significance level. For brevity we do not present the full results here. 2
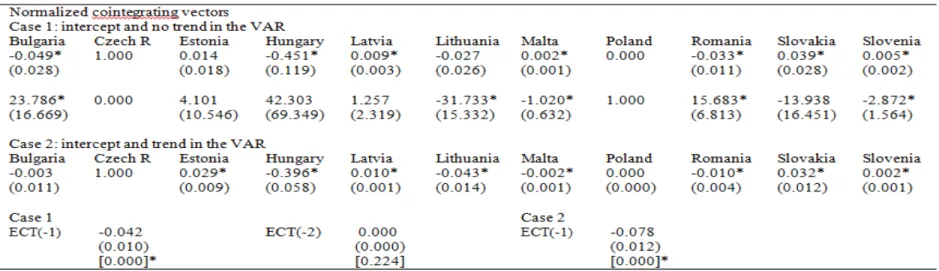
The next step is to determine whether a group of CEE emerging markets is cointegrated or not. For this purpose a VECM is estimated for each sub-period discussed in the study3. Two alternative models have been chosen to compare the behaviour of data series: the first a model of unrestricted intercept and no trend specifications (Case 1) and the second model of unrestricted intercept and trend specifications (Case 2). To find existence of cointegrated vectors we applied standard maximum eigenvalue and trace test statistics. Those two statistics test the null hypothesis of r (number of cointegrating vectors) against the alternative hypothesis of n cointegrating relations. The empirical findings support the presence of at least one cointegrating vector in the pre-EU as well as in the post-EU period (in both scenarios). There are two cointegrating vectors in Case 1 for pre-EU period and in Case 2 for post-EU: 2004-2011 period4. The presence of cointegrating vectors confirms the existence of a long-run relationship between CEE markets.
6
Table 2: VECM for pre-EU period, 1995-2004
Note: number of cointegrating vectors r = 2 (Case 1) and r = 1(Case 2); normalized cointegrating vector shows the coefficient value with its asymptotic standard error in parentheses; ECT shows the coefficient value with its standard error in parentheses and t-ratio in square brackets; * indicates significance at 5% level; ^ indicates significance at 10% level
For the pre-EU data, the statistic suggested two (Case 1) and one (Case 2), cointegrating vectors at the 5% significance level. Given this evidence in favour of at least one cointegrating vector, the data was normalized on the Czech Republic and Polish stock markets for Case 1 and on the Czech Republic market for Case 25 and was found to have a combination of negative and positive cointegrating vector values while Poland’s variable equals zero (Table 2). Even though we developed and analysed two different case scenarios all of the results are similar in the specification of the error correction form. This implication provides evidence for the limits of portfolio diversification amongst those stock markets because they move closely together in the long run and share common trends. The coefficient of ECT has been calculated and equals -0.042(0.010) and -0.078(0.012) in Case 1 and Case 2 respectively, is statistically significant, but rather small, suggesting that it would take a long time for the equation to return to its equilibrium once it is shocked.
For the post-EU: 2004-2011 period, the statistic test indicates one (Case 1) and two (Case 2) cointegrating vectors at the 5% significance level. As previously, we normalized the data in a similar way as for the previous case, however the outcome is different. We found a significant negative cofactor for most of the CCE markets, including Bulgaria, Cyprus, Estonia, Hungary, Latvia, Malta, Poland and Slovakia. A different finding is that the Lithuanian and Romanian coefficients are positive (see Table 3) and only the coefficient sign of Slovenia changes depending on the case scenario. In summary, during the years 2004-2011, post-EU phase, there is no evident difference to the values in the long-run variables regardless of the case scenario. We normalized the second cointegrating vector on the Polish data but found no significance at a 5% level, so for brevity we do not show the full results here. The results for the VECM are presented in Table 3. The coefficients of the ECT, 0.009(0.003) and 0.008(0.003) respectively of case scenario, are statistically significant but again very small, which indicates a slow returning to the equation’s equilibrium.
The above results for the post-EU: 2004-2011 period are broadly in line with the post-EU:2007-2011 period (compare Table 3 with
Hata! Başvuru kaynağı bulunamadı.). The one difference is observed for the Cyprus coefficient of the cointegrating vector, which now is
positive. The ECT is again positive but small and equal to 0.010(0.005) in both cases.
In terms of the speed of adjustment of the CEE emerging markets, all the stock markets in pre-EU and post-EU periods adjust back to the long-run equilibrium very slowly, with the pre-EU period having the fastest adjustment speed of nearly 8% as compared to the 1% of post-EU period. Interestingly we found the coefficient of the ECT sign changes between pre- and post-EU periods from negative to positive.
Table 3: VECM for post-EU period, 2004-2011
Note: number of cointegrating vectors r = 1 (Case 1) and r = 26 (Case 2); normalized cointegrating vector shows the coefficient value with its asymptotic standard error in parentheses; ECT shows the coefficient value with its standard error in parentheses and t-ratio in square brackets; * indicates significance at 5% level; ^ indicates significance at 10% level
7
Table 4: VECM for post-EU period, 2007-2011
Note: number of cointegrating vectors r = 1(Case 1 and 2); normalized cointegrating vector shows the coefficient value with its asymptotic standard error in parentheses; ECT shows the coefficient value with its standard error in parentheses and t-ratio in square brackets; * indicates significance at 5% level; ^ indicates significance at 10% level
In general we found that the number of cointegrating vectors remains the same in all the studied sub-periods and is equal to one. Even though there is evidence for two cointegrating vectors on some occasions, there is no significance in the normalized vector form solutions or the ECT is not conclusive but equal to zero. Therefore the conclusion on the impact of the EU enlargement on stock market linkages is not straightforward. However, as there is a presence of at least one cointegrating vector, this indicates that in all sub-periods a long-run relationship exists between all twelve studied stock market indices. The evidence of cointegration has several important implications. First of all, based on diagnostic tests, superior correlation has been ruled out. This means that relationships in which variables have no direct causal connection are eliminated; subsequently opening the alley to the existence of a unique channel for either uni-variate or bi-variate Granger causality effects. Secondly even where economic theory posits a long-run equilibrium function for a variable, disequilibrium could exist in the short run, as the cointegration vector does not capture the dynamic responses to the system. While the cointegration vector captures the long-run relationship between variables, it does not capture the dynamic response. These are encompassed by the ECT (as a part of ECM analysis), which is meant to measure the short-run movements in the dependent variable in response to fluctuations in the independent variables and measures the speed of adjustment of the dependent variable to its long-run value. Thirdly, the investors have a difficult task in setting up their portfolios as several stock markets present similar behaviour with regards to internal and external shocks. This limits the diversification effects as stock markets move closely together in the long run and share common trends. This is also an answer to the market globalization process of increasing economic integration between countries which could lead to a single European market. Finally, cointegrated stock market indices approach a common long-run equilibrium path, as common macro and micro economic policies are more integrated following EU regulations.
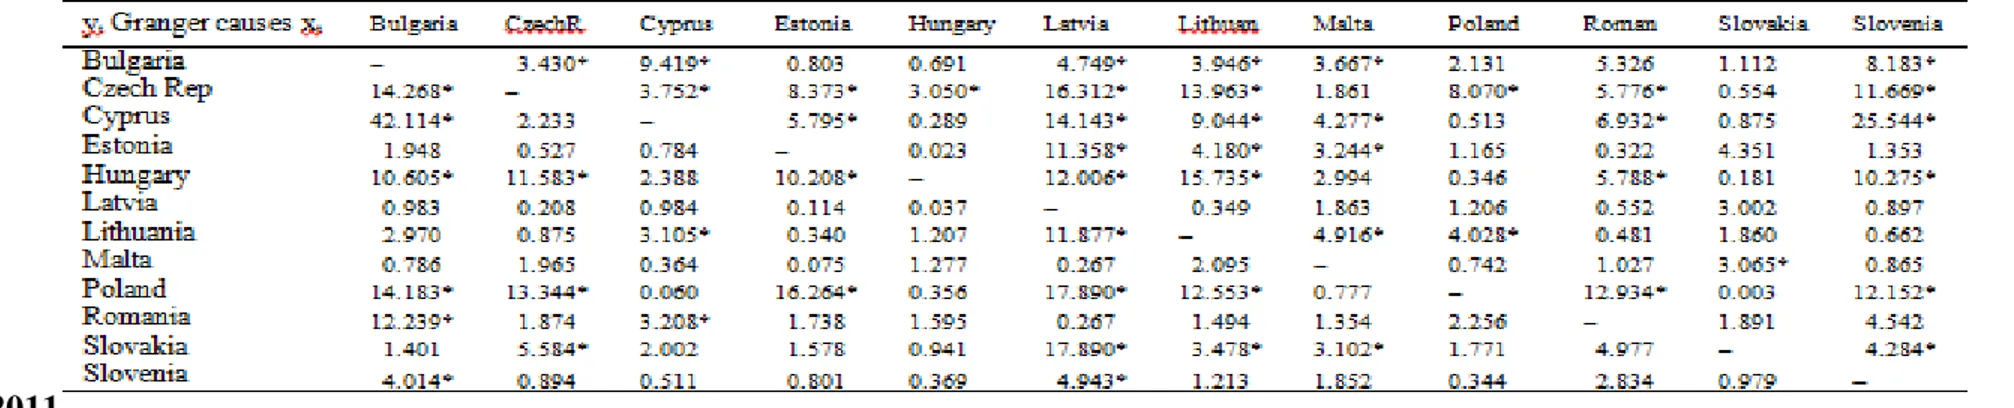
5.2 Granger Causality
The Granger causality test was applied to the first difference of the twelve stock markets in all sub-periods. Since the test is highly sensitive to the lag length level, the AIC selection criterion was used as reasonable estimate of the longest time over which one of the variables could help predict the other.
Table 5 shows results for the pre-EU Granger causality test based on the eleven-dimensional vector autoregression with one lag. Granger causality implies the highest influence to be that of the Czech Republic stock market over the other five CEE markets, namely Estonia, Hungary, Lithuania, Poland and Slovenia. There are also uni-variate Granger causality patterns as follows: Bulgaria influences Romania, Estonia influences Hungary and Lithuania, Hungary influences Lithuania and Slovenia, Poland influences Bulgaria and finally Slovakia influences Hungary. There is no evidence of bi-variate Granger causality during this time frame. We also found that the four stock markets of Latvia, Lithuania, Malta and Romania have no influence on any other stock markets.
The post-EU period (2004-2011) Granger causality test is based on the twelve-dimensional vector autoregression with two lags, are results are presented in
Table 6. On this occasion we found that the highest influence among the developed emerging markets is exerted by the Czech Republic, Hungary and Poland on the other CEE markets. All of the CEE markets affect changes in the seven other stock markets, and between them only one feedback effect is observed, which exists between the Czech Republic and Poland. It is worth mentioning here, that as Hungarian and Polish stock markets have such a strong influence on other stock markets, the two markets do not appear to significantly influence each other. All the other causality effects are presented in
8
Table 6. As for pre-EU period we do not account for feedback effect, in post-EU phase this bi-variate effect is observe for a number of markets and mostly relates to Bulgaria and Romania. We established that the Maltese stock market is isolated from all others, as it is the only one which does not appear to be caused by the others, nor does it have any influence on them.
For the other post-EU period 2007-2011, the results seems are somewhat different (refer to Table 7). The Granger causality effect is very strong again for the Czech Republic, which seems to have taken a lead role among all studied CEE countries. The role of Bulgarian and Cyprus stock markets is also significant as they influence six and seven other stock markets respectively. There are bi-variate effects between several countries, but this mostly relates to Bulgaria, Cyprus and Czech Republic stock markets. The position of the Slovakian stock market appears to be stronger as, in comparison to the other post-EU period, it is now caused only by one stock market (Malta – feedback effect) but itself influences the five other stock markets of the Czech Republic, Latvia, Lithuania, Malta and Slovenia.
Table 5: Granger Causality test for returns, pre-EU period, 1995-2004
Table reports F-statistics (Wald statistics test); * indicates significance at 5% level
Table 6: Granger Causality test for returns, post-EU period, 2004-2011
Table reports F-statistics (Wald statistics test); * indicates significance at 5% level
Table 7: Granger Causality test for returns, post-EU period,
2007-2011
Table reports F-statistics (Wald statistics test); * indicates significance at 5% level
The presence of Granger causality between CEE countries is expected because of the strong trade, economic ties and direct investment they have with each other. Furthermore, six of those countries share the euro as a common currency, thus they share common monetary policy. The implication of finding Granger causality among the CEE stock markets is that this implies that short term profit strategies can be formulated buy investors in the sense that if Granger causality is present, a movement in one stock market causes a preceding movement in the other stock markets. As a result, predicting the movement of the stock market that is being led is possible by assessing the movement of the leading stock market. In contrast, where Granger causality is not found then interdependencies are absent among those stock markets and thus portfolio diversification is beneficial in the short run. The downside of Granger causality not being present is that short term profit strategies cannot be formulated because the movement of one stock market does not cause a movement in another stock market.
9
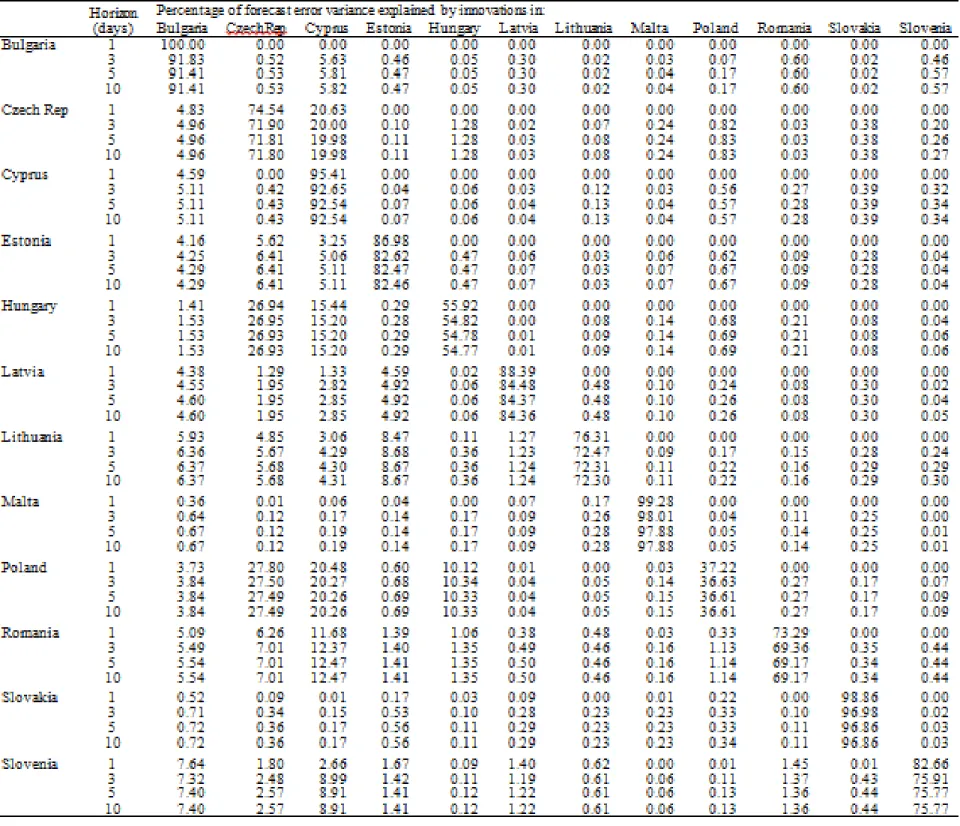
The variance decomposition results of 1-day, 3-day, 5-day and 10-day horizon ahead forecast error variances of each stock market are shown in Table 8 to
Table 10. In those tables each row indicates the percentage of forecast error variance which is explained by innovations in the particular columns. The evidence of the least affected stock market could be beneficial for investors for portfolio diversification purposes.
The results in Table 8 show that in the pre-EU period the Czech Republic stock market is the most influential. While no other market studied can explain more than 1 percent of the Czech Republic error variance, the Czech Republic (based on a horizon of 5 days)explains 3.08 percent for Lithuania, 9.03 percent for Estonia, 17.18 percent for Poland and19.7 percent for Hungary of forecast error variance. On average, the Czech Republic market explains 5.33 percent of the error variance, which value can be compared with 1.36 percent for Hungary and 1.32 percent for Estonia. Besides, the Czech Republic innovation accounts for 95.91 percent of its own variance. As the Czech Republic partially explains Polish and Lithuanian stock markets, the innovation in Poland market is also explained 8.56 percent by Hungary and in Lithuania 7.83 percent by Estonia respectively. Table 8 also provides evidence that most of the studied countries act like a follower in CEE stock markets. Innovations in those markets fail to explain any substantial part of error variances of the others.
Table 8: Forecast Error Variance Decomposition of returns, pre-EU period, 1995-2004
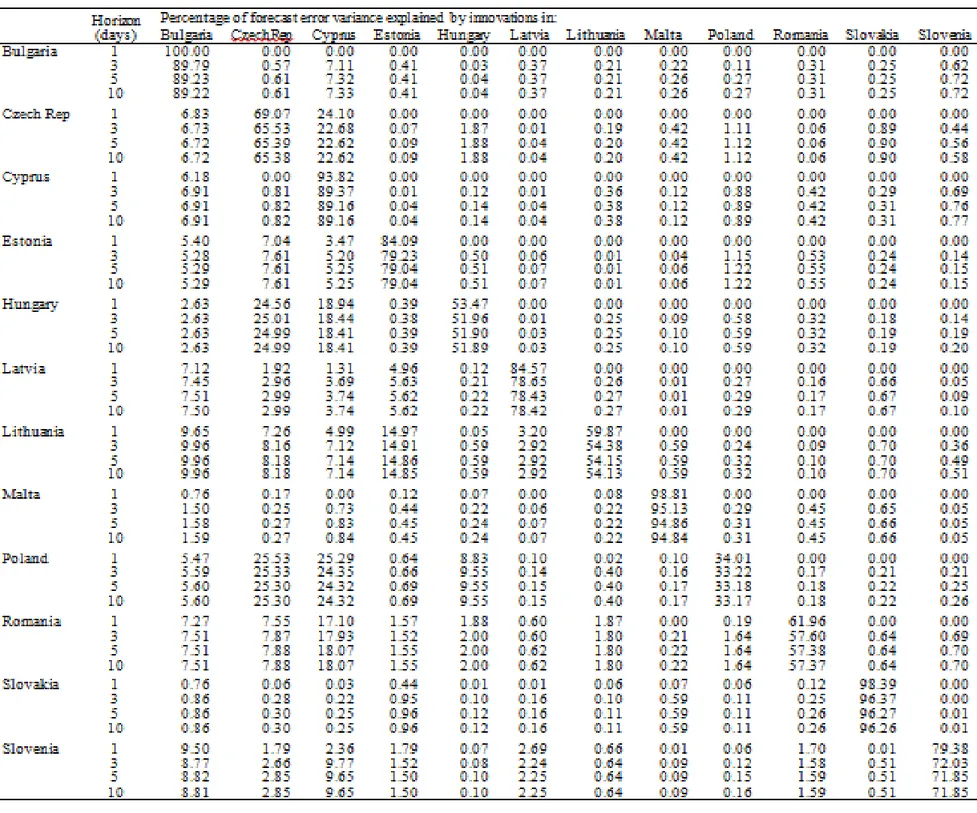
The post-EU: 2004-2011 period is mostly dominated by the two stock markets of Cyprus and the Czech Republic, which two on average can explain 8.66 percent and 7.22 percent, respectively, of the forecast error variances of the other studied CEE markets. The
10
Cyprus stock market explains nine other stocks, from 2.85 percent (for Latvia) to 20.26 percent (for Poland), at the same time explaining 92.54 percent of its own innovations. In comparison, the Czech Republic market explains shocks to the other eight, whilst explaining only 71.8 percent of its own. The other noteworthy contribution is from the Bulgarian stock market which an average explains 4.09 percent of forecast error variances of another nine. As for the previous post-EU time period there are a number of exogenous variables, as they explain more than 90% of their own innovation. The Maltese and Slovakian markets appear the most exogenous, with Poland and Hungary being the least.
11
12
Table 10: Forecast Error Variance Decomposition of returns, post-EU period, 2007-201
The post-EU: 2007-2011 period seems to be quite similar to the previous post-EU period. We can again observe a leading role of three markets: Bulgaria, the Czech Republic and Cyprus, as markets which explain the most number of shocks in the other CEE markets. The difference is only regarding the average percentage of explained variables, which now constitutes 10.69 percent for Cyprus and 5.76 percent for Bulgaria. The Czech Republic percentage stays the same. The increase in percentage value of variables explained by innovation is on average higher in comparison to the previous period, while at the same time we can observe a decrease in the percentage of self explained variables.
5.4 Impulse Response
The pattern of dynamic responses of each CEE stock market is presented in
Figure 1 to
Figure 3. These graphs illustrate to what extent the shock of one market is persistent in terms of its effect on the other markets in the system. The impulse response function of each CEE market is traced over a ten day time frame from a unitary standard deviation shock.
13
Figure 1: Impulse Response of CEE stock market to Cholesky One S.D. Innovations, pre-EU period, 1995-2004
Note: Eleven lines on above graphs are representing markets of Bulgaria, Czech Republic, Estonia, Hungary, Latvia, Lithuania, Malta, Poland, Romania, Slovakia and Slovenia accordingly.
The response to shocks of most of the markets in the pre-EU period seems to cause very small or almost no fluctuations in any other markets (see
Figure 1). We can observe some responsiveness of Poland to innovations which affect Hungary and the Czech Republic. Those innovations in the Polish stock market are rapidly transited to all the other markets, however after day 3 they fade away. Similar behaviour is observable for Estonia and Hungary, where innovations are transmitted to the Czech Republic, Malta, Lithuania, Romania, Slovakia and Slovenia. Conversely in those cases the responses to shocks are quicker and they diminish after day 2.
14
Figure 2: Impulse Response of CEE stock market to Cholesky One S.D. Innovations, post-EU period, 2004-2011
Note: Twelve lines on above graphs are representing markets of Bulgaria, Cyprus, Czech Republic, Estonia, Hungary, Latvia, Lithuania, Malta, Poland, Romania, Slovakia and Slovenia accordingly.
A different pattern appears after EU enlargement in 2004. Results in
Figure 2 illustrate significant responses in several markets. In comparison to the previous period, almost all markets respond dramatically to Polish shocks in the first few days and then rapidly taper off. A similar pattern of responses is observed for shocks in Romania, Lithuania and Slovenia. The responsiveness to shocks in the Czech Republic and Hungary seems to be significant as they influence each other as well as Cyprus and Bulgaria. Slovakia and Malta appear to be isolated, with shocks in these markets not impacting other markets. This pattern is also apparent for the post-EU, 2007-2011 phase.
15
Figure 3: Impulse Response of CEE stock market to Cholesky One S.D. Innovations, post-EU period, 2007-2011
Note: Twelve lines on above graphs are representing markets of Bulgaria, Cyprus, Czech Republic, Estonia, Hungary, Latvia, Lithuania, Malta, Poland, Romania, Slovakia and Slovenia accordingly.
In view of our findings that many of the responses are complete in about three days after a shock, the pattern of impulse response emerging from the VAR analysis seems to be broadly consistent with the concept of informationally efficient European stock markets. Implications for investors are that it would be difficult to earn unusual profits by investing in a particular market, knowing that information is available at the time the investment is made.
6. Conclusion
In summary, having established that all stock indexes are I(1) variables, our VAR analysis significantly rejects non-cointegration among all alternative sets of twelve stock markets. The Johansen analysis produces evidence of at least one cointegrating vector in existence. Results from the VECM are consistent with the FEVD, showing a greater degree of integration between CEE emerging markets after accession to the EU. The Impulse Response function illustrates that the shocks’ impact on returns dies out in less than one week. Granger causality relationships have also been indentified between CEE markets, showing dominance of the more advanced emerging markets of the Czech Republic, Hungary and Poland. The significance of those three markets has already been recognized by the FTSE and MSCI groups as advanced emerging markets. Furthermore, Estonia has developed into a strong international player through its membership in the EU. On the other hand the Maltese and Slovakian stock markets appear to display more self-directed independent behaviour than their peers.
As the majority of past studies on stock market comovements and integration have concentrated mainly on mature developed markets or advanced emerging markets only, we tested the behaviour and inter-relationship of CEE emerging markets only. We can argue that our results show growing investment potential in those equity markets and provide good opportunities for European investors as well as important indications for economic stability, growth and integration of the CEE markets in the post-EU period. We detected no dramatic shocks during the accession phase in the post-EU period. This could be explained by the fact that those macroeconomics policies have been subject to an adjustment process for a long period of time. Throughout the process of preparing for admission to the EU these equity markets have been modelled along similar paths of joining procedures to those in developed market economies. Moreover, we documented regional integration among the twelve countries. Given this information, EU based investors may observe stock market behaviours in one group of markets as one investment opportunity instead of single separate classes of assets. Ideally, an investor based in the more developed markets of the EU would like to be able to invest in these Euro-denominated ‘emerging markets’ and benefit from risk diversification. Paradoxically, the diversification benefits appear to be reduced in terms of the findings of increased cointegration. On the other hand, there is also evidence of a lowering of average risk, in terms of variance based measures post-joining the EU.
Those emerging markets are progressing very rapidly in their reforms and stability in domestic economies while in the process of becoming members of the EU. Please remember that the aim and the greatest achievement of creation of the EU is to develop a single
16
market through a standardised system of laws which apply in all member states. Thus restrictions between member countries on trade and free competition have gradually been eliminated. As an outcome of those reforms and expansion, the EU has more influence on the world stage when it speaks with a single voice in international affairs.
A future extension of our study will consider the effects of developed markets on our cointegration analysis with the objective of verifying the assumption that the relationships between emerging EU markets would be broadly preserved.
Notes
1. SOFIX (Bulgaria), SEPX (Czech Republic), CYSE (Cyprus), OMX Tallinn Stock Exchange (Estonia), BUX (Hungry), OMX Riga Stock Exchange (Latvia), OMX Vilnius Stock Exchange (Lithuania), MSE (Malta), WIG (Poland), BET (Romania), SAX (Slovakia) and SBI (Slovenia)
2. The unit root test results are available on request. The optimal lag length is determined by usage of the Akaike Information Criteria (AIC)
3. The optimal lag length is determined by usage of the AIC in the VAR model and the following have been chosen: VAR(2) for pre-EU period, VAR(3) for 2004-2011 post-pre-EU period and VAR(2) for 2007-2011 post-pre-EU period.
4. Our analysis is based on the maximum eigenvalue test statistics, as only from these statistics we can get significant values in the VECM. An analysis of trace test statistics showing no significance at all (test results are available on request).
5. In the case of one cointegrating vector, the model has been normalized on the Czech Republic data, as the most advanced emerging market; the FTSE group classified this market as advanced. In the case of two cointegrating vectors three markets have been taken into account: Czech Republic, Hungary and Poland, as those three are classified as advanced emerging markets. The combinations of two have been analyzed, and cointegrating vectors have been normalized as: Czech Republic and Hungary, and Czech Republic and Poland. However, results presented in this paper only include Czech Republic and Polish markets, as the other analysis showed no significance for cointegrating vectors. Calculations are available on request.
6. Table 3 reports only one normalized cointegrating vector as the other one showing now significance at 5% level.
References
Allen, D. E., & MacDonald, G. (1995). The long-run gains from international equity diversification: Australian evidence from cointegration tests. Applied Financial Economics , 5, 33-42.
Capiello, L., Engle, R. F., & Sheppard, K. (2006). Asymmetric Dynamics in the Correlations of Global Equity and Bond Returns.
Journal of Financial Econometrics , 4 (4), 537-572.
Chelley-Steeley, P. L. (2005). Modeling equity market integration using smooth transition analysis: A study of Eastern European stock markets. Journal of International Money and Finance , 24, 818-831.
Dickey, D. A., & Fuller, W. A. (1979). Distribution of the estimators for autoregressive tome series with a unit root. Journal of the
American Statistical Assiciation , 74, 427-431.
Dickey, D. A., & Fuller, W. A. (1981). Likelihood ratio statistics for autoregressive time series with unit root. Econometrica , 49, 1057-1072.
Egert, B., & Kocenda, E. (2007). Interdependance between Eastern andWestern European Stock Markets: Evidence from Intraday day.
Economic Systems , 31, 184-203.
Engle, R. F., & Granger, C. W. (1987). Co-integration and error correction: representation, estimation, and testing. Econometrica , 55 (2), 251-276.
Fadhlaoui, K., Bellalah, M., Dherry, A., & Zouaouii, M. (2009). An Empirical Exmination of International Diversification Benefits in the Central European Emerging Equity Markets. International Journal of Business , 14 (2), 163-173.
Gilmore, C. G., & McManus, G. M. (2003). Bilateral and Multilateral Cointegration properties between the Geramn and Central European Equity Markets. Studies in Economics and Finance , 21 (1), 40-53.
Gilmore, C. G., & McManus, G. M. (2002). International portfolio diversification: US and Central European equity markets. Emerging
Markets Review , 3, 69-83.
Gilmore, C. G., Lucey, B. M., & McManus, G. M. (2005, March). The Dynamics of Central Equity Market Integration. IIIS Discussion
paper No.69 .
Granger, C. (1969). Investigating casual relations by econometric modelss and cross-spectral metods. Econometrica , 3 (37), 424-438. Hardouvelis, G. A., Malliaropulos, D., & Priestly, R. (2006). EMU and European Stock Market Integration. Journal of Business , 79 (1), 365-392.
Johansen, S. (1991). Estimation and Hypothesis Testing of Cointegration Vectors in Gaussian Vector Autoregressive Models.
Econometrica , 59, 1551-1580.
Johansen, S. (1988). Statictical analysis of cointegration vectors. Journal of Economic Dynamics and Control , 12, 231-254.
Johansen, S., & Juselius, K. (1990). Maximum likelihood estomation and inference on cointegration with application to the demand for money. Oxford Bulletin of Economics and Statistics , 52, 169-210.
Jorion, P., & Goetzemann, W. (1999). Re-emerging markets. Journal os Financial and Quantitative Analysis , 34 (1), 1-32. Lutkepohl, H. (1991). Introduction to Multilpe Time Series Analysis. Berlin, Heidelberg: Springer-Verlag.
Pesaran, M. H., & Shin, Y. (1998). Generalized impulse response analysis in linear multivariate models. Economics Letters , 58, 17-29. Phillips, P., & Perron, P. (1988). Testing for a unit root in time series regression. Biometrica , 75, 335-346.
17
Scheicher, M. (2001). The comovements of stock makets in Hungry, Poland and the Czech Republic. International Journal of Finance
and Economics , 6, 27-39.
Syriopoulos, T. (2007). Dynamic linkages between emerging European and developed stock markets: Has the EMU any impact?
International Review of Financial Analysis , 16, 41-60.
Voronkova, S. (2004). Equity market integration in Central European emerging markets: A cointegration analysis with shifting regimes.
International Review of Financial Analysis , 13, 633-647.
Yang, J. (2003). Market Segmentation and Information Asymmetry in Chinese Stock Markets: A VAR Analysis. The Financial Review
, 38, 591-609.
Yang, J., Min, I., & Li, Q. (2003). European Stock Market Integration: Doeas EMU Matter? Journal of Business Finance and
18
BLOCK HOLDING BY OTHER NONFINANCIAL FIRMS MITIGATES FINANCIAL CONSTRAINTS FOR INVESTMENT IN BRAZIL
Vicente Lima CRISÓSTOMO Professor, Depto Ciências Contábeis, Universidade Federal do Ceará Av. da Universidade, 2431 - CEP 60020-180 Fone: +55 85 3366 7802 / 3366 7801 (fax) E-mail: [email protected]; [email protected]
Félix Javier LÓPEZ ITURRIAGA Associate Professor of Finance and Accounting Dpto Economía Financiera y Contabilidad, Universidad de Valladolid Avda Valle de Esgueva, 6, 47011 Valladolid, Spain, Phone: +34983184395, Fax: +34983183830 E-mail: [email protected]
Eleuterio VALLELADO GONZÁLEZ, Associate Professor of Finance and Accounting, Dpto Economía Financiera y Contabilidad, Universidad de Valladolid, Avda Valle de Esgueva, 6, 47011 Valladolid, Spain, Phone: +34983423387, Fax: +34983183830 E-mail: [email protected]
Abstract
We analyze how corporate ownership structure can contribute to mitigate the financial constraints of Brazilian firms. Based on a sample of 289 nonfinancial firms listed in the São Paulo Stock Exchange during the period 1995-2006, we confirm the existence of financial constraints on capital expenditures. Our results show that block holding by other nonfinancial firms has a beneficial effect in mitigating financial constrains. Brazilian firms can reduce financial constraints by incorporating into their ownership structure a blockholder that is an industrial or commercial company. This ownership structure favors access to external financing as it reduces asymmetric information problems that are at the origin of financial constraints.
Keywords: financial constraints, ownership structure, nonfinancial firm blockholder, cash flow, Brazil.
1 Introduction
The literature about financial constraints on capital expenditures has consistently shown the effect of such constraints on investment (Fazzari et al., 1988; Schiantarelli, 1996). Recently, a new line of research has focused on how corporate ownership structure can mitigate the effect of financial constraints (Allen and Phillips, 2000; Filatotchev et al., 2007; Goergen and Renneboog, 2001). At the same time, the literature has called attention to the need for more research to better understand the effects of agency conflicts and ownership structure on firms’ investment and financial policies (Hennessy et al., 2007; Schiantarelli and Sembenelli, 2000).
International evidence, mainly centered in developed economies, has shown that the use of internal funds by firms is a consequence of financial constraints in the USA, Germany, the UK, Canada, and Spain (Audretsch and Elston, 2002; Bond et al., 2003b; Fazzari et al., 1988; Maestro et al., 2007; Whited and Wu, 2006). Consistent evidence has also been found in the transition economies of the Czech Republic (Lízal and Svejnar, 2002), Bulgaria (Rizov, 2004a), Romania (Rizov, 2004b), and Russia (Perotti and Gelfer, 2001). However, there is a lack of research about financial constraints in developing economies where such financial constraints more often impede countries’ economic growth (Galindo and Schiantarelli, 2002; Galindo et al., 2007). As suggested by Stiglitz (1989) and Khanna and Palepu (1997, 2000) asymmetric information problems may be more severe in emerging markets due to the lack of adequate disclosure practices, weak corporate governance, and the reduced ability of market institutions to adequately assess firms’ investment projects and financial status.
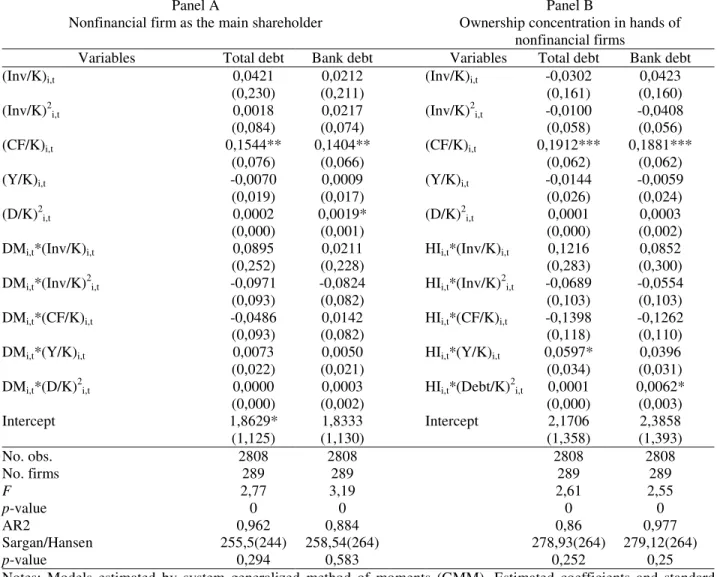
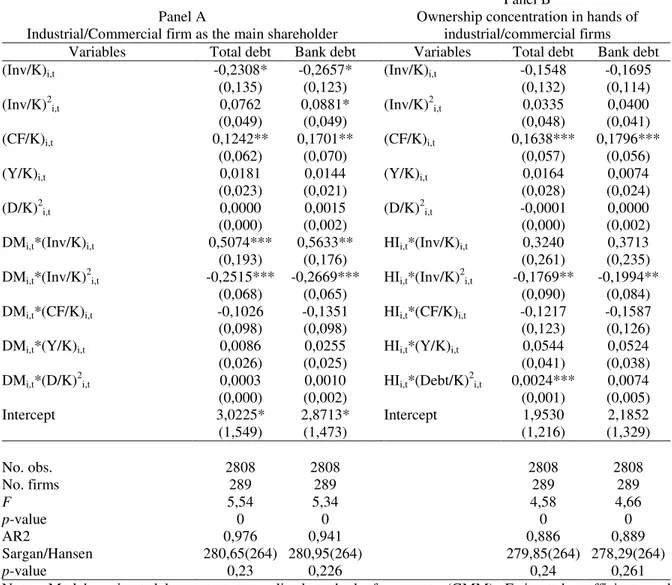
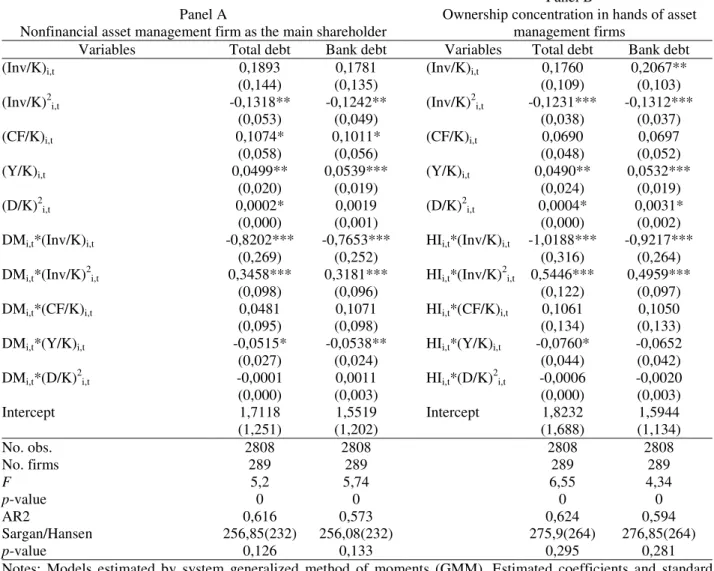
Following this promising avenue for research, our paper focuses in how blockholders could mitigate the effect of financial constraints in Brazilian firms. Our research focuses on whether block ownership by other nonfinancial firms, either as the main voting shareholder or by ownership concentration in hands of the other firms, is associated with the intensity of financial constraints. To measure financial constraints we use investment-cash flow sensitivity, as it has been previously identified as a signal of financial constraints since it is the consequence of higher costs of external finance forcing firms to use internal funds for investment (Allayannis and Mozumdar, 2004; Alti, 2003; Bond et al., 2003c; Bond and Meghir, 1994a; Fazzari et al., 1988; Schiantarelli, 1996).
We find evidence indicating the existence of financial constraints in Brazil, consistent with previous works. More important is the finding that firms with other nonfinancial firms as blockholders face fewer financial constraints than others; such positive effect is even more pronounced when such nonfinancial firms are industrial/commercial companies.
The paper is organized as follows. The second section describes the theoretical foundations and sets forth the hypotheses statements. In section 3 work method, sample and econometric models are detailed. Section 4 discusses results, and, the final section contains conclusions of the work.
2 Theoretical background and hypotheses
The Brazilian financial system has experienced dramatic structural changes since the 1990s, improving the efficiency of the financial system with positive effects in firm investment financing (Baer and Coes, 2001; Studart, 2000). The liberalization and privatization processes have attracted new investors, especially through the Brazilian stock market. Studart(2000) has documented that the volume of
19
transactions in the Brazilian stock exchange grew 741% from 1992 to 1997. Furthermore, the wave of privatizations has significantly modified the corporate ownership structure by decreasing the state participation and underling the role played by nonfinancial firm blockholders. The literature on the influence of nonfinancial firms as large shareholders, mainly centered in developed countries, has found beneficial effects in alleviating financial constraints and increasing the value of the firms (Allen and Phillips, 2000; Schiantarelli and Sembenelli, 2000). To date no research about it has dealt with the Brazilian experience.
Brazil institutional characteristics result in a high cost of external funds (Marques and Fochezatto, 2007; Omar, 2008). The protection of minority shareholders and creditors is still inadequate, while at the same time, there is evidence of high benefits of control (Dyck and Zingales, 2004). Together with the inherent asymmetric information problems in capital markets, these characteristics motivate us to formulate the following hypothesis for Brazilian firms, which is consistent with previous works about financial constraints in Brazil (Kalatzis et al., 2008; Moreira and Puga, 2000; Terra, 2003).
Hypothesis 1: Market imperfections affect firm investment policy such that firms face financial constraints for investment in Brazil.
Ownership concentration reduces financial constraints and thus improves firms’ financing policies. Higher ownership concentration, with a reduced number of blockholders, minimizes agency conflicts between managers and owners since it facilitates management monitoring and alleviates the free-rider problem, improving communication with financing markets, thus easing access to external finance (Chirinko and Schaller, 1995; Goergen and Renneboog, 2001; Schaller, 1993). Chirinko and Schaller (1995) suggest that financiers consider high ownership concentrated firms as less likely to misrepresent the quality of investment projects which is important in the bond and debt market. On the other hand, the possibility that controlling blockholders could expropriate minority shareholders may raise difficulties for equity finance (Filatotchev et al., 2007).
The identity of the blockholders, and its possible effects on investment and financing policy, has received the attention of researchers. Goergen and Renneboog(2001) present two theoretical arguments to investigate whether ownership concentration in hands of certain categories of shareholders can mitigate financial constraints. First, certain blockholders can reduce overinvestment through better managerial supervision, which can minimize the possibility of misusing internal funds. Second, information asymmetry between management and shareholders is reduced to the extent that important blockholders receive more well-timed information, which can also positively influence the relations with external creditors. There is evidence that foreign ownership, for example, is a factor that lessens difficulties of access to external finance for investment (Galindo and Schiantarelli, 2002; Harrison and McMillan, 2003; Mickiewicz et al., 2004).
There are a number of arguments favoring the presence of other nonfinancial firms in ownership. Some of them are related to strategy concerns (Allen and Phillips, 2000; Khanna and Palepu, 1997, 1999, 2000) while others are associated with agency conflicts and financing policy (Allen and Phillips, 2000; Boehmer, 2000; Jensen and Ruback, 1983; Schiantarelli and Sembenelli, 2000).
Under the strategic view, the literature finds a number of positive effects: the alignment of interests and objectives of firms sharing ownership can lead to a combination of both firms’ interests and reputations resulting in strategic alliances, the creation of a common group brand, and the improvement of a firm’s image; an integrated business group can also train their own work force, bypassing the labor market institutions’ inefficiencies; and the combined firms can use funds and management ability from their existing operations to start new ventures, overcoming the need for intermediaries such as venture capital firms.
In terms of agency conflicts and financing, there are also some positive results as a consequence of block ownership by nonfinancial firms: an increased availability of collateral for firms to support bank financing; the possibility of more active management monitoring; the reduced likelihood of fund squandering and overinvestment; the lower chance of misuse of managerial discretion; the reduction of agency conflicts between ownership and control; the possibility of mutual funding among firms; and an improvement in communication with financing markets with the reduction of information asymmetry problems causing underinvestment.
The effects of block ownership held by nonfinancial firms on investment and financing policies for developed countries are inconclusive, unlike the effects in emerging and transition economies. Hoshi et al. (1991), working with a sample of Japanese firms, have found evidence that the membership in corporate groups eases external funding; Manos et al. (2007) have found similar results in India. Allen and Phillips (2000) found evidence that in the USA the presence of a nonfinancial firm as a reference blockholder has positive effects on a firm’s level of investment and performance, as well as in reducing the intensity of financial constraints. In contrast, for British firms, the results of Goergen and Renneboog (2001) indicate that the presence of a nonfinancial firm as a large shareholder increases the use of internal funds for investment. They interpret this result as an indication of overinvestment as a consequence of benefits of control, as well as of a financial constraints problem and the blockholders’ resistance to a high leverage condition.
In Brazil there has been a significant reduction of state participation in firm ownership as a consequence of the privatization process. This process, together with other structural changes, has caused an increase in block ownership by nonfinancial firms as well as the emergence of new relevant shareholders. Specifically in the case of Brazil, such ownership may help to overcome the natural limitations of the institutional framework. (Khanna and Palepu 1997, 2000). In addition, the alignment of firms’ interests can favor internal funding between firms, as found in India by Manos et al.(2007). The market may also have a positive view of the improvement in management monitoring.