164 IEEE TRANSACTIONS ON SONICS AND ULTRASONICS, VOL. SU-32. NO. 2 , MARCH 1985
Penetration Depth of the Scanning
Acoustic Microscope
ABDULLAH ATALARAbstract-A definition for the penetration depth of the scanning re- flection acoustic microscope is given. With this definition it is possible to calculate the penetration depth of a given lens geometry for a given material. The penetration depth depends on the elastic parameters of the object, the signal-to-noise ratio, and the operation frequency of the acoustic microscope. Calculations show that for high-impedance ma- terials, the penetration depth is limited by the wavelength of the surface waves and hence by frequency. For low-impedance materials the open- ing angle of the lens can be properly selected to make the longitudinal or shear wave penetration dominant, effectively increasing the penetra- tion well above the wavelength limit of the surface wave.
I. INTRODUCTION
T
HE ABILITY to image below the surface of solids is one of the most attractive properties of the scanning reflection acoustic microscope. Subsurface imaging can be achieved by using either of two methods. One method[l], [2] involves matching the impedances of a liquid and an object to such a high degree that there is a considerable longitudinal or shear wave coupling into the object. To de- crease the surface reflections one would normally use a
narrow opening-angle lens. The pulses, which would re- flect from the plane of interest, would be selected by time- gating techniques to eliminate other pulses, such as sur- face reflections. In this way one can get images of planes below the surface by using longitudinal or shear waves. This method is not widely adopted because of the incon- venience of using heavy liquids such as galium or mercury to get the required matching. Any mismatch loss at the liquid-solid interface would directly reduce the signal-to- noise ratio. Theoretically it is possible to get longitudinal or shear wave reflections from planes below the surface even with lighter liquids such as water, provided a high signal-to-noise ratio is available [3]. In this mode of op- eration the penetration depth is limited by geometry and the attenuation coefficient of the sample. The resolution of the images will be determined by the wavelength of the waves being used and also by aberrations. One can reduce the aberrations and obtain diffraction-limited resolution by a suitably shaped aspheric lens
[4]
or by utilizing an ad- ditional spherical surface [ 5 ] .The other method 161 involves extending the lens open- ing to high enough angles in such a way to include the Rayleigh critical angle of the liquid-solid interface. This
Manuscript received April 1984; revised July 1984.
The author is with the Electrical Engineering Department, Middle East Technical University, Ankara, Turkey.
is the normal mode of many operational acoustic micro- scopes. With incoming waves at the critical angle, the sur-
face waves will be excited at the liquid-solid interface. These waves will couple back into the liquid medium to generate interference with waves directly reflecting from the surface [7]. The size of the critical angle, the amount of coupling into surface waves, and the distance from the object to the focal plane will determine what is received at the transducer. This quantity is measured through V(z)
curves, which play an important role in contrast determi- nation. Used in this mode, the images contain information about the surface as well as below the surface. Experi- mentation has shown that placing the object at the focal plane of the lens is not at all the best condition for making images. Images taken at this plane have a maximum sig- nal-to-noise ratio, but they look more or less like optical images. Going “out of focus” (away or toward the lens) will reduce the signal-to-noise ratio, but will improve the contrast and give more information about features beneath the surface. The object position for which the images give best results can be determined experimentally or theoret- ically, but it is not a fixed quantity because it depends on the elastic properties of the object. For the majority of cases the most interesting images are obtained when the object is positioned at a plane slightly closer to the lens than the focal plane. In some cases this point coincides with the first null of the V(z) curve in the
-z
direction. It was estimated that the penetration depth of the acoustic microscope is equal to the penetration of the excited sur-face waves, which is about the same magnitude as the wavelength of the surface waves. But no one has shown a concrete relationship between the penetration depth and this wavelength. One reason for this may have been the lack of a definition for the penetration depth. It is a quan- tity hard to define because it depends on many factors.
It is the aim of the present paper to give a definition for penetration depth and calculate it for various materials according to the given definition. For this purpose we will concentrate on wide-angle lenses using low-impedance liquids as the immersion media. Some changes in the pa- rameters of the acoustic lens system will be considered for optimization of the penetration depth.
11. DEFINITION OF THE PENETRATION DEPTH
One would say that the acoustic microscope can pene- trate a certain distance in a solid, if an inhomogeneity of that distance below the surface gives a noticeable contrast
ATALAR: PENETRATION DEPTH OF THE SCANNING ACOUSTIC MICROSCOPE 165
/ p
Fig. I . V(z) curves of Ni and of 1 pm of Ni on a sapphire substrate for atypical lens at 1 GHz.
change. The contrast behavior of the microscope for ob- jects with no lateral variation can be deduced from V ( z )
curves [6]. Fig. 1 shows V(z) curves calculated for a typ- ical acoustic lens for two different objects. The first object is a single crystal of Ni extending into the half space. The second is a Ni layer of known thickness over an A1203 substrate. The difference between the curves suggests that the waves have penetrated through Ni layer to sense the presence of A1203. We would like to define the depth of penetration using this difference in V(z) curves.
The definition of the penetration depth should be made considering the usual procedures in acoustic microscope operation. To see details below the surface one would nor- mally take images at various z positions and compare them with optical images. If no difference is found, the gain would be increased with a corresponding change in the dc offset, One can play this “increase-the-gain-and-shift-the-
offset” game until the signal-to-noise ratio or mechanical stability limits it. Our definition should therefore take the signal-to-noise ratio into account.
In Fig. 1 it is observed that there is a negligible differ- ence between the V ( z ) curves for small
z .
A difference is noticeable ifz
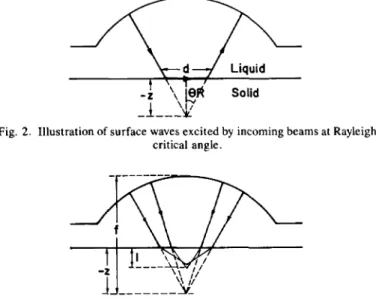
is made sufficiently negative. This can be explained considering the well-known interference phe- nomenon giving rise to the V(z) curves [7]. Incident beams at the Rayleigh angle will excite the surface waves in the solid medium. The excited surface waves start leaking into the liquid medium as soon as they are generated. But not all of the leaking waves will be received by the transducer. Only the waves appearing to have come from the focal point of the lens will contribute to the transducer output voltage. In Fig. 2 d is the distance that the surface waves must travel in the solid medium in order to be seen as if they were coming from the focal point. From geometrical considerations d is related toz
by d = - z tanO R is the Rayleigh critical angle given by
OR
=sin-’( VOW,), where V, is the sound velocity in the liquid; and V, is the Rayleigh wave velocity in the solid. There- fore, d increases if
z
is made more negative. The pres- ence of the substrate through the layer is sensed because the surface waves that are mainly in the layer region are perturbed due to the skirts of waves extending into the substrate region. The perturbation of the surface waves\ d 3 / Liquid
-!
‘,
$
Solid\ I
-_t---k \ I /
Fig. 2. Illustration of surface waves excited by incoming beams at Rayleigh critical angle.
Fig. 3. Focusing of longitudinal or shear waves inside a solid medium.
becomes more pronounced when the interaction distance increases. On the other hand, the magnitude of the leak- ing surface waves will decrease as d increases reducing the perturbation contribution at the transducer output. For most cases, the maximum difference between the V(z)
curves stays more or less the same for a range of
z
values.z
should not be increased indefinitely because the reso- lution criterion must also be taken into account. One can- not ignore resolution in a penetration argument. We should therefore limit1
zI
to a maximum value.Obviously a higher penetration depth can be achieved if the frequency of operation is lowered. That would make the wavelength and hence the penetration [8] of the sur- face waves larger.
The surface waves are very important to the penetra- tion ability of the acoustic microscope, but they are not the only contributors. The longitudinal and shear waves inside the object may also come into play. Although they are small in amplitude because of a large acoustic mis- match at the liquid-solid interface, their effect should not be neglected. They may reflect back at an interface un- derneath the surface and contribute significantly to the received signal. Fig. 3 depicts rays of longitudinal or shear waves forming a focal point at a distance l beneath the surface. This focal point [g] is not very well defined be- cause of aberrations, nevertheless it can serve as a ref- erence. To get a focal point a distance 1 below the surface, the object must be brought a distance
I
z
1
closer to lens. The relationship betweenz
andI
can be written using the ratio of wave velocities -z/jl=
VIVO, where V is the sound velocity in the object. Two focal points arise from two possible waves. From these we would choose the shear waves because they have shorter wavelength and probably higher resolution. According to these heuristic argu- ments, the object must be positioned atz
= -IV,/V, (V,is the shear wave velocity) if one is trying to image the plane a distance
I
below the surface with optimized res- olution.The penetration depth would inevitably depend on the elastic parameters of the layer we are trying to look
through. It would also depend on the elastic parameters of the second material that we are trying to see. In gen- eral the penetration depth should be defined for pairs of materials. Such a definition is, however, not very prac- tical because there are too many combinations. For this reason we would select the second material as an infi- nitely stiff and heavy substance to make it a perfect re- flector. Our definition for penetration depth is as follows:
An acoustic microscope is said to have a penetra- tion depth of 1 through the material A , if the maxi- mum difference between the two V ( z ) curves-one due to material A covering the half space, the other due to the material A of thickness 1 over a perfectly reflecting substrate-in the range -Ws/Vo S z
<
0is equal to the noise level.
With this definition we assume that the difference be- tween V ( z ) curves is barely noticeable when this difference is equal to the noise voltage. Therefore the penetration depth depends on the signal-to-noise ratio of the system; that is, the higher the signal-to-noise ratio, the higher the penetration depth.
111. RESULTS
To calculate the penetration depth of material A , first the Vo(z) for the material A covering the half space is cal- culated. Next V l ( z ) curves are calculated for various thicknesses I of the material A on perfectly reflecting me- dium [lo]. All curves are plotted on a linear scale. From the comparison of these curves the one that would barely satisfy the given condition is selected. We note that the signal-to-noise ratio is defined when the object is placed at the focal plane (maximum signal) from which the noise level can be determined. The penetration depth is equal to 1 if V l ( z ) differs from
Vo(z)
at most by the noise voltage in the range -lVs/Vo 5z
<
0.We have calculated the penetration depths for some ma- terials using a typical lens geometry (50" half opening angle) with a signal to noise ratio of 20 dB and 30 dB. We have assumed a typical illumination of the lens at the back focal plane and water as the immersion liquid. The reflec- tion coefficient at the liquid-solid interface is calculated under isotropy assumptions from known material con- stants [S]. The results are tabulated in Table I. The pen- etration depth is given relative to the wavelength in water. The wavelengths for surface waves are also shown in Table I , which shows that the relationship between the penetra- tion depth and the wavelength of the surface wave is not a simple one. Materials with a large acoustic impedance have a poor penetration depth. This is to be expected be- cause there will be less coupling into the surface waves. On the other hand, materials with relatively low imped- ance have a penetration depth better than the wavelength of the surface wave. For such materials the effect of lon- gitudinal and shear waves is significant. Gold has a Ray-
TABLE I
RAYLEICH WAVE WAVELENGTHS A N D PENETRATIOV DEPTH IN UNITS OF
WAVELENGTH I N WATER USIPI'G A 50" OPENING ANGLE LENS Rayleigh Wave
Material Wavelength (in X") Penetration Depth (in X,)
Gold 0.761 0 . 5
'
0 . 7 Iron I .98 1.3 2 Quartz 2.39 1.5 2 . 3 Copper 1.8 1 . 5 2.3 Nickel 1.86 1.6 2.2 Silicon 3.41 1.7 2 Sapphire 3.73 1.7 2.3 SiOz 2 . 6 2 . 3 3.7 GaAs 1.93 2 . 8 3.3Pyrex Glass 2
.oo
3 4Aluminium 1.89 3 . 3 4
Lucite 0.69 > 6
'SNR = 20 dB. 'SNR = 30 dB.
leigh-wave velocity that is too low to be excited from waves in the water. In this case surface waves play no role in penetration. Due to its high impedance the longitudinal and shear waves are very small in amplitude. That is why the penetration through a gold layer is extremely low. This result is in good agreement with experimental findings. On the other hand, lucite has a Rayleigh-wave velocity that
is also too slow; but due to good impedance match, the longitudinal and shear waves can be excited and result in an extremely high penetration depth.
Our definition gives optimistic results for penetration because a perfectly reflecting substrate is assumed. Hence
our results show the upper limit of what can be achieved at a given frequency. They give a reference point, and they can be used for the proper selection of operation frequency for a particular application.
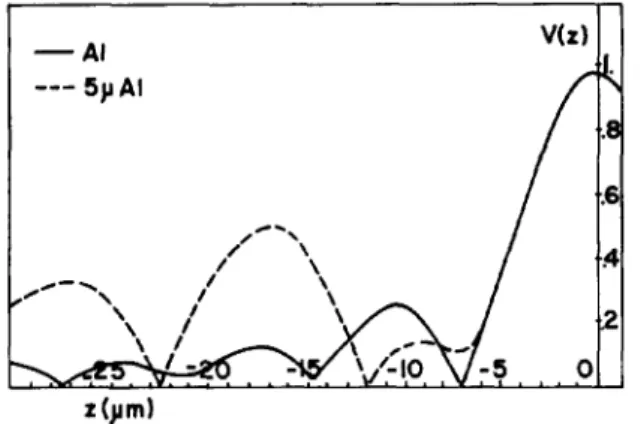
With a quantitative measure for penetration ability one may try to optimize some lens parameters. We have tried to change the opening angle of the lens to see the effect on penetration depth. It was found that the penetration depth can be increased with the proper selection of the opening angle of the lens. For materials having a relatively small acoustic impedance, shear waves can be used for interior imaging. Under these circumstances the half opening angle of the lens should be made equal to the shear critical angle B , = sin-'(Vo/V,) to optimize penetration ability. This way no power will be wasted in angles cor- responding to total reflection. Fig. 4 displays V(z) curves for A1 and for five microns of AI over a perfectly reflecting substrate for a lens with a half opening angle of 27". The maximum difference between the curves show up when
z
=-
16 p and whenz
= -28 p . These points corre- spond respectively to shear and longitudinal wave focusing at five microns below the surface, as determined by the equationsz
= -IV,/V, and z = -ZVJVo. The position ofthese peaks obeyed the predicted values and also for other thicknesses, supporting our result. With a smaller
opening angle the shear- and longitudinal-wave contribu- tions are made more significant than the surface-wave
ATALAR: PENETRATION DEPTH OF THE SCANNING ACOUSTIC MICROSCOPE 167
t ( ) r m )
Fig. 4. V(z) curves of A1 and of 5 p of AI on a perfectly reflecting substrate for a 27” half opening angle lens at 1 GHz.
TABLE I1
RAYLEIGH CRITICAL ANGLE, OPTIMAL LENS HALF OPENING ANGLE, AND
CORRESPONDING PENETRATION DEPTH IN UNITS OF WAVELENGTH IN WATER’
Rayleigh Lens Half Penetration
Material Critical Angle O b n i n g Angle Depth in X, Sapphire 15.5“ 17” 3.3 Permalloy 27 ’ 29 3.1 Iron 30” 32” 4.7 Nickel 33 O 35” 3.7 Copper 34” 36” 5.7 ‘SNR = 20 dB.
contribution. V(z) curves now show the interference be- tween surface reflection and internal shear- or longitudi- nal-wave reflections rather than the interference between the surface reflections and leaky surface waves. On the other hand, for materials with relatively large acoustic impedance no peaks corresponding to shear and longitu- dinal waves are observed, hence the surface waves are the only waves by which penetration can be achieved. In this case the opening angle of the lens should be selected so
as to include the Rayleigh critical angle. Table I1 lists the optimum lens opening angle and corresponding penetra- tion depth for some materials. As it is seen from Table 11
the optimum opening angle is less than the usual 50”
opening angle that was selected to optimize the surface resolution. A comparison with Table I shows that there is at least a one to two improvement in penetration depth. Reducing the half opening angle to the 30” to
40”
range will cause some loss of the surface resolution, but will improve the penetration ability of the acoustic micro- scope.IV. CONCLUSION
We have given a definition that quantifies the penetra- tion ability of the reflection acoustic microscope. With this definition the penetration depth depends on elastic param- eters of the object, the signal-to-noise ratio, and the fre- quency of operation of the acoustic microscope system. A higher acoustic mismatch between the object and liquid
will lower the penetration depth. On the other hand, a higher signal-to-noise ratio will improve it.
We have found that there is an optimum lens opening angle for a given material to maximize penetration. For high-impedance materials surface waves are the only waves by which a penetration can be achieved. In such cases the opening angle must be just enough to cover the Rayleigh critical angle. One would get a frequency-depen- dent penetration depth in the same order of magnitude as the Rayleigh wavelength in the solid material. For low- impedance materials the opening angle should be selected to be equal to the shear critical angle. In this case shear waves can be used for interior imaging, and the penetra- tion is determined not by the frequency but by other fac- tors such as attenuation. An opening angle in the 30” to
40”
range will satisfy most of the requirements.ACKNOWLEDGMENT
Most of this work was done while the author was with Ernst Leitz Wetzlar GmbH, West Germany.
REFERENCES
Lerr., vol. 35, p. 385, 1979.
V. B. Jipson, “Acoustic microscopy of interior planes,” Appl. Phys. J. Attal, “Acoustic microscopy: imaging microelectronic circuits with liquid metal,” presented at the Int. Symp. Scanned Image Micros- copy, London, 1980.
Y. Guangqi, M. Nikoonahad, and E. A. Ash, “Pulse compression subsurface acoustic microscopy,” Elecr. Lett., vol. 18, p. 767, 1982. F. Pino, D. A. Sinclair, and E. A. Ash, “Scanning acoustic micros copy of solid objects using aspheric lenses,” in Proc. 11th Int. Con$
Acoustical Imaging, Monterey, CA, 1981.
H. K. Wickramasinghe, “Mechanically scanned B-scan system for acoustic microscopy of solids,” Appl. Phys. L e r t . , vol. 39, p. 305, 1981.
C. F. Quate, A. Atalar, and H. R. Wickramasinghe, “Acoustic mi- croscopy with mechanical scanning-A review,” Proc. IEEE, vol. 67, D. 1092, 1979.
[7] W . Pannon and H. L. Bertoni, “Ray interpretation of the material signature in the acoustic microscope,” Elect. Lerr., vol. 15, p. 684,
1979.
[S] B. A. Auld, Acoustic Fields and Waves in SoEids, vols. I & 11. New York: John Wiley, 1973.
[9] B. Nongaillard, J. M. Rouvaen, E. Bridoux, R. Torquet, and C . Bru- neel, “Visualization of thick specimens using a reflection acoustic mi- croscope,” J. Appl. Phys., vol. 50, p. 1245, 1979.
[lo] L. M. Btekhovskikh, Waves in Layered Media, New York: Academic, 1969.
Abdullah Atalar was born in Gaziantep, Turkey,
on April 11, 1954. He received the B.S. degree from Middle East Technical University, Ankara, Turkey, in 1974, and the M.S. and Ph.D. degrees from Stanford University, Stanford, CA, in 1976 and 1978, respectively, all in electrical engineer- ing.
From 1978 to 1980 he was first a Postdoctoral Fellow and later an Engineering Research Asso-
ciate continuing his work on acoustic microscopy. He was with Hewlett Packard Labs, Palo Alto, CA, engaged in photoacoustics research. In 1980 he joined the Middle East Technical University as an Assistant Professor. From 1982 to 1983, he was with Ernst k i t z Wetzlar GmbH, Wetzlar, West Germany, where he was involved in the development of the commercial acoustic microscope.