EFFECTS OF BIOLOGICAL COMPOUND TURKISH PROPOLIS
EXTRACT ON BREAST CANCER CELLS
A THESIS
SUBMITTED TO THE DEPARTMENT OF MOLECULAR BIOLOGY AND GENETICS AND THE GRADUATE SCHOOL OF ENGINEERING AND SCIENCE
OF BILKENT UNIVERSITY
IN PARTIAL FULFILLMENT OF THE REQUIREMENTS FOR THE DEGREE OF
MASTER OF SCIENCE
BY DENİZ UĞURLU
ii
I certify that I have read this thesis and that in my opinion it is fully adequate, in scope and in quality, as a thesis for the degree of Master of Science.
__________________________________ Assoc. Prof. Dr. Işık YULUĞ (Advisor)
I certify that I have read this thesis and that in my opinion it is fully adequate, in scope and in quality, as a thesis for the degree of Master of Science.
__________________________________ Assoc. Prof. Dr. Dönüş TUNCEL
I certify that I have read this thesis and that in my opinion it is fully adequate, in scope and in quality, as a thesis for the degree of Master of Science.
__________________________________ Assist. Prof. Dr. Özlen KONU
Approved for the Graduate School of Engineering and Science:
__________________________ Prof. Dr. Levent Onural Director of the Graduate School
iii
ABSTRACT
EFFECTS OF BIOLOGICAL COMPOUND TURKISH PROPOLIS
EXTRACT ON BREAST CANCER CELLS
Deniz UĞURLU
M.S. in Molecular Biology and Genetics Supervisor: Assoc. Prof. Dr. Işık YULUĞ
August, 2013
Propolis is a resinous compound which is collected from various plants then combined with wax and bee enzymes by worker bees. There are many studies conducted on propolis or its active components aiming to find new treatment possibilities in diverse research fields such as immunology, infectious diseases, allergy, diabetes, ulcers, and oncology. Chemical analysis indicated that propolis is a multicomponent mixture of various compounds with prevalence of flavonoids and phenolic acids. Therefore it is important to investigate the propolis extract mechanisms of action in order to predict possible cytotoxic and may be therapeutic effects for cancer. The most common propolis extract is ethanol extract of propolis (EEP) whereas Turkish researchers were able to extract the propolis with dimethyl sulfoxide (DMSO) which can maximize the penetration of compounds from propolis to the cells as well as DMSO is a good solvent for flavonols (one of the most common compound in propolis). There are many studies conducted on propolis or its active components for treatment of cancer which reveals the potential of this biological compound in the development of novel anti-cancerous agents. However, anti-cancer activity of DMSO extract of Turkish propolis (DEP) on human breast cancer has not been investigated yet. The aim of this study was to investigate the anti-cancer effects of DMSO extract of Turkish propolis (DEP) on cancer cells. Inhibitory effects of propolis extracts collected from different regions of Turkey were analyzed on the growth of the human breast carcinoma cells. Two different
iv
propolis extracts were used to determine their cytotoxic effects of breast carcinoma cell lines using SRB staining and IC50 values were determined. The results showed that propolis is cytotoxic in dose-dependent manner (IC50 value of diverse from 25 ug/ml to 123 ug/ml). Real time monitoring (xCELLigence system) of propolis treated cells confirmed the cytotoxic effect of propolis, since increasing concentrations of propolis decreased the cell number in a dose- and cell line- dependent way. Furthermore, propolis treatment induces apoptosis in breast carcinoma cell lines. Propolis treated cells changed their adherent morphology to round cells and detached from the surface. Hoechst 33258 staining of propolis treated cells revealed the increasing number of cells displays DNA condensation. PARP-1, a 116 kDa nuclear enzyme, is cleaved in fragments of 89 and 24 kDa during apoptosis. Western blot analysis was performed to detect the PARP-1 cleavage in propolis treated cells. Decrease in the full-length PARP-1 protein levels supports our hypothesis that propolis shows its cytotoxic effect at least partially through induction of apoptosis. The effect of propolis on cell cycle was analyzed with flow cytometer after staining the cells with Propidium iodide (PI). Increase in the G2/M cell cycle arrest was observed in propolis treated cells compare to control DMSO treated MDA-MB-231 cells. In addition to cytotoxic effects, in vitro wound healing assay revealed that propolis treated MDA-MB-231 cells shows delayed invasion of the cells to the denuded area when compared to the DMSO control cells. In conclusion, propolis showed a cytotoxic effect on breast carcinoma cell lines by inducing apoptosis, G2/M arrest as well as delaying the invasion capacity of the cells which makes it a potent anti-tumorigenic compound that may be useful in cancer chemoprevention or therapy.
Key words: Propolis, Breast Cancer, Cytotoxic, Apoptosis, xCELLigence, Scratch Assay.
v
ÖZET
BİYOLOJİK BİLEŞKE TÜRK PROPOLİSİNİN MEME KANSERİ
HÜCRELERİNE ETKİLERİ
Deniz UĞURLU
Moleküler Biyoloji ve Genetik, Yüksek Lisans Tez Yöneticisi: Doç. Dr. Işık YULUĞ
Ağustos, 2013
Propolis, işçi arılar tarafından çeşitli bitkilerden toplanıp balmumu ve arı enzimleriyle kombine edilen, reçine tipinde bir üründür. Propolis veya aktif bileşenleriyle ilgili olarak immünoloji, enfeksiyon hastalıkları, alerji, diyabet, ülser ve onkoloji gibi çeşitli araştırma alanlarında yeni tedavi olasılıkları bulmayı hedefleyen çok sayıda çalışma vardır. Kimyasal analizler propolisin flavonoidler ve fenolik asitlerle birlikte çeşitli bileşenlerin karışımı olduğunu göstermiştir. Bu nedenle olası toksik ve terapötik etkileri öngörmek açısından propolis ekstrelerinin etki mekanizmalarını incelemek önemlidir. En sık kullanılan propolis ekstresi propolisin etanol ekstresidir (EEP). Türk araştırmacılar propolis bileşenlerinin hücrelere penetrasyonunu maksimuma çıkartabilecek şekilde propolisin dimetil sülfoksit (DMSO) ile ekstresini elde edebilmişlerdir. DMSO, flavonoller (propolis içinde en sık bulunan bileşenlerden) için iyi bir solventtir. Propolis veya aktif bileşenlerinin kanser tedavisinde kullanımıyla ilgili olarak yapılmış ve bu biyolojik bileşenin yeni anti-kanser ajanların geliştirilmesindeki potansiyelini gösteren çok sayıda çalışma vardır. Ancak Türk propolisinin DMSO ekstresinin (DEP) insan meme kanseri üzerindeki anti-kanser aktivitesi henüz incelenmemiştir. Bu çalışmanın amacı kanser hücreleri üzerinde Türk propolisinin DMSO ekstresinin (DEP) anti-kanser etkilerini araştırmaktır. Çalışmada Türkiye'nin çeşitli bölgelerinden toplanan propolisin insan meme karsinomu hücrelerinin büyümesi üzerindeki inhibe edici etkileri incelendi. SRB boyaması kullanılarak iki farklı propolis ekstresinin meme karsinomu hücre
vi
hatları üzerindeki sitotoksik etkileri incelendi ve IC50 değerleri belirlendi. Sonuçlar propolisin doza bağımlı bir şekilde sitotoksik olduğunu gösterdi (IC50 değeri 25 ug/ml ile 123 ug/ml arasında değişmektedir). Propolis ile muamele edilen hücrelerin gerçek zamanlı incelenmesi (xCELLigence sistemi) propolis sitotoksik etkilerini doğruladı çünkü artan propolis konsantrasyonları hücre sayısını doza ve hücre hattına bağımlı bir şekilde azalttı. Ayrıca propolis tedavisi meme kanseri hücre hatlarında apoptozu indükledi. Muamele edilen hücrelerin adheran morfolojisi yuvarlak hücreler haline dönüştü ve Hoechst 33258 boyama yöntemi ile artan sayıda hücrede DNA kondansasyonu gösterdi. Apoptoz sırasında, 116 kDa bir nükleer enzim olan PARP-1, 89 ve 24 kDa büyüklüğündeki fragmanlara ayrılmaktadır. Propolis ile muamele edilen hücrelerde PARP-1 ayrılmasını saptamak üzere Western blot analizi yapıldı. Tam uzunlukta PARP-1 protein seviyelerinde azalma, propolisin sitotoksik etkisini en azından kısmen apoptoz indüksiyonu yoluyla gösterdiği hipotezimizi desteklemektedir. Propolisin hücre döngüsü üzerine etkisi, hücrelerin Propidium iyodür (PI) ile boyandıktan sonra bir akış sitometresi tarafından analiz edilmesiyle incelendi. Kontrol DMSO ile muamele edilmiş MDA-MB-231 hücreleriyle karşılaştırıldığında propolis ile muamele edilen hücrelerde G2/M hücre döngüsü arestinde güçlü bir artış görüldü. Sitotoksik etkilere ilaveten, in vitro yara iyileşmesi testi, propolis ile muamele edilen MDA-MB-231 hücrelerinin DMSO kontrol hücreleriyle karşılaştırıldığında soyulmuş bölgeye hücre invasyonunda gecikme olduğu saptandı. Sonuç olarak, meme kanseri hücre hatlarında apoptoz ve G2/M arestini indükleyerek ve ayrıca hücrelerin invazyon kapasitesini geciktirerek gösterdiği sitotoksik etki sayesinde propolis kanser kemoterapisi veya önlenmesinde faydalı olabilecek güçlü bir anti-tümorijenik bileşendir.
Anahtar Sözcükler: Propolis, Meme Kanseri, Sitotoksik, Apoptoz, xCELLigence, Yara İyileşmesi testi
vii
Acknowledgement
I would like to express my sincere gratitude to my supervisor, Assoc. Prof. Dr. Işık Yuluğ, who welcomed me to her lab and supported me patiently. She was an
understanding advisor as well as sophisticated mentor in helping me gaining skills in scientific research. It has always been a privilege to work in her lab.
I would like to thank Prof. Dr. Orhan Değer for providing the propolis extracts for this study.
I am grateful to Assoc. Prof. Dr. Rengül Çetin-Atalay for her valuable contributions to this study.
I am highly indebted to PhD-to-be Gurbet Karahan and Nilüfer Sayar who are the greatest group mates with their helpful guidance and kind friendship.
I would also like to thank to The Scientific and Technological Research Council of Turkey (TÜBİTAK) for their financial support throughout my master study.
Moreover, I would like to thanks to PhD. Çiğdem Özen and Deniz Cansen Yıldırım for providing necessary information regarding this study.
I should also thank to lab members of Bilkent MBG, especially Sinem, Kerem, Azer, Gökhan, Mehmet, İhsan, Derya, Damla, Emre, Yusuf and Sıla for being a friendly colleagues.
I would like to thank my loved ones, Bilkenters Harun, Aslınur, Taner, Merve, Ece, Alper and my old friends Ferhan, Ezgi, Asya, Mehtap, Ece who have supported me throughout entire process, both by keeping me harmonious and helping me putting pieces together. I will be grateful forever for your love.
I would like to express my gratitude towards my parents for their encouragement in every step of my life.
viii
Table of Content
ABSTRACT ... iii
EFFECTS OF BIOLOGICAL COMPOUND TURKISH PROPOLIS EXTRACT ON BREAST CANCER CELLS ... iii
ÖZET ... v
BİYOLOJİK BİLEŞKE TÜRK PROPOLİSİNİN MEME KANSERİ HÜCRELERİNE ETKİLERİ . v Acknowledgement ...vii
Table of Content ... viii
List of Figures ... xi
List of Tables ... xv
Abbreviations ... xix
1 INTRODUCTION ... 1
1.1 Breast Cancer ... 1
1.1.1 Classification of Breast Cancer ... 2
1.1.2 Breast Carcinoma Cell Lines ... 3
1.2 Biological Compound Propolis ... 4
1.2.1 Propolis Extracts ... 6
1.2.2 Antitumoral Activity of Propolis and Its Active Components ... 8
1.2.3 Synergistic Effects of Propolis with Other Chemotherapeutic Drugs .. 10
ix
1.3.1 Apoptosis ... 13
1.3.2 Poly(ADP-ribose) Polymerase-1 (PARP-1) Cleavage ... 14
2 Materials ... 16
2.1 Propolis Extract ... 16
2.2 Growth Mediums ... 16
2.3 Buffers and Solutions ... 18
2.4 General Materials ... 20
3 Methods ... 22
3.1 Cell Culture Techniques ... 22
3.1.1 Growth Conditions ... 22
3.1.2 Cryopreservation of Cells ... 23
3.1.3 Reculturing Frozen Cells ... 23
3.1.4 Storing Cell Pellets for Protein Isolation ... 24
3.1.5 Cell Counting with Haemocytometer ... 24
3.2 Sulforhodamine B (SRB) Assay ... 25
3.2.1 Trichloroacetic acid (TCA) Fixation ... 26
3.2.2 Sulforhodamine B (SRB) Staining ... 26
3.3 IC50 Calculations ... 27
3.4 Statistical Analyses ... 27
3.5 Live Cell Proliferation Assay (xCELLigence) ... 28
3.6 Nuclear Staining with Hoechst 33258 ... 30
3.7 Western Blot ... 30
3.7.1 Cell Lysis ... 30
x
3.7.3 Preparation of SDS gel and Its Transfer to Nitrocellulose Membrane 34
3.7.4 Blocking & Antibody Incubations ... 35
3.7.5 ImageJ Analysis ... 36
3.8 FACS ... 37
3.8.1 Cell Fixation ... 37
3.8.2 Cell Staining with Propidium iodide (PI) ... 37
3.9 Scratch Assay ... 38
4 RESULTS ... 40
4.1 Analysis of Propolis' Effects in Cancer Cells ... 40
4.2 IC50 Values for Propolis extracts for Breast Carcinoma Cell Lines ... 49
4.3 Association of IC50 Values of Propolis extracts with Properties of Breast Carcinoma Cell Lines ... 73
4.4 Dynamic Cell Proliferation of Propolis Treated Cells with xCELLigence ... 79
4.5 Propolis Induces Apoptosis on Breast Carcinoma Cell Lines ... 83
4.5.1 Morphology of the Cells Changes with Propolis Treatment ... 83
4.5.2 Chromatin Condensation and Nuclear Fragmentation ... 86
4.5.3 Western Blot Analysis of PARP-1 cleavage ... 89
4.6 Propolis Slightly Increases G2/M arrest of MDA-MB-231 Cells ... 95
4.7 Propolis Blocks Invasion of MDA-MB-231 Cells ... 100
5 Discussion ... 103
6 Future Perspectives ... 108
7 References ... 110
8 Appendix ... 116
8.1 IC50 Analysis of Propolis ... 116
xi
List of Figures
Figure 1-1 Anatomy of breast (Harness, 2011). ... 1 Figure 1-2 The Chemical Structure of Caffeic acid phenethyl ester (CAPE) C17H16O4 (Akyol, 2012). ... 9 Figure 1-3 Picture of Taxus brevifolia (Pacific Yew) which Paclitaxel was isolated from (McMullen, 2008). ... 11 Figure 1-4 Fas-induced and TNF-induced Apoptosis Models (Nagata, 1997). ... 13 Figure 1-5 Various Fragments of PARP-1 after cleaved by specific suicidal proteases (Chaitanya, 2010). ... 15 Figure 3-1 Schematic Drawing of the Working Principle of xCELLigence (ACEA
Bioscience Inc.) ... 29 Figure 3-2 BSA Standard Curve ... 32 Figure 3-3: The protein loading marker and the gel configuration where the dashed lines show the cutting sites of the gels. ... 35 Figure 4-1: The cell proliferation rate of FOCUS cells after propolis treatment. T ... 42 Figure 4-2: The cell proliferation rate of FOCUS (A) and Huh7 (B) cells after
treatment with Propolis-1 and DMSO at 24 h, 48 h, and 72 h time points. ... 44 Figure 4-3: Cell proliferation of FOCUS, Huh7, SK-LC, MDA-MB-231 and MCF12A cell lines with increasing concentrations of Propolis-1 and DMSO. ... 48 Figure 4-4: The relative fold change of each propolis treated cell line at different concentrations of Propolis-1. ... 49 Figure 4-5: Calculation of IC50 values for propolis extracts in MCF10A cells. ... 51 Figure 4-6: Calculation of IC50 values for propolis extracts in MCF12A cells. ... 53 Figure 4-7 Calculation of IC50 values for propolis extracts in MDA-MB-231 cells. .... 54 Figure 4-8: Calculation of IC50 values for propolis extracts in CAMA-1 cells. ... 56
xii
Figure 4-9: Calculation of IC50 values for propolis extracts in MDA-MB-453 cells ... 57 Figure 4-10: Calculation of IC50 values for propolis extracts in MDA-MB-468 cells. 59 Figure 4-11: Calculation of IC50 values for propolis extracts in T47D cells. ... 60 Figure 4-12: Calculation of IC50 values for propolis extracts in MCF7 cells. ... 62 Figure 4-13: Calculation of IC50 values for propolis extracts in HCC-1937 cells. ... 63 Figure 4-14: Calculation of IC50 values for propolis extracts in MDA-MB-157cells. . 65 Figure 4-15: Calculation of IC50 values for propolis extracts in BT-20 cells. ... 66 Figure 4-16: Calculation of IC50 values for propolis extracts in MDA-MB-361 cells. 68 Figure 4-17: Calculation of IC50 values for propolis extracts in BT-474 cells. ... 69 Figure 4-18: Calculation of IC50 values for propolis extracts in ZR-75-1 cells. ... 71 Figure 4-19: Calculation of IC50 values for propolis extracts in hTERT-HME-1 cells. 72 Figure 4-20 Comparison of IC50 Values of Two Different Propolis Extracts on Breast carcinoma cell lines ... 74 Figure 4-21 Fold change of IC50 values of two different propolis extracts on breast carcinoma cell lines ... 74 Figure 4-22 IC50 values of propolis extracts were used to analyze according to the molecular subtypes of breast carcinoma cell lines. ... 75 Figure 4-23 IC50 values of propolis extracts were used to analyzed according to the ER status of breast carcinoma cell lines. ... 76 Figure 4-24 IC50 values of propolis extracts were used to analyzed according to the PR status of breast carcinoma cell lines. ... 77 Figure 4-25 IC50 values of propolis extracts were used to analyzed according to the HER2 status of breast carcinoma cell lines. ... 78 Figure 4-26 Dynamic monitoring of cell proliferation using the xCELLigence system in MCF10A. ... 80 Figure 4-27 Dynamic monitoring of cell proliferation using the xCELLigence system in BT-474. ... 80 Figure 4-28 Dynamic monitoring of cell proliferation using the xCELLigence system in T47D. ... 81
xiii
Figure 4-29 Dynamic monitoring of cell proliferation using the xCELLigence system in BT-20. ... 81 Figure 4-30 Dynamic monitoring of cell proliferation using the xCELLigence system in CAMA-1. ... 82 Figure 4-31 Dynamic monitoring of cell proliferation using the xCELLigence system in MDA-MB-231. ... 82 Figure 4-32 The morphological appearance of treated cell lines under the light microscope. ... 85 Figure 4-33 Hoechst 33258 staining and morphological appearance of cell nucleus after treatment. ... 88 Figure 4-34 Western blot analysis of PARP-1 cleavage in untreated and Adriamycin treated breast carcinoma cell lines. ... 89 Figure 4-35 Graphical representation of normalized data of PARP-1 band intensities in untreated breast carcinoma cell lines. ... 90 Figure 4-36 Graphical representation of normalized data of PARP-1 band intensities in untreated and Adriamycin treated MDA-MB-231 cells. ... 90 Figure 4-37 Western blot analysis of PARP-1 cleavage in DMSO and Propolis-2 treated breast carcinoma cell lines. ... 92 Figure 4-38 Graphical representation of normalized data of full length PARP-1 band intensity in breast carcinoma cell lines. ... 92 Figure 4-39 Graphical representation of normalized data of cleaved PARP-1 band intensity in breast carcinoma cell lines. ... 93 Figure 4-40 Graphical representation of normalized data of full length PAPR-1 and cleaved PARP-1 band intensity ratio in untreated and Adriamycin treated MDA-MB-231 cells. ... 94 Figure 4-41 Graphical representation of normalized data of full length PAPR-1 and cleaved PARP-1 band intensity ratio in breast carcinoma cell lines. ... 94 Figure 4-42 Cell cycle analysis of untreated and Adriamycin treated MDA-MB-231 cell line with flow cytometer. ... 96
xiv
Figure 4-43 Graphical representation of cell cycle analysis of untreated and
Adriamycin treated MDA-MB-231 cell line. ... 97
Figure 4-44 Cell cycle analysis of DMSO and propolis treated MDA-MB-231 cell line with flow cytometer. ... 98
Figure 4-45 Graphical representation of cell cycle analysis DMSO and propolis treated MDA-MB-231 cell line. ... 99
Figure 4-46 Graphical representation of cell cycle analysis of untreated, DMSO, propolis and Adriamycin treated MDA-MB-231 cell line. ... 100
Figure 4-47 Light microscope image to evaluate wound healing in vitro in the scratch assay using a confluent monolayer of MDA-MB-231 Cells. ... 102
Figure 8-1 Permission to Reuse of Figure 1-1. ... 146
Figure 8-2 Permission to Reuse of Figure 1-2. ... 146
Figure 8-3 Permission to Reuse of Figure 1-3. ... 147
Figure 8-4 Permission to Reuse of Figure 1-4. ... 147
xv
List of Tables
Table 1.1 The two most common types of new cancer cases and deaths by world
area, 2008 ... 2
Table 1.2 Properties of Breast carcinoma cell lines. ... 4
Table 1.3 Chemical Composition of Propolis ... 7
Table 2.1 Growth mediums of cell lines ... 17
Table 2.2 General Solutions ... 18
Table 2.3 Cell Lysis Buffer ... 18
Table 2.4 Bradford Stock Solution... 18
Table 2.5 Bradford Working Solution ... 18
Table 2.6 5x Loading Dye ... 19
Table 2.7 30% Acrylamide/Bisacrylamide Solution... 19
Table 2.8 SDS Gel Formulation to Prepare two Gels ... 19
Table 2.9 5x Running Buffer ... 19
Table 2.10 Wet Transfer Buffer ... 19
Table 2.11 Antibodies and Their Solutions ... 20
Table 2.12 Propidium Iodide (PI) Staining Solution ... 20
Table 2.13 Production Information of Materials ... 20
Table 3.1 Starting cell number for IC50 calculations ... 25
Table 3.2 Sample Preparation for BSA Standard Curve ... 31
Table 3.3 Sample Preparation for Protein Quantitation with Spectrophotometer... 32
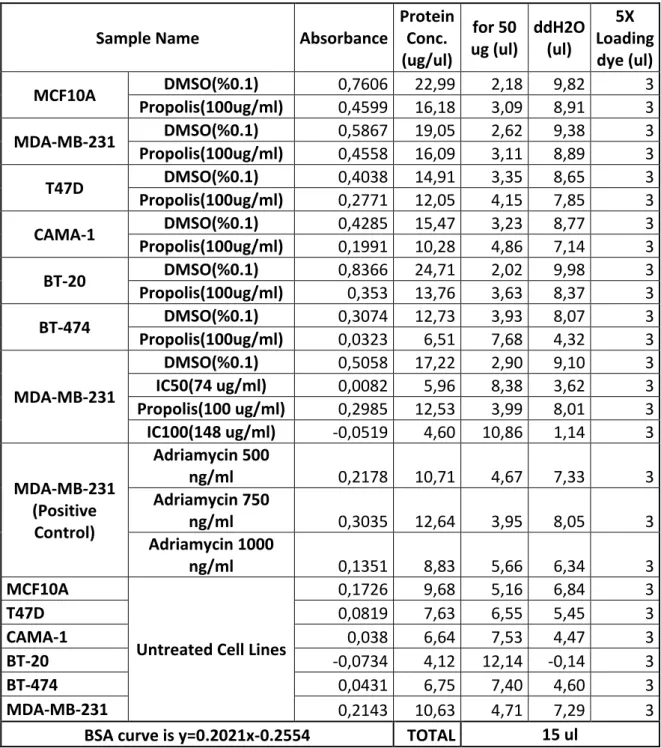
Table 3.4 Absorbance and Protein Concentrations of Samples for Western Blot Analysis. ... 33
xvi
Table 4.1: The ELISA reading results that show the cytotoxic effects of Propolis-1 and DMSO on FOCUS cells ... 41 Table 4.2: The ELISA reading results that show the cytotoxic effects of Propolis-1 and DMSO on FOCUS (A) and Huh7 (B) cells at different time points ... 43 Table 4.3: The ELISA reading results of Propolis-1 and DMSO on FOCUS, Huh7, SK-LC, MDA-MB-231 and MCF12A cell lines. ... 45 Table 4.4: Comparison of control DMSO and propolis treated cells proliferation ratio. ... 48 Table 4.5 Classification of Breast carcinoma cell lines According to Their Molecular Status with IC50 Values of Propolis Extracts ... 73 Table 4.6 Starting Cell Numbers of Cell Lines for xCELLigence Monitoring ... 79 Table 4.7 Percent gate comparison of untreated, DMSO, propolis and Adriamycin treated MDA-MB-231 cell line for cell cycle analysis. ... 99 Table 8.1: The ELISA reading results of MCF10A cell numbers when treated with Propolis-1 and DMSO. ... 116 Table 8.2: The ELISA reading results of MCF10A cell numbers when treated with Propolis-2 and DMSO. ... 117 Table 8.3: The ELISA reading results of MCF12A cell numbers when treated with Propolis-1 and DMSO. ... 118 Table 8.4: The ELISA reading results of MCF12A cell numbers when treated with Propolis-2 and DMSO. ... 119 Table 8.5: The ELISA reading results of MDA-MB-231 cell numbers when treated with Propolis-1 and DMSO. ... 120 Table 8.6: The ELISA reading results of MDA-MB-231 cell numbers when treated with Propolis-2 and DMSO. ... 121 Table 8.7: The ELISA reading results of CAMA-1 cell numbers when treated with Propolis-1 and DMSO. ... 122 Table 8.8: The ELISA reading results of CAMA-1cell numbers when treated with Propolis-2 and DMSO. ... 123
xvii
Table 8.9: The ELISA reading results of MDA-MB-453 cell numbers when treated with Propolis-1 and DMSO. ... 124 Table 8.10: The ELISA reading results of MDA-MB-453 cell numbers when treated with Propolis-2 and DMSO. ... 125 Table 8.11: The ELISA reading results of MDA-MB-468 cell numbers when treated with Propolis-1 and DMSO. ... 126 Table 8.12: The ELISA reading results of MDA-MB-468 cell numbers when treated with Propolis-2 and DMSO. ... 127 Table 8.13: The ELISA reading results of T47D cell numbers when treated with Propolis-1 and DMSO. ... 128 Table 8.14: The ELISA reading results of T47D cell numbers when treated with Propolis-2 and DMSO. ... 129 Table 8.15: The ELISA reading results of MCF7 cell numbers when treated with Propolis-1 and DMSO. ... 130 Table 8.16: The ELISA reading results of MCF7 cell numbers when treated with Propolis-2 and DMSO. ... 131 Table 8.17: The ELISA reading results of HCC-1937 cell numbers when treated with Propolis-1 and DMSO. ... 132 Table 8.18: The ELISA reading results of HCC-1937 cell numbers when treated with Propolis-2 and DMSO. ... 133 Table 8.19: The ELISA reading results of MDA-MB-157 cell numbers when treated with Propolis-1 and DMSO. ... 134 Table 8.20: The ELISA reading results of MDA-MB-157 cell numbers when treated with Propolis-2 and DMSO. ... 135 Table 8.21: The ELISA reading results of BT-20 cell numbers when treated with Propolis-1 and DMSO. ... 136 Table 8.22: The ELISA reading results of BT-20 cell numbers when treated with Propolis-2 and DMSO. ... 137 Table 8.23: The ELISA reading results of MDA-MB-361 cell numbers when treated with Propolis-1 and DMSO. ... 138
xviii
Table 8.24: The ELISA reading results of MDA-MB-361 cell numbers when treated with Propolis-2 and DMSO. ... 139 Table 8.25: The ELISA reading results of BT-474 cell numbers when treated with Propolis-1 and DMSO. ... 140 Table 8.26: The ELISA reading results of BT-474 cell numbers when treated with Propolis-2 and DMSO. ... 141 Table 8.27: The ELISA reading results of ZR-75-1 cell numbers when treated with Propolis-1 and DMSO. ... 142 Table 8.28: The ELISA reading results of ZR-75-1 cell numbers when treated with Propolis-2 and DMSO. ... 143 Table 8.29: The ELISA reading results of hTERT-HME1 cell numbers when treated with Propolis-1 and DMSO. ... 144 Table 8.30: The ELISA reading results of hTERT-HME1 cell numbers when treated with Propolis-2 and DMSO. ... 145
xix
Abbreviations
°C degree Celsius
APS Ammonium persulfate
bCSCs breast cancer stem cells
BRCA1 breast cancer type 1 susceptibility protein BRCA2 breast cancer type 2 susceptibility protein
BSA Bovine serum albumin
CAPE Caffeic acid phenethyl ester caspase-3 cysteinyl-aspartate proteases-3
CI Cell Index
CO2 Carbon dioxide
Conc. Concentration
ddH2O Double-distilled water
DEP DMSO extract of propolis
DMEM Dulbecco’s modified Eagle's medium
DMSO Dimethyl sulfoxide
DNA Deoxyribonucleic acid
EDTA Ethylenediaminetetraacetic acid EEP ethanol extract of propolis
EGF Epidermal growth factor
ELISA Enzyme-linked immunosorbent assay
ER estrogen receptor
etc et cetera
FACS Fluorescence-activated cell sorting
FBS Fetal bovine serum
G2/M Gap 2/Mitosis
h hour
HDACi histone deacetylase inhibitor
HER2(ERBB2) Human Epidermal Growth Factor Receptor 2 IC50 The half maximal inhibitory concentration
kDa kiloDalton
LNCaP androgen-sensitive human prostate adenocarcinoma cells
MMP matrix metalloproteinase
n/a not available
xx
NF-κB nuclear factor kappa-light-chain-enhancer of activated B cells nm nanometer NP-40 nonyl phenoxypolyethoxylethanol OD Optical Density p53 protein 53 PAR Poly(ADP-ribose)
PARP-1 Poly(ADP-ribose) Polymerase-1
PBS Phosphate buffered saline
PI Propidium iodide
Post-EMT Post-Epithelial–mesenchymal transition
PR progesterone receptor
rpm Revolutions per minute
RPMI Roswell Park Memorial Institute medium
SDS Sodium dodecyl sulfate
SEM Standard error of the mean
SRB Sulforhodamine B
TBS for SRB Tris Base Solution TBS for Western Tris-buffered saline
TBS-T Tris-buffered saline with Tween 20
TCA Trichloroacetic Acid
TEMED Tetramethylethylenediamine
TNF Tumor necrosis factors
TRAIL TNF-related apoptosis-inducing ligand
ul microliter
VEGF Vascular endothelial growth factor
WEP water extract of propolis
wt wild type
1
1 INTRODUCTION
1.1 Breast Cancer
Malignant tumors can invade the surrounding cells or metastasize to other parts of body. It is defined as breast cancer when the malignant tumor starts in the cells of breast (cancer.org; American Cancer Society). Healthy breast consists of fat, connective tissue, blood and lymph vessels (Figure 1-1).
2
Breast cancer is the most common cancer type and the leading cause of cancer death among women worldwide (Table 1.1). Increase in the age is the most important risk factor and BRCA1 & BRCA2 inherited mutations increase the risk (cancer.org; American Cancer Society).
Table 1.1 The two most common types of new cancer cases and deaths by world area, 2008 (cancer.org; American Cancer Society).
1.1.1 Classification of Breast Cancer
Since breast consists of epithelial cells, almost all of the breast cancers are carcinomas. Some of them are adenocarcinomas if cancer starts from ducts or lobules of the breast which produces milk. Carcinoma in situ is the early stage of the cancer and this is referred to as non-invasive or pre-invasive (cancer.org; American Cancer Society). On the other hand, infiltrating carcinomas are invasive and
3
constitutes more than 95% of all mammary carcinomas (Yoder, 2007). Both carcinomas can be ductal or lobular.
Molecular classification is very important for breast cancer because of the heterogeneous nature of the cancer. Basal and luminal cells are the two distinct epithelial subtypes of mammary gland (Perou, 2000). Luminal subtype can be
divided into Luminal A and Luminal B as their gene expression pattern (Sorlie, 2003). Also another subdivision came from Neve et. al. as Basal A and Basal B (Neve, 2006). Dawson et. al. introduced a novel categorization in recently published article. This categorization includes 10 “integrative clusters” which are generated from
molecular information of genomic and transcriptomic features of breast cancer (Dawson, 2013). Categorization of Breast cancer is important for the sake of proper treatment to each subtype of breast cancer. Different drugs may affect a subtype of breast cancer which can be linked with its molecular properties.
1.1.2 Breast Carcinoma Cell Lines
BT-20 was the first breast carcinoma cell line to be established in 1958. Followed by MD Anderson series of breast carcinoma cell lines and the most famous one, MCF7 was established by Michigan Cancer Foundation in 1973. Cell lines are good models of breast cancer research (Holliday, 2011). Classification of cell lines is also
important to use the right cell line as model. For example, a specific kinase inhibitor was shown that it preferentially inhibits proliferation of luminal estrogen receptor-positive human breast carcinoma cell lines (Finn, 2009). Different compounds may have selective effect on subtypes of breast cancer and this can be linked with its molecular properties of the subtype. Some of the characteristics of the breast carcinoma cell lines are summarized in the Table 1.2.
4
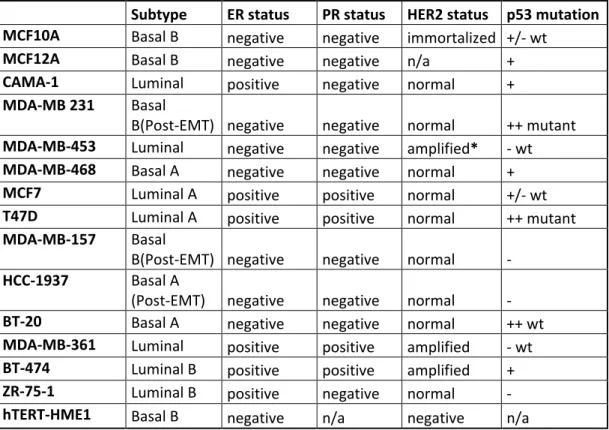
Table 1.2 Properties of Breast carcinoma cell lines. {* = amplified but not highly expressed, n/a = not available, wt = wild type, ER = estrogen receptor, PR =
progesterone receptor, HER2[ERBB2] = Human Epidermal Growth Factor Receptor 2} (Neve, 2006; Kao, 2009; Finn, 2009; Holliday, 2011).
Subtype ER status PR status HER2 status p53 mutation MCF10A Basal B negative negative immortalized +/- wt
MCF12A Basal B negative negative n/a +
CAMA-1 Luminal positive negative normal +
MDA-MB 231 Basal
B(Post-EMT) negative negative normal ++ mutant
MDA-MB-453 Luminal negative negative amplified* - wt
MDA-MB-468 Basal A negative negative normal +
MCF7 Luminal A positive positive normal +/- wt
T47D Luminal A positive positive normal ++ mutant
MDA-MB-157 Basal
B(Post-EMT) negative negative normal -
HCC-1937 Basal A
(Post-EMT) negative negative normal -
BT-20 Basal A negative negative normal ++ wt
MDA-MB-361 Luminal positive positive amplified - wt
BT-474 Luminal B positive positive amplified +
ZR-75-1 Luminal B positive negative normal -
hTERT-HME1 Basal B negative n/a negative n/a
1.2 Biological Compound Propolis
From ancient times to today, humankind faced to reality of breast cancer and tried different treatments varies from organic supplies to surgical operations. We are still looking for a cure for cancer in general. If we assume that nature has a remedy for all problems, we should look for the remedy for treatment of breast cancer. In this case we are looking for it in a beehive where propolis comes from.
5
Propolis or bee glue is a yellow-brownish resinous compound which is collected from various plants and combined with wax and bee enzymes by worker bees. This mixture is used to smooth out hive walls, to protect bees from diseases because of its antiseptic features and also to embalm the carcasses of invader insects to avoid decomposition (Sforcin, 2011). The word propolis comes from a Greek origin which pro is ‘in front of’ or ‘at the entrance to’ and polis is city -in this case, hive- therefore propolis means that a material in defense of the hive (Castaldo, 2002).
Using propolis as a medicine has a long history dating back to ancient times. For instance, Ancient Egyptians used propolis to embalm the cadavers and Ancient Greeks and Romans used propolis as an anti-inflammatory agent to heal wounds and ulcers. Also it was accepted as an official drug in London in 17th century (Salatino, 2011). Still, it is widely used among Balkan States. There are also studies that show propolis having no side effect to mice or human (Sforcin, 2007). Recently, there are many studies associated with propolis extracts aiming to find new
treatment possibilities in diverse research fields such as immunology, oncology, infectious diseases, allergy, diabetes, ulcers, etc (Sforcin, 2011).
Chemical composition of propolis varies by the geographical status and by the different races of honeybees. Different studies are going on with local propolis extracts such as Cuban, Brazilian, Chinese, Indian etc. (Monzote, 2012; Sforcin, 2011; Sun, 2012; Thirugnanasampandan, 2012). Propolis is mainly composed of resins which comes from plants those honeybees collect from. Hence, propolis extracts from different geographical origin have a specific combination of chemicals that reflect the floral properties of the field (Salatino, 2011). Sibel Silici and
Semiramis Kutluca showed that Turkish propolis collected form Erzurum region have a number of chemical compounds which were identified from propolis for the first time (Silici, 2005).
Diversity of propolis has both advantages and disadvantages for the research. Distinct compounds found in propolis may have novel benefits for the drug
6
discoveries or they may construct a novel synergistic effect with regular compounds found in propolis. Major disadvantage would be the problem of standardization of propolis as a possible drug; however there are many ways to overcome this problem. The most common solution to standardize of propolis is to categorize propolis according to its chemical composition and source of plant. Six main types of propolis are poplar propolis, birch propolis, Brazilian green propolis, red propolis, pacific propolis and Canarian propolis (Bankova, 2005). When the standardization problem is defeated, the use of propolis is “safe and less toxic than many synthetic medicines” (Castaldo, 2002).
1.2.1 Propolis Extracts
Propolis extraction is made with alcoholic solvents or water, generally. The most common solvent is absolute ethanol, methanol and water follows it. While water extraction has 7% activity, alcoholic extractions can reach up to 28% activity. Also triglyceride extraction patent is held by Japanese researchers (Ashry, 2012). Since the chemical composition of propolis is very complex (propolis consist of more than 300 components), solvent of the extraction method affects the activity of propolis. Different compounds in the mixture can solubilize in different solvents so that each extraction material gives different outcomes (Sforcin, 2007).
Turkish researchers were able to extract the propolis with dimethyl sulfoxide (DMSO) which can dissolve both polar and nonpolar compounds (Aliyazicioglu, 2005). DMSO maximizes the penetration of compounds to the cells as well as it is a good solvent for flavonols (one of the most common compound in propolis) (Cai, 2011). According to one of the studies, DMSO extract of propolis (DEP) is richer in polyphenols and flavonoids than water extraction of propolis (WEP). They also claim that the antioxidant potentials of those two extracts are parallel with the total phenolic compounds in each extract (Barlak, 2011).
7
Propolis composition is highly variable considering the plant source, bee race, geographical and seasonal diversity. In general, propolis contains flavonoids such as chrysin, acacetin, apigenin, and phenolic acids like cinnamic acid, caffeic acid, etc (Table 1.3). Propolis also includes some vitamins and minerals as well as fatty acids (Khalil, 2006). Some of the researchers use the whole extract of propolis whereas others prefer to use active components of it. Even though using an individual constituent of propolis is an effective way of standardization, there might be a synergic effect of components within the propolis extract. This effect can be the reason that propolis has different pharmacological activities (Banskota, 2001).
Table 1.3 Chemical Composition of Propolis (Sawicka, 2012).
Compounds Percentage
Fatty and Aliphatic Acids 24-26 %
Flavonoids 18-20 %
Sugars 15-18 %
Aromatic Acids 5-10 %
Esters 2-6 %
Vitamins 2-4 %
Alcohol and Terpens 2-3.3 %
Microelements 0.5-2 %
8
1.2.2 Antitumoral Activity of Propolis and Its Active Components
Propolis is a research subject for its antitumoral activity all over the world with local extracts since its composition changes with its origin. The common point of the anti-cancerous effects of propolis is the ability of propolis to trigger apoptosis in cancer cells. Some of the active components of propolis as well as alcoholic extractions or water-soluble derivatives of propolis were shown to induce apoptosis in cancer cells depending on the concentration (Sawicka, 2012). There are many studies conducted on propolis or its active components for treatment of cancer which reveals the potential of this biological compound in the development of novel anti-cancerous agents.
Numerous studies claim that polyphenols in propolis, activates TRAIL-induced apoptosis in cancer cells. Naringenin in lung cancer, Biochanin A in prostate cancer, Kaempferol in glioma and chrysin, quercetin, apigenin in various cancer cells were particularly identified as a synthesizer of TRAIL-induced apoptosis (Szliszka, 2013). Synthesizing cancer cells to TRAIL-targeted therapies with propolis or its
polyphenols would increase the anticancer activity of TRAIL so that TRAIL-resistance may be overcome by propolis treatment.
Artepillin C (3,5-diprenyl-4-hydroxycinnamic acid) is one of the active components of propolis which causes significant damage to carcinoma and malignant melanoma. Intratumor injection of Artepillin C (500g, three times a week) increases the number of helper T cells in addition to suppression of tumor growth in mice (Khalil, 2006). Caffeic acid phenethyl ester (CAPE) is a strong antioxidant, extracted from propolis and it is a well-known NF-κB specific inhibitor (Figure 1-2). It suppresses the cell proliferation of some metastatic prostate cancer cell lines as well as sensitizes cancer cells to radiation and chemotherapeutic drugs. LNCaP (androgen-sensitive human prostate adenocarcinoma cells) xenograft nude mice were orally treated with CAPE (10 mg/kg per day for six weeks) and consequently tumor volume was
9
reduced 50% (Liu, 2013). As a result of these findings, it is hypothesized that CAPE can be an effective adjuvant therapy for prostate cancer.
Figure 1-2 The Chemical Structure of Caffeic acid phenethyl ester (CAPE) C17H16O4 (Akyol, 2012).
As a candidate anti-cancer agent, propolis can be a relatively inexpensive solution for cancer treatment. Administration of propolis does not lead to side effects on rats or humans along with the fact that it can reduce side effects of cancer treatment (Watanabe, 2011). A research group from Turkey also supports that usage of CAPE prevents the damages and side effects of chemotherapy and radiotherapy. They propose the usage of CAPE as a protective agent during
chemotherapy in clinical trials (Akyol, 2012). A research group from Taiwan claims that CAPE has an anti-metastatic and anti-angiogenic effects on cancer cells. Even though the exact mechanism of anti-metastatic activity of CAPE is not revealed yet, they demonstrated that CAPE has effects on destruction of capillary-like tube formation, inhibition of tumor cell invasion, and elimination of VEGF level in vitro and in vivo (Liao, 2003).
Another usage of active components of propolis is as a histone deacetylase inhibitor (HDACi). with anticancer activity. Chrysin (Sun, 2012) and NMB-HD-1 (Huang, 2012) are examples of HDACis synthesized from propolis. Chrysin, a known potent
anticancer compound, is a HDAC8 inhibitor as well as it can significantly inhibit tumor growth. Chrysin is also important for the standardization of Chinese propolis since it is the major index compound (Sun, 2012). NMB-HD-1 has an
10
xenograft model exhibited antitumor activity. This outcome may involve HDAC inhibition which changes chromatin core histones so that expression of cell cycle regulating genes changes. Another possibility is the suppression of PTEN/AKT pathway which inhibits cancer cell growth (Huang, 2012).
1.2.3 Synergistic Effects of Propolis with Other Chemotherapeutic Drugs
Propolis have various functional and biological properties such as antibacterial (Grange, 1990)., antimicrobial (Monzote, 2012), anti-oxidative
(Thirugnanasampandan, 2012), antiviral (Viuda-Martos, 2008), hepatoprotective (Albukhari, 2009), anti-cancerious (Sawicka, 2012), anti-ulcerous (Viuda-Martos, 2008) as well as anti-inflammatory (Banskota, 2001). Especially anti-oxidative and anti-inflammatory features of propolis make it a promising candidate as an adjuvant to chemotherapy.
More than 70% of antitumor agents are natural compounds or materials derived from natural products (Watanabe, 2011). Propolis is one of the candidates for such products while paclitaxel is already one of them. Paclitaxel also known as Taxol® is an anticancer agent which was isolated from bark of Taxus brevifolia (Figure 1-3) (Khosroushahi, 2011).
11
Figure 1-3 Picture of Taxus brevifolia (Pacific Yew) which Paclitaxel was isolated from (McMullen, 2008).
Paclitaxel is widely used for treatment of breast cancer, non-small cell lung cancer, ovarian cancer, melanoma, head and neck cancer. Giving paclitaxel in combination with propolis, results in maximum protection from induced mammary
carcinogenesis in rats. Treating breast cancer-bearing rats with 50 mg propolis per kg body weight along with 33 mg paclitaxel per kg body weight reduces the toxic side effects of paclitaxel by propolis’ immunemodulatory activity. Another effect of propolis is free radical scavenging activity against alkoxyl radicals that is due to the antioxidant property of propolis. Synergistic action of propolis mixture is distinct from the action of a single component since there are diverse effects of propolis on cancer treatment (Padmavathi, 2006).
In another study, ethanolic extract of propolis was used with temozolomide to inhibit U87MG (human glioblastoma cell line) cell line growth. Researchers affirmed that propolis has cytotoxic effects as well as growth inhibiting activity in
combination with temozolomide. They think there is at least partial relationship between cytotoxic properties and reduced activity of NF-κB since NF-κB is an essential survival factor for glioblastomas (Markiewicz-Żukowska, 2013).
12
Caffeic acid phenethyl ester (CAPE), an active component of propolis was found to change the characteristics of breast cancer stem cells (bCSCs). CAPE inhibits the self-renewal and clonal expansion in soft agar, also decrease the CD44 (cell surface markers for bCSCs) content and malignancy in bCSCs. Another effect of CAPE is that it increases the cycling state of bCSCs so that susceptibility to chemotherapeutic agents of bCSCs increases. In conclusion, CAPE can be used effectively for cancer treatment in combination with other chemotherapeutic agents (Omene, 2012).
1.3 Cell Death
Carl Vogt was the first one to describe cell death in 1842 following the
establishment of cell theory. He observed the elimination of cells and replacement of them by new cells (Clarke, 2012). Stress to the cellular system causes cell death with a diverse and complex process. Apoptosis, necrosis, autophagy and mitotic cell death are the known cell death types for today. An individual cell may have a heterogeneous behavior within a population as well as cell death can also be a heterogeneous property. Both biochemical and morphological properties may cause the heterogeneity in cellular systems (Stevens, 2013). Apoptosis and
autophagy are the most well-known programmed cell death mechanism however there is third one: programmed necrosis. These are the three main forms of programmed cell death and they balance survival with cell death for normal cells (Ouyang, 2012).
13
1.3.1 Apoptosis
In the case of cellular life, death program comes with the code which gives the life itself. In case of emergencies, cells kill themselves for the sake of population of other cells. This is also parallel with the evolutionary development since cells cannot pass their genetic information if the information is damaged.
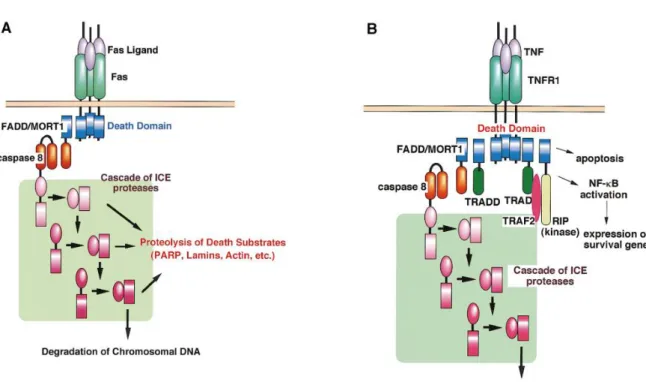
Figure 1-4 Fas-induced and TNF-induced Apoptosis Models (Nagata, 1997).
If the DNA damage is irreversible, major type of cell death is the apoptosis. Apoptosis can be triggered by two different pathways: death receptor (extrinsic) and mitochondrial (intrinsic) pathway. When plasma-membrane death receptor, Fas binds to its extracellular ligand Fas-L; the extrinsic pathway triggers. Both TNF and Fas induces extrinsic pathway of apoptosis (Figure 1-4). Mitochondrial pro-enzymes control the intrinsic pathways of apoptosis (Ouyang, 2012).
14
1.3.2 Poly(ADP-ribose) Polymerase-1 (PARP-1) Cleavage
Single and double stranded DNA breaks activate the nuclear protein PARP and PARP is also involved in DNA repair, cell cycle regulation, differentiation and
transformation mechanisms (Whitacre, 1999). PARP binds to DNA single strand brakes and induces a structural modification to promote base excision repair. Poly(ADP-ribose) (PAR) recruits other DNA damage proteins to the close vicinity and PARP induces the synthesis of PAR. Following Poly(ADP-ribosyl)ation (PARylation), PARP is needed to be cleaved by cysteinyl-aspartate proteases-3 (caspase-3) (Nowsheen, 2012).
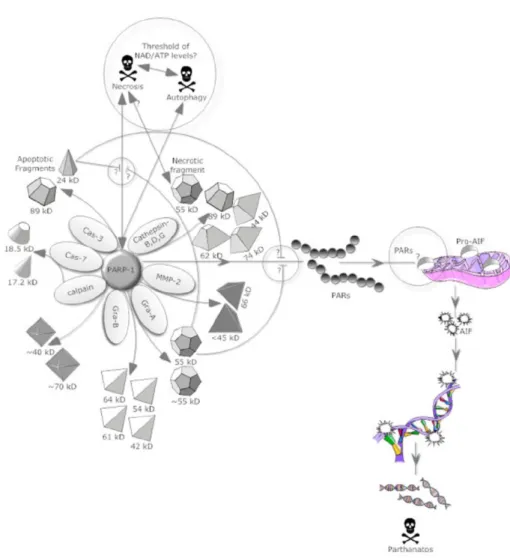
Caspases, calpains, cathepsins, granzymes and matrix metalloproteinases (MMPs) are some of the suicidal proteases which cleave PARP from different sites so that signature fragments appear (Figure 1-5). Each cleaved fragment has its specific molecular weight therefore fragments can be used as a biomarker for specific cell death program (Chaitanya, 2010).
15
Figure 1-5 Various Fragments of PARP-1 after cleaved by specific suicidal proteases (Chaitanya, 2010).
PARP-1 cleavage by caspases is considered as a hallmark of apoptosis. There are 2 different possible fragments after the cleavage of PARP by caspases: 85 and 89 kDa fragments. These fragments are indicators of apoptosis of the cell. The full-length protein is 116 kDa and cleavage by caspase-3 results in 89 kDa fragment. However, cleavage by caspases-7 yields two specific fragments, 89 and 24 kDa (Chaitanya, 2010). Therefore detection of one of these bands shows the association of apoptosis. On the other hand, 50 kDa fragment is detected during necrosis (Buontempo, 2010).
16
2 Materials
2.1 Propolis Extract
Propolis extracts were kindly provided by Prof. Dr. Orhan Değer from Karadeniz Technical University, Faculty of Medicine, Department of Medical Biochemistry. Two different batches of DMSO extracts of propolis were used in this study; first batch is 25 mg/ml (Propolis-1) and second batch is 100 mg/ml (Propolis-2). Propolis was collected from different regions of Turkey by Fanus Gıda Corporation (Trabzon, Turkey) and extractions were prepared in laboratories of Karadeniz Technical University with the following method: Natural propolis was grinded and mixed until it became powder. For 25 mg/ml propolis extract, 0.5 g of propolis powder was mixed with 20 ml DMSO and vortexed. Mixture was incubated on the shaker at 150 rpm for 24 hours at 60°C for propolis to dissolve. Mixture was filtered with filter paper and the extracts were kept in dark at +4°C. 100 mg/ml propolis extract was prepared with the same procedure.
2.2 Growth Mediums
17 Table 2.1 Growth mediums of cell lines
18
2.3 Buffers and Solutions
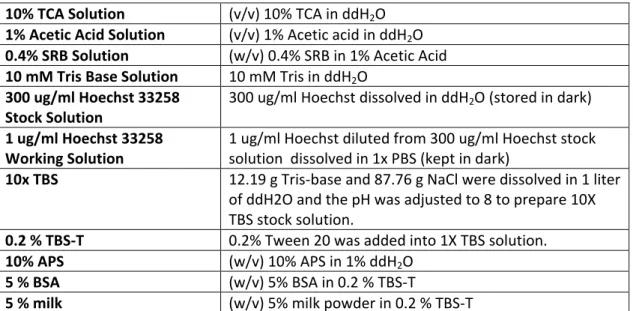
Table 2.2 General Solutions
10% TCA Solution (v/v) 10% TCA in ddH2O
1% Acetic Acid Solution (v/v) 1% Acetic acid in ddH2O
0.4% SRB Solution (w/v) 0.4% SRB in 1% Acetic Acid
10 mM Tris Base Solution 10 mM Tris in ddH2O
300 ug/ml Hoechst 33258 Stock Solution
300 ug/ml Hoechst dissolved in ddH2O (stored in dark)
1 ug/ml Hoechst 33258 Working Solution
1 ug/ml Hoechst diluted from 300 ug/ml Hoechst stock solution dissolved in 1x PBS (kept in dark)
10x TBS 12.19 g Tris-base and 87.76 g NaCl were dissolved in 1 liter of ddH2O and the pH was adjusted to 8 to prepare 10X TBS stock solution.
0.2 % TBS-T 0.2% Tween 20 was added into 1X TBS solution.
10% APS (w/v) 10% APS in 1% ddH2O
5 % BSA (w/v) 5% BSA in 0.2 % TBS-T
5 % milk (w/v) 5% milk powder in 0.2 % TBS-T
Table 2.3 Cell Lysis Buffer
Reagent Final concentration
Tris-HCl (pH:8.0) 50 mM
NaCl 150 mM
NP-40 1 %
SDS 0.1 %
Protease Inhibitor 1x
ddH2O Rest of the solution
Table 2.4 Bradford Stock Solution
Coomassie brilliant blue 17.5 mg
Ethanol 4.75 ml
Phosphoric acid 10 ml
final volume with ddH2O= 25 ml
Table 2.5 Bradford Working Solution
Bradford stock solution 1.5 ml
95% Ethanol 0.75 ml
Phosphoric acid 1.5 ml
19
Table 2.6 5x Loading Dye
Tris-HCL, pH:6.8, , 62.5 mM
β-mercaptoethanol 5%
glycerol 15%
bromophenol blue. 0.001%
SDS 2%
Table 2.7 30% Acrylamide/Bisacrylamide Solution
Acrylamide 29 gr
Bisacrylamide 1 gr
final volume with ddH2O= 100 ml stored in the dark
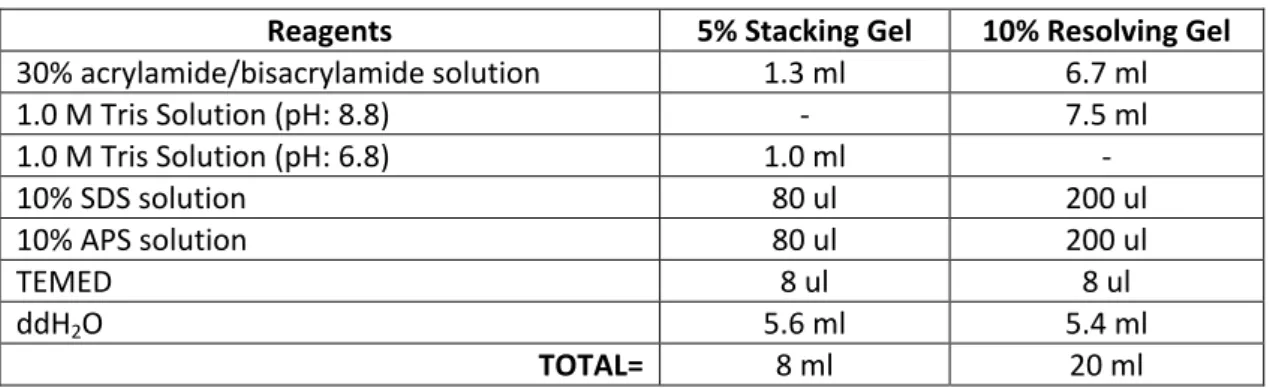
Table 2.8 SDS Gel Formulation to Prepare two Gels
Reagents 5% Stacking Gel 10% Resolving Gel
30% acrylamide/bisacrylamide solution 1.3 ml 6.7 ml 1.0 M Tris Solution (pH: 8.8) - 7.5 ml 1.0 M Tris Solution (pH: 6.8) 1.0 ml - 10% SDS solution 80 ul 200 ul 10% APS solution 80 ul 200 ul TEMED 8 ul 8 ul ddH2O 5.6 ml 5.4 ml TOTAL= 8 ml 20 ml
Table 2.9 5x Running Buffer
Tris 45 g
Glycine 216 g
SDS 15 g
final volume with ddH2O= 3 liters
Table 2.10 Wet Transfer Buffer
Tris 6 g
Glycine 28.8g
Methanol 15%
20
Table 2.11 Antibodies and Their Solutions
Primary Antibodies
PARP-1 (Cell Signaling 46D11): 1:200 in 5% BSA in 0.2 % TBS-T
β-actin (Sigma A5441): 1:5000 in 5% milk powder in 0.2% TBS-T
Secondary Antibodies
Anti-Mouse IgG (Sigma A9044): 1:5000 in 5% milk powder in 0.2% TBS-T
Anti-Rabbit IgG (Sigma A0545): 1:5000 in 5% BSA in 0.2 % TBS-T
Table 2.12 Propidium Iodide (PI) Staining Solution
Propidium Iodide (PI) stock 50 ug/ml
RNAse-A 0.1 mg/ml
Triton X 0.05%
Dissolved in PBS
2.4 General Materials
Table 2.13 Production Information of Materials
Material Catalog Number Company DMEM (Low Glucose) SH30021.01 Hyclone
Acetic Acid 27225-2.5L-R Sigma Aldrich
Acrylamide BP170-500 Fisher Scientific
Adriamycin (ADRIMISIN 10 mg)
L01DB01 Saba İlaç
APS 420627 Carlo Erba
Bisacrylamide A3636,0250 AppliChem
Bovine Pituitary Extract 13028-014 Gibco
Bromophenol blue. B5525 Sigma Aldrich
21
Material Catalog Number Company Coomassie brilliant blue 27816 Fluka
D-Glucose 16325 Riedel de Haen
DMEM/Ham's F12 F4815 Biochrom
DMSO A3672,0100 AppliChem
EGF E9644-2MG Sigma Aldrich
Ethanol CAS-64-17-5 AlcoMED
FBS SV30160.03 Hyclone
Glycerol 346165 Carlo Erba
Glycine EC200-272-2 Fisher Scientific
Hoechst 33258 861405 Sigma Aldrich
Hydrocortisone H0888-19 Sigma Aldrich
Insulin I1882-100MG Sigma Aldrich
Isopropanol 1.009.952.500 MERCK
L-Glutamine K0293 Biochrom
Methanol 24229-2.5L-R Sigma Aldrich
Milk powder - Sütaş
NaCl 1,06404,1000 MERCK
Nitrocellulose Membrane RPN3032D Amersham
Nonessential Amino Acids BE13-114E Lonza
NP-40 NonidetP-40 AppliChem
Parafilm PM.996 Pechiney
PBS BE17-516F Lonza
Penicillin/Streptomycin SV30010 Hyclone
Phosphoric acid 4107 Riedel de Haen
Propidium Iodide (PI) D4864 Sigma Aldrich
Protease Inhibitor 11873580001 Roche
RNAse-A EN0531 Thermo Scientific
RPMI Medium SH30096.01 Hyclone
SDS L5750 Sigma Aldrich
Sodium Pyruvate 11360 Gibco
Sulforhodamine B (SRB) S1402 Sigma Aldrich
Trichloroacetic Acid (TCA) 33731-100G Sigma Aldrich
Tris 826 Amresco
Tris-Base T1503-1KG Sigma Aldrich
Tris-HCl T-3253 Sigma Aldrich
Trypsin/EDTA SH30236.01 Hyclone
Tween 20 0777-1L Amresco
22
3 Methods
3.1 Cell Culture Techniques
3.1.1 Growth Conditions
Every cell line was grown in their appropriate growth medium which is listed in the materials section Table 2.1. Cells were passaged when their confluence was over 70%. Some of the cells were passaged 1:2 while some fast growing cell lines were passaged 1:5. When cells reached confluency the growth medium was removed and the cells were washed with 1xPBS. 1 ml pre-warmed Trypsin/EDTA was spread into 75 cm2 flasks and incubated at 37°C for 1-2 minutes. When cells detached from the flask surface, trypsin was inactivated with FBS containing fresh culture medium. Cells were dispersed by pipetting up and down a few times. Cells were transferred to new culture flasks and incubated in a 5% air jacketed CO2 incubator at 370C.
23
3.1.2 Cryopreservation of Cells
Cells were incubated 24 h after passaging and 75 cm2 flask full of cells was frozen into one tube. Their growth medium was removed and washed with 1x PBS. 1 ml Trypsin/EDTA was spread into 75 cm2 flasks and incubated at 37°C for 1-2 minutes. When cells appeared to have lost their adherence, trypsin was inactivated by adding fresh medium which contains FBS. Cells were transferred into 15 ml tubes and centrifuged at 1500 rpm for 5 minutes. Cryopreservative medium was freshly prepared by mixing 90% FBS and 10% DMSO. After centrifugation, medium was removed and cell pellets were suspended within 1 ml freezing medium. Each cell pellet was stored in separate cryotubes at -20°C for 1 hour and -80°C or in liquid nitrogen for long term storage. Each vial contains approximately 3-4 millions of cells.
3.1.3 Reculturing Frozen Cells
Frozen cells need to be thawed rapidly therefore they were melted down in a water bath at 37°C. Melted cells were mixed with 5 ml pre-warmed growth medium and centrifuged at 1500 rpm for 5 minutes. After centrifugation, DMSO containing freezing medium was removed and cell pellets were suspended within 5 ml fresh growth medium and transferred into 25 cm2 flask. Cells were incubated at 37°C with 5% CO2 air. Next day, the growth medium was removed and the cells were washed with 1x PBS. If the cells were confluent enough, the cells were cultured into 75 cm2 flask as described above. Cells were incubated at 37°C with 5% CO2 air. The cells were passaged at least once before using for further manipulations.
24
3.1.4 Storing Cell Pellets for Protein Isolation
The cells pellets were collected for protein extraction to use for Western blot experiments. The drug treated and un-treated cells were cultured in 6 well plates. Since apoptotic cells detach from the plate surface and remain in the growth media, growth medium in each well was collected into separate 15 ml tubes. The wells were washed with 1x PBS and PBS was added into same 15 ml tubes detached cells containing growth medium. 0.3 ml Trypsin/EDTA was spread into each well of 6 well plate to detach the adherent cells and incubated at 37°C for 1-2 minutes. When cells appeared to have lost their adherence, trypsin was inactivated by adding fresh medium which contains FBS. Cells were transferred into appropriate tubes containing the cells collected from the previous steps and centrifuged at 1500 rpm for 5 minutes at +4°C. The supernatant was removed and the cell pellets were resuspended with ice-cold 1x PBS. Tubes were centrifuged at 1500 rpm for 5 minutes at +4°C. PBS was removed and tubes were soaked in liquid nitrogen immediately to freeze them. Pellets were stored at -80°C for further experiments.
3.1.5 Cell Counting with Haemocytometer
Haemocytometer was used to determine the number of cells in the cell cultures. Certain number of cells was required for IC50 calculations, xCELLigence and other propolis treatment experiments. The cultured cells were trypsinized and resuspended in culture mediums as described above. Haemocytometer was cleaned with 70% ethanol and a coverslip was gently put onto the chamber area. The cell suspension was mixed gently to ensure equal distribution of the cells in the tube and then 10 ul of cell suspension was taken and placed into the edge of the chambers. Two chambers were used for counting. The cells in 16 corner squares were counted under the light microscope for both chambers of Haemocytometer.
25
Average of those numbers was multiplied with 104. This gives the approximate cell number within 1 ml of cellular solution. The certain amount of cells for each cell line was used for various experiments.
3.2 Sulforhodamine B (SRB) Assay
Different cell lines were plated (Table 3.1) into the 96 well plates and treated with Propolis-24 hours later. At a given amount of time later, cells need to be fixed to stop further cell growth. After fixation cells were stained with SRB and the color intensity was measured with ELISA reader. Resulting optical density (OD) is correlated with the amount of cells.
Table 3.1 Starting cell number for IC50 calculations
Propolis-1 Propolis-2 BT-20 12,000 12,000 BT-474 20,000 10,000 CAMA-1 4,000 4,000 HCC-1937 10,000 8,000 hTERT-HME1 6,000 6,000 MCF10A 4,000 5,000 MCF12A 5,000 6,000 MCF7 3,000 3,000 MDA-MB 231 4,000 7,000 MDA-MB-157 10,000 10,000 MDA-MB-361 20,000 20,000 MDA-MB-453 4,000 8,000 MDA-MB-468 4,000 4,000 T47D 5,000 4,000 ZR-75-1 5,000 6,000
26
3.2.1 Trichloroacetic acid (TCA) Fixation
For propolis and DMSO control treated cells, fixation was done as following method for each well. These cells were plated and after 24 h, treated with either propolis or DMSO. Cells need to be fixed after 72 h incubation of treatment. This part was done by using multi-channel pipetting for 96 well plate.
Remove growth medium with pipet
Add 100-200 ul PBS at room temperature and shake gently (Add 500 ul for 24 well plates)
Remove PBS with pipet
Add 50 ul ice-cold 10% TCA solution (Add 200 ul for 24 well plates) Incubate at +4°C for 1 hour
Wash with excess ddH2O for 5 times Leave at room temperature for air dry
3.2.2 Sulforhodamine B (SRB) Staining
TCA fixed and air-dried plates were stained with SRB dye solution for further measurements as in the following method:
0.4% SRB prepared with 1% acetic acid solution
Add 50 ul SRB solution to each well and make sure that solution covers all the bottom surface of each well (Add 200 ul for 24 well plates)
Incubate the dye at room temperature for 10 minutes in dark. Wash with excess 1% acetic acid solution 5 times
Leave at room temperature for air dry
Add ice-cold 100 ul 10mM Tris-base solution (Add 500 ul for 24 well plates) Solubilize the dye in the Tris-base solution on the shaker for 5 minutes Read the results with ELISA reader at 515 nm
27
3.3 IC
50Calculations
For the IC50 calculations SRB assay results were used. Cells were treated with propolis and DMSO control with serial diluted concentrations of propolis for at least 5 different concentrations. Samples were collected and calculated at least in triplicates. OD results were then converted to the percent cell death values by using following formula. At a given concentration:
percent cell death = (1 – average OD propolis/average OD DMSO)*100
Percent cell death values of each concentration were calculated and drawn on an X-Y Scatter graph on Excel sheet. For this graph logarithmic trend line was added and 50% inhibition intersection was calculated with given formula on Excel:
IC50 value =EXP((50 – y-intersection point of trend line)/ slope of trend line)
This formula gives IC50 value of propolis at a given time point for particular cell line. Also coefficient of determination was checked to see the significance of calculated IC50 value. That was calculated by Excel by R2 value of the trend line. For this study IC50 values were calculated only if the R2 values are in between 0.75 -1.00.
3.4 Statistical Analyses
Standard Error of the Mean (SEM)
To determine the standard deviation between triplicate or quadruplicate samples, SEM analysis was performed. STDEVA function was used for the calculation of
28
standard deviation and the result was divided by square root of sample number. The result shows the standard error of the mean (SEM) for selected samples.
SEM = STDEVA (Sample1, sample2,…) / (√ sample number)
Student’s t-test
To calculate the significance of two groups such as luminal-basal, ER positive-negative, etc. T-TEST function was used with Microsoft Excel. Function was used to compare the significance of two subgroups with tailed distribution and two-sample unequal variance. P<0.05 were analyzed as significant result.
3.5 Live Cell Proliferation Assay (xCELLigence)
The xCELLigence is a system that monitors dynamic cellular events in real time and gives quantitative information about biological status of the cells including cell number and viability. This system enabled to provide good sensitivity and reproducibility in monitoring an entire cell population in a culture well. The technology behind this system comes from the design of the platform. E-plate 96 is similar to 96 well plates but it contains electrode sensors integrated into the each well so that each well can be monitored separately. The electrode impedance (Z) increases as the number of cells increase on it (Figure 3-1).
29
Figure 3-1 Schematic Drawing of the Working Principle of xCELLigence (ACEA Bioscience Inc.)
Before inoculating the cells to the E-plate 96, 50 ul of growth medium was put into E-plate 96 wells for each cell line to obtain background readings (takes only 1 minute). This step also allows us to determine if there are any inconvenient wells exist in that particular plate so that a problematic well can be omitted from the experiment design and replaced with another well. The certain number of cells were from cell suspensions were added on top of growth mediums with 100 ul/well volume where the total volume will be 150 ul/well in total. The xCELLigence system (RTCA SP Station) where the cells were replaced was kept at 37°C with 5% CO2 air incubator during the experiment. Depending of the cell growth (between 24 to 72 hours), cells were treated with either DMSO or Propolis-2 with pre-determined concentrations. The treatment time point determined as the cells pass 0.75 Cell Index and before they reach to 1.25 Cell Index so that cells can be treated when they are in the log phase. At the beginning of the experiment, Cell Index values were recorded for every 30 minutes but after the drug treatment the Cell Index
30
values were recorded for every 10 minutes to observe the fast drug response. After the observation of fast drug response the counter changed into record Cell Index for every 30 minutes. Long-term drug response was recorded at least 72 hours after the drug treatment.
3.6 Nuclear Staining with Hoechst 33258
Cells (80,000 cells/well) were plated in cover slips in 6 well plates and after 24 h cells were treated with 0.1 % DMSO control or 100 ug/ml Propolis-2. Cells were incubated at 37°C with 5% CO2 air. After 48 h incubation, growth medium was removed and cells were washed with 1x PBS. After removal of PBS, cells were fixed with 1 ml ice-cold 100% methanol and kept for 10 minutes at +4°C. Cells were washed with ice-cold 1x PBS. 1 ug/ml Hoechst 33258 solution was prepared with ice-cold 1x PBS. After removal of PBS, cells were stained with 400 ul Hoechst solution and incubated at room temperature for 5 minutes in the dark. Then the cells were destained with ddH2O for 10 minutes at room temperature in the dark. Water was removed and cover slips were mounted on glass slides with glycerol. Cover slips were fixed onto the slides by wiping transparent nail polish to the edges. The stained cells’ nuclear morphology was examined under fluorescent microscope.
3.7 Western Blot
3.7.1 Cell Lysis
Cell pellets were taken from -80°C freezer and thawed on ice. Each pellet was resuspended with 50 ul (depending on to cell pellet size) cell lysis buffer, vortexed 3
31
times and left on ice for 30 minutes with occasional vortexing. Samples were centrifuged at 13000 rpm at +4°C for 15 minutes. The supernatant was taken into the fresh tubes. Protein samples were always stored in -80°C and kept on ice during the experiments.
3.7.2 Bradford Assay for Protein Quantitation and Sample Preparation
Bradford assay was used to determine the amount of protein in each cell lysate. BSA Standard Curve was prepared before using Bradford working solution. BSA samples were prepared in Cuvettes as in Table 3.2. Samples were measured with spectrophotometer at 515 nm wavelength and absorbance results were used to draw a BSA Standard Curve (Figure 3-2). Trendline of this curve was used for protein quantitation of samples.
Table 3.2 Sample Preparation for BSA Standard Curve
Vial # Blank 1 2 3 4 5 6
BSA (ug/ml) - 1 2 4 8 16 32
ddH2O (ul) 100 99 98 96 92 84 68
Bradford (ul) 900 900 900 900 900 900 900
32 Figure 3-2 BSA Standard Curve
After generating the BSA Standard Curve, protein samples were prepared as in Table 3.3 to measure with spectrophotometer at 515 nm wave length. The measurements were taken and the results were calculated with the trendline equation of BSA Standard Curve (y=0.2021x-0.2554). Since 2 ul of samples were loaded to the cuvettes, the results were divided by 2. Absorbance of samples and their protein concentrations were calculated and given in Table 3.4.
Table 3.3 Sample Preparation for Protein Quantitation with Spectrophotometer
Vial # Blank Samples
Cell Lysis Buffer (ul) 2 - Protein Sample (ul) - 2
ddH2O (ul) 98 98
Bradford (ul) 900 900