ing accurate excitation schemes in the finite-difference time-domain (FDTD) method are demonstrated. The effects of smoothing windows of various lengths and digital lowpass filters of various bandwidths and characteristics are investigated on finite-source excitations of the FDTD computational domain. Both single-frequency sinusoidal sig- nals and multifrequency arbitrary signals are considered.
1. INTRODUCTION
In parallel to the evolution of the computational resources in recent decades, application of the computer-based signal-processing (SP) techniques to digital representations of analog signals has been one of the most important topics in electrical engineering. Digital SP techniques, such as sampling, fast Fourier transformation (FFT), filtering, windowing, decimation, and interpolation, have been developed and widely used by almost all electrical engineers of various interests. In this paper, the application of some of these SP techniques to a particular area, namely, the excitation of the computational domain of the finite-difference time-domain (FDTD) technique [1] will be presented. Perfectly matched layer (PML) [2, 3] absorbing boundary conditions are used to terminate the three-dimensional (3- D) grid.
This paper presents the accuracy improvements obtained by applying the SP techniques to the finite-source excitation schemes. Similar improvements have been obtained and reported for the plane- wave excitation scheme [4-6]. The plane waves are generated in the 3-D grid using a 1-D look-up table, which is excited by a hard- source. The incident-field values are generated by the 1-D finite- difference equations, and the required incident-field values on the total- field/scattered-field interface of the 3-D grid are linearly interpolated from the 1-D look-up-table data [7]. The quality of these incident- field values can be increased by the application of smoothing windows or digital filters [4] that alters the frequency content of the source signal. Furthermore, the quality of interpolation can be enhanced by increasing its order [5], or the accuracy of the look-up table process can be increased by decreasing the spatial and temporal sampling periods of the 1-D grid [6].
Numerical solutions of various electromagnetic scattering prob- lems yield the simulation and excitation of a near-field source instead of a plane wave produced by a distant source. The problems encoun- tered due to the high-frequency components of the plane-wave source functions are also observed in the finite-source excitations. However, since no look-up table is used, oversampling the source function or in- creasing the order of interpolation is not applicable in the finite-source excitation. The applicable tools, namely, the smoothing windows and digital lowpass filters, are used to reduce the high-frequency contents of the input signals, and hence, to increase the accuracy of the FDTD signals in this paper.
at the source location. The term in (1) contains the desired current- source function divided by a factor of 03, which is the volume of the source cell. This scaling assures that the total current induced in the cell volume is equal to the desired value [8]. Thus, a constant current density of one Yee cube is used to simulate an infinitesimal dipole.
The discretized version of (1) is given by
The term in (2) is taken nonzero at a particular point (io, jo , ko ) and zero elsewhere, when an infinitesimal dipole is simulated.
3. SIGNAL-PROCESSING TOOLS
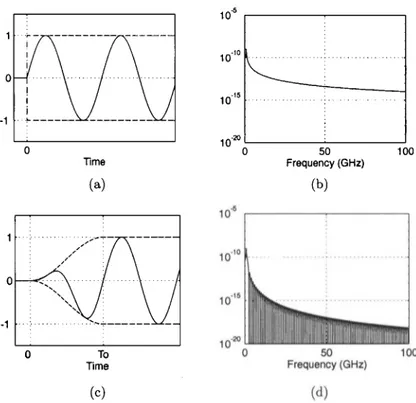
A time-limited analog signal (with finite support in time) is known to be not bandlimited in frequency. Thus, a causal signals, which is zero for t < 0, contains large high-frequency components, independent of the sampling rate. As an example, Fig. 1 (a) shows a causal sinusoid, i.e., a sinusoid multiplied by a step function, which contains an abrupt change at t = 0. The Fourier transform of this causal signal is not bandlimited, as shown in Fig. 1 (b) .
Smoothing windows are used to taper the discontinuities of the signals and to reduce the high-frequency components of the signal spectra. A triangular (Bartlett), Hanning (Hann), Hamming, or Blackman window [9, 10] can be used for this purpose. In this paper,
Figure 1. (a) Time-domain and (b) frequency-domain representations of a sinusoidal signal multiplied by a step function at t = 0. (c) Time- domain and (d) frequency-domain representations of a sinusoidal signal multiplied by a Hanning window with length L = To at t = 0.
the Hanning window, also known as the raised-cosine window, will be used whenever smoothing is applied to a signal.
The time- and frequency-domain representations of a sinusoidal signal with operating frequency fo - 1 GHz, which is multiplied by a step function at t = 0, are displayed in Figs. l(a) and (b), respectively. When the continuous-time signal in Fig. 1 (a) is multiplied by a Hanning window of length L by
Figure 2. Frequency response of the 32-point digital lowpa5s filter, with a cut-off of 10 GHz and a transition region of 3-10 GHz, designed by the remez algorithm [13]. (b) Frequency spectrum of the signal in Fig. l(a) after it is filtered by the digital lowpass filter with frequency response shown in (a).
and L is set as one period of the sinusoidal signal, i.e., To = 1/ fo, the high-frequency components due to the steep increase at t = 0 are suppressed. Figures 1(c) and (d) show the time- and frequency-domain representations of this windowed sinusoidal signal, respectively.
The goal of suppressing the high-frequency components of the digital signals can also be achieved by using a digital lowpass filter. A linear-phase finite-impulse-response (FIR) lowpass filter can be designed using the Parks-Mcclellan algorithm [11, 12], devised to minimize the weighted errors in the design process. This algorithm is also implemented as a MATLAB function called remez [13].
Figure 2(a) presents the frequency response of a 32-point digital filter with unity gain and 10-GHz cut-off. The application of such a filter on the digital signal yields the multiplication of the discrete Fourier transforms of the two signals [9]. The effect of this multiplication is demonstrated in Figs. l(b) and 2. Figure 1 (b) displays the Fourier transform of the 1 GHz sinusoid multiplied by a rectangular window. When this signal is passed through the filter with the frequency response of Fig. 2(a), the resultant signal, whose frequency- domain representation is given in Fig. 2(b), is obtained. Comparison of Figures 1 (b) and 2(b) suggests that the amplitudes of the frequency components above 10 GHz are decreased by a few orders.
The multiplication in the frequency domain corresponds to a convolution of the sequences in the time domain. The convolution
operation
also reads as
where ef[n] is the inverse FFT of the signal displayed in Fig. 2(b), e[n] is the sampled sinusoidal signal, whose frequency-domain representation is shown in Fig. l(b), and h[n] is the FIR filter with response displayed in Fig. 2(a).
4. NUMERICAL RESULTS OBTAINED IN A
HOMOGENEOUS GRID
In this section, the FDTD signals will be compared to the frequency- domain solution of an infinitesimal dipole in homogeneous space, which is analytically available. In order to be able to use this information, the time-dependence of the current source is transformed into the frequency domain via the FFT. This frequency-domain representation of the current source is multiplied by the analytical solution of the small dipole. The resultant spectrum signal is inverse transformed to the time domain to obtain a quasi-analytical solution at the observation point. In the following sections, this quasi-analytical method will be used to illustrate the errors on the FDTD signals.
4.1. Single-Frequency Dipoles
In [4], the errors induced by the high-frequency components of a causal sinusoidal signal were shown on the plane-wave excitation of the FDTD grid. The main source of error in the plane-wave excitation is the high- frequency content of the incident wave, which increases the transient and steady-state error levels due to the phase velocity mismatches between the 1-D source grid and the 3-D FDTD grid [7]. In the case of a finite near-zone source exciting the FDTD grid, there is no concern about any phase velocity mismatches, since there is only the 3-D grid that the waves propagate in. However, the phase velocities of different frequency component are still not the same, causing the deviation of the FDTD signals from their ideal counterparts.
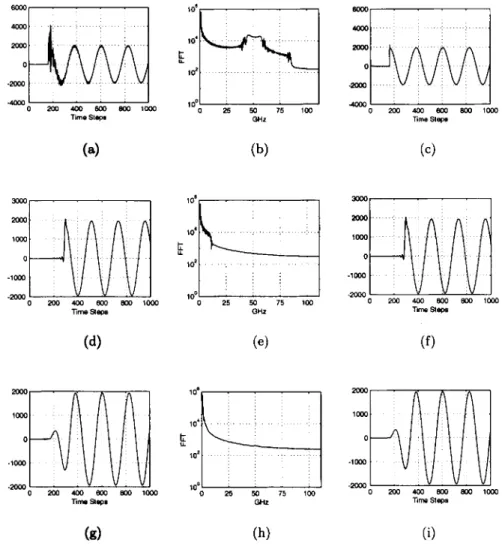
The infinitesimal dipole is first excited with a sinusoid multiplied by a step function, and the corresponding simulation result is displayed in Fig. 3(a). The z-polarized dipole is located at grid point (0, 0, 0) and
Figure 3. Simulation results of a small z-polarized dipole. The source function is a sinusoid with a frequency of 1 GHz. (a) FDTD signal at the observation point when the sinusoid is multiplied by a step function at t = 0. (b) FFT of the signal in (a). (c) Quasi- analytical solution. (d) Observed FDTD signal when the sinusoidal is passed through a lowpass filter with cutoff at 13 GHz. (e) FFT of the signal in (d). (f) Quasi- analytical solution. (g) Observed FDTD signal when the sinusoid is multiplied by a one-period-long Hanning window. (h) FFT of the signal in (g). (i) Quasi-analytical solution.
the observation point is at (50A, 50A, 50A), where A, the cell size, is set as 2.5 mm. The time step is 4.5 ps, which satisfies the Courant stability limit. The quasi-analytical solution of an infinitesimal dipole with the same source function, which is a sinusoid multiplied by a step function, is also computed and displayed in Fig. 3(c). Comparison of Fig. 3(a) to (c) reveals that the FDTD computation scheme cannot follow the abrupt change in the source function at t = 0, and the high- frequency oscillations due to this non-ideal feature are still present on the sinusoid after a number of periods of the incident pulse. These high-frequency components are visible in Fig. 3(b), the FFT of the signal in Fig. 3(a), around a band centered at 50 GHz.
Figures 3(d) and (f) display the FDTD and the quasi-analytical solutions of the source function, which is the sinusoidal signal passed through a 128-point digital lowpass filter with a cutoff at 13 GHz, respectively. The FDTD solution, displayed in Fig. 3(d), highly resembles the theoretical signal in Fig. 3(f), demonstrating the decrease in the FDTD error by the filtering process. Similar to the filtering process, multiplying the first period of the incident pulse by a smoothing window provides an FDTD signal identical to its theoretical counterpart, as demonstrated by Figs. 3(g) and (i). The suppression of the high-frequency components and the error by the digital filter and the smoothing window is further demonstrated by the FFT's of the FDTD signals, given in Figs. 3(e) and (h), respectively. These two frequency-domain plots illustrate the decrease in the energies of components around 50 GHz, which are dominant for the sinusoid multiplied by the step function, whose FFT is displayed in Fig. 3(b). 4.2. Dipoles Driven by Transient Pulses
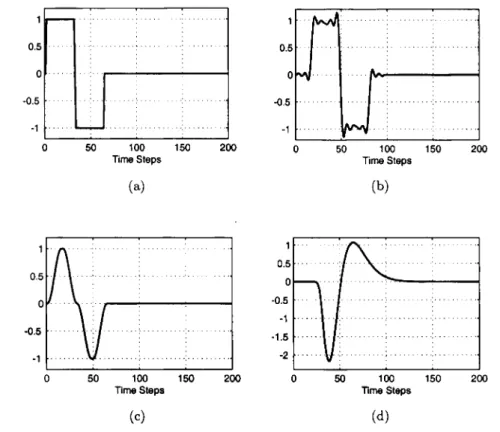
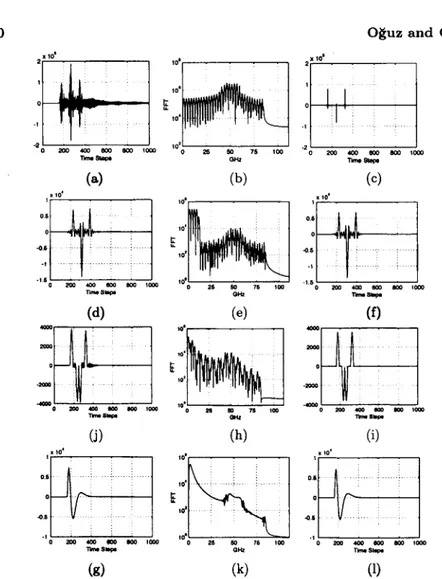
The infinitesimal dipole can be excited by transient source functions as well as single-frequency functions. Setting the cell size and the time step as 2.5 mm and 4.5 ps, respectively, and the locations of the transmitter and the receiver the same as in the previous section, the infinitesimal dipole is excited by the rectangular pulse in Fig. 4(a) and the oscillatory signal displayed in Fig. 5(a) is obtained at the observation point. The corresponding quasi-analytical solution is shown in Fig. 5(c) as a reference. As the signal in Fig. 5(a) and its FFT in Fig. 5(b) demonstrate, the high-frequency oscillations are dominant on the time-domain signal and the FDTD scheme cannot produce a signal that resembles the theoretical one at the observation point.
The digital lowpass filter mentioned in the previous section is applied on the rectangular pulse before it is fed into the source grid, and the resultant signal is displayed in Fig. 4(b). The FDTD observation, given in Fig. 5(d), and the quasi-analytical solution, displayed in
Figure 4. Time variation of (a) the rectangular pulse, (b) the filtered rectangular pulse, (c) the windowed rectangular pulse, and (d) the smooth pulse.
Fig. 5(f), match in this case. Application of 30-At-long smoothing windows on the sharp edges of the rectangular pulse produces an input signal that is shown in Fig. 4(c). The excitation of the dipole with this source signal yields an FDTD signal, displayed in Fig. 5(g), with high resemblance to the reference solution, shown in Fig. 5(i). Filtering or smoothing the source function suppresses the dominant high-frequency components of the FDTD signal, as demonstrated in Figs. 5(e) and (h), respectively.
In the above, the FDTD simulation results obtained by a rectangular pulse and other pulses derived therefrom are presented. The rectangular pulse contains large high-frequency components, which need extra effort to suppress. However, a smooth pulse contains high-frequency components with much less energies with respect to the
Figure 5. The simulation results and quasi-analytical solutions of a small z-polarized dipole located at point (0, 0, 0). Observation point is at (50A, 50A, 50A). The source function is a transient pulse with a center frequency of 1 GHz. (a) FDTD signal at the observation point when the source is a rectangular pulse with zero dc value. (b) FFT of the signal in (a). (c) Quasi-analytical solution. (d) FDTD signal at the observation point when the rectangular pulse is passed through a lowpass filter with cutoff at 13 GHz. (e) FFT of the signal in (d). (f) Quasi-analytical solution. (g) FDTD signal at the observation point when the sharp edges of the rectangular pulse are multiplied by 30At-long Hanning windows. (h) FFT of the signal in (g). (i) Quasi-analytical solution. (j) FDTD signal at the observation point when the source is a smooth pulse with 1 GHz center frequency. (k) FFT of the signal in (j). (1) Quasi-analytical solution.
In the previous section, all the simulations were performed in a homogeneous medium, which made it possible to compare the FDTD signals to the theoretical field values. When a scatterer is present in the computational domain, it may not always be possible to know the exact values of the total and scattered fields, depending on the shape of the object. Moreover, in a scattering problem, the errors due to the lack of accuracy in the modeling of the scatterer, which may be larger than the high-frequency dispersion errors, should also be taken into account.
Although the error cannot be exactly known for a heterogeneous computational domain, it is sometimes possible to comment on the quality of the scattered fields obtained by different source functions with different frequency contents. In this section, such a scattering problem will be investigated and the application of the SP techniques, summarized so far, on this scattering problem will be demonstrated.
A typical example to a scattering problem with a finite source exciting the FDTD grid is a ground-penetrating-radar (GPR) problem
[14-17]. The important feature of the GPR simulation is that, due to the stratified and heterogeneous structure of the ground, it is not possible to exactly know the outcoming signals. Therefore, it is impossible to compare the FDTD signals to the theory. However, due to the special characteristics of the GPR problem, not all kinds of source signals are appropriate for this certain application, and, therefore, it is still possible to demonstrate the effects of the SP techniques.
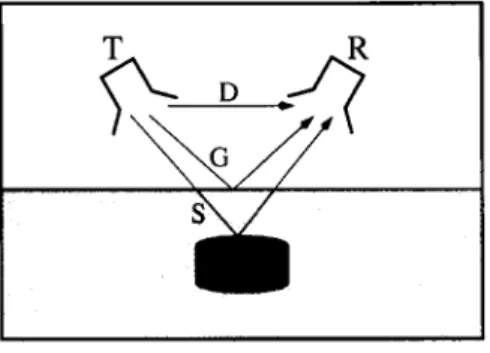
A typical GPR simulation, displayed in Fig. 6, has five basic elements: the ground and the air, the receiving and the transmitting antennas, and the scatterer embedded in the ground. The transmitter and the receiver are located at the same elevation above the ground-air interface [16, 17]. The transmitter (T) generates the fields penetrating the ground with a particular polarization and the receiver (R) collects
Figure 6. A typical GPR problem, involving air, ground, transmitter (T), receiver (R), and a scatterer buried in the ground. The receiver collects the sum of the direct (D), reflected (G), and scattered (S) signals.
and samples the fields with the same polarization. The total signal collected by the receiver is the sum of three individual signals: the direct signal (D) coupled from the transmitter to the receiver, the signal reflected from the ground (G), and the signal scattered by the buried target (S). The desired signal is the S signal, which contains information about the position and the characteristics of the buried target. When the transmitter-receiver pair is stationary and the receiver collects data at a point in space for successive instants of time, this is called an A-scan. A B-scan is obtained by performing repeated A-scan measurements at discrete points on a linear path.
The scattered signals are obtained with the subtraction of the results of an extra simulation involving a homogeneous ground in the absence of the target. The result of this extra simulation provides the sum of D and G signals. This D+G signal is subtracted from the D+G+S signal to extract the S signal. It may be possible to determine the location, depth, size, and material properties of the buried target by analyzing the S signal. However, the quality of these deductions depends on the character of the signal. For example, if the signal extends in time or contains high-frequency oscillations, it may not be possible to know the location and depth of the target.
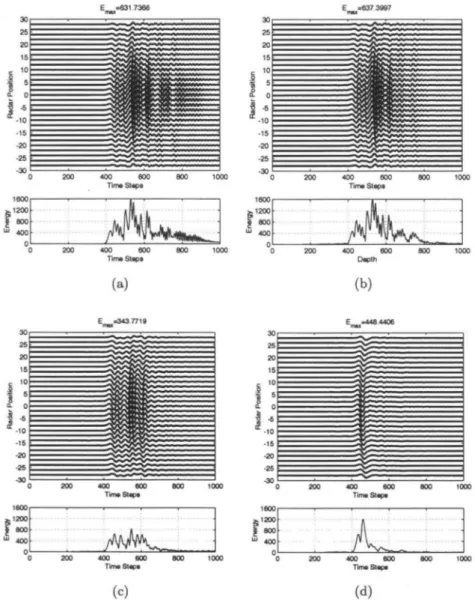
Figure 7 displays the simulation results of a 5 x 5 x 4 cm3 dielectric prism buried 5 cm under the ground-air interface. The transmitting and receiving antennas are separated by 11 cm. The antenna pair travels along a linear path above the target and receives data at every 5 mm on the path. The cell size and the time step are selected as 2.5 mm and 4.5 ps, respectively. Figure 7(a) displays the B-scan results of the dielectric prism when the source function is selected as a
Figure 7. The B-scan and energy results of a dielectric prism buried 5 cm under the ground. The source function is (a) a rectangular pulse with 1 GHz center frequency, (b) a lowpass-filtered rectangular pulse, (c) a rectangular pulse with smoothened edges, and (d) a smooth pulse with 1 GHz center frequency.
rectangular pulse with no DC component and 1 GHz center frequency, as in Fig. 4(a). As an alternative, this source function is filtered by an FIR lowpass filter, which has a 13 GHz cutoff, before it is fed into the source grid. The corresponding source signal and simulation results are shown in Figs. 4(b) and 7(b), respectively. Similarly, a smoothing window is applied on the edges of the rectangular pulse, as shown in Fig. 4(c), and the B-scan outputs are displayed in Fig. 7(c). The B-scan results in Fig. 7 are the scattered signals (S), i.e., the D and G signals, obtained by simulations employing homogeneous ground models, are subtracted from the original B-scan observations. All three results are normalized by the maximum S values observed in the corresponding B-scans, and displayed with respect to the radar position. The radar position denoted as zero is the point where the GPR is above the center of mass of the buried target. Energy values of the B-scan signals, obtained by compounding the values at a particular time step of each A-scan signal, are also computed and given below the corresponding B-scan result.
Figures 7(a)-(c) demonstrate that, with all three source functions, the scattered signals are visible when the GPR is close to the buried target. Thus, these B-scan results reveal that it is possible to detect a buried target even if the source function employed on the transmitting antenna contains high-frequency components. However, the B-scan results in Figs. 7(a)-(c) do not readily indicate the depth of the target, since the three energy plots do not exhibit clear peaks at a consistent time instant due to the high-frequency oscillations in time. Figure 7(d) displays the simulation results obtained by feeding a smooth pulse, which is shown in Fig. 4(d), as the source function in the transmitting antenna. Although Figs. 7(a)-(c) exhibit long and oscillatory scattered signals in time, Fig. 7(d), obtained with the smooth pulse, displays smooth and clear B-scan signals. Thus, the high-frequency oscillations in Figs. 7(a)-(c) are not present because of the problem geometry, but instead, they are due to the characteristics of the source function fed into the transmitting antenna. A smooth pulse with short duration and smaller high-frequency components produces shorter S signals in time, which results in an enhanced estimate for the depth of the buried target. The energy plot given below the B-scan image in Fig. 7(d) also exhibits a clear peak at approximately 470At (2.1 ns), which almost coincides with the time instant that the waves reflecting from the center of the body of the target reaches the receiving antenna. On the other hand, the rectangular, filtered rectangular, and windowed rectangular pulses produce scattered signals, whose energies are spread from 400At to about 700At, without a single clearly distinguishable peak that correctly points to the depth of the buried target.
of the FDTD signals are measured by comparing them to a quasi- analytical solution in the near zone. The application and the enhancing effects of the simple SP techniques on the excitation schemes are also demonstrated on a GPR problem. It is shown that the spectral content of the signal, which depends on the choice of the source function, directly influences the detectability of the buried target.
ACKNOWLEDGMENT
This work was supported by Bilkent University under research fund EE-01-01.
REFERENCES
1. Yee, K. S., "Numerical solution of initial boundary value problems involving Maxwell's equations in isotropic media," IEEE Trans. Antennas Propagat., Vol. AP-14, No. 4, 302-307, Apr. 1966. 2. Bérenger, J.-P., "A perfectly matched layer for the absorption of
electromagnetics waves," J. Comput. Phys., Vol. 114, No. 1, 185- 200, 1994.
3. Bérenger, J.-P., "Three-dimensional perfectly matched layer for the absorption of electromagnetic waves," J. Comput. Phys., Vol. 127, 363-379, 1996.
4. Gürel, L. and U. Oguz, "Signal-processing techniques to reduce the sinusoidal steady-state error in the FDTD method," IEEE Trans. Antennas Propagat., Vol. 48, No. 4, 585-593, Apr. 2000. 5. Oguz, U. and L. Gürel, "Interpolation techniques to improve the
accuracy of the incident-wave excitations in the FDTD method," Radio Science, Vol. 32, No. 6, 2189-2199, Nov.-Dec. 1997. 6. Oguz, U., L. Gürel, and O. Ankan, "An efficient and accurate
IEEE Trans. Microwave Theory Tech., Vol. 46, No. 6, 869-882, June 1998.
7. Taflove, A., Computational Electrodynamics: The Finite- Difference Time-Domain Method, Artech House, Boston, MA, 1995.
8. Buechler, D. N., D. H. Roper, C. H. Durney, and D. A. Chris- tensen, "Modeling sources in the FDTD formulation and their use in quantifying source and boundary condition errors," IEEE Trans. Microwave Theory Tech., Vol. 43, No. 4, 810-814, Apr. 1995.
9. Oppenheim, A. V. and R. W. Schafer, Discrete-Time Signal Processing, Prentice Hall, Englewood Cliffs, NJ, 1989.
10. Harris, F. J., "On the use of windows for harmonic analysis with the discrete Fourier transform," Proceedings IEEE, Vol. 66, No. 1, 51-83, Jan. 1978.
11. Rabiner, L. R., J. H. McClellan, and T. W. Parks, "FIR digital filter design techniques using weighted Chebyshev approximations," Proceedings IEEE, Vol. 63, 595-610, 1975. 12. Parks, T. W. and C. S. Burrus, Digital Filter Design, Wiley, 1987. 13. Little, J. N. and L. Shure, MATLAB Signal Processing Toolbox
User's Guide, Math-Works, Natick, Massachusetts, 1992.
14. Gürel, L. and U. Oguz, "Three-dimensional FDTD modeling of a ground-penetrating radar," IEEE Trans. Geoscience and Remote Sensing, Vol. 38, No. 4, 1513-1521, July 2000.
15. Gürel, L. and U. Oguz, "Simulations of ground-penetrating radars over lossy and heterogeneous grounds," IEEE Trans. Geosci. Remote Sensing, Vol. 39, No. 6, 1190-1197, June 2001.
16. Moghaddam, M., E. J. Yannakakis, W. C. Chew, and C. Randall, "Modeling of the subsurface interface radar," J. Electromagnetic
Waves and Applications, Vol. 5, No. 1, 17-39, 1991.
17. Bourgeois, J. M. and G. S. Smith, "A fully three-dimensional simulation of a ground-penetrating radar: FDTD theory compared with experiment," IEEE Trans. Geoscience and Remote Sensing, Vol. 34, No. 1, 36-44, Jan. 1996.
Ugur Oguz was born in Ankara, Turkey, in 1973. He received his B.Sc. and M.Sc. degrees, both in electrical engineering, from Bilkent University, Ankara, Turkey, in 1994 and 1997, respectively. From August 1997 to October 1998, he served in the Turkish Army, working as a database manager. Since November 1998, he has been
York, in 1991, where he worked as a Research Staff Member on the electromagnetic compatibility (EMC) problems related to electronic packaging, on the use of microwave processes in the manufacturing and testing of electronic circuits, and on the development of fast solvers for interconnect modeling. Since 1994, he has been a faculty member in the Department of Electrical and Electronics Engineering of the Bilkent University, Ankara. He was a Visiting Associate Professor at the Center for Computational Electromagnetics (CCEM) of the UIUC for one semester in 1997. Dr. Gfrel is currently serving as the Chairman of the AP/MTT/ED/EMC Chapter of the IEEE Turkey Section. Dr. Gürel's research interests include the development of fast algorithms for computational electromagnetics (CEM) and the application thereof to scattering and radiation problems involving large and complicated scatters, antennas and radars, frequency-selective surfaces and high-speed electronic circuits. He is also interested in the theoretical and computational aspects of electromagnetic compatibility and interference analyses. Ground-penetrating radars and other subsurface-scattering applications are also among his current research interests.
![Figure 2. Frequency response of the 32-point digital lowpa5s filter, with a cut-off of 10 GHz and a transition region of 3-10 GHz, designed by the remez algorithm [13]](https://thumb-eu.123doks.com/thumbv2/9libnet/5569163.108805/5.685.104.529.135.335/figure-frequency-response-digital-filter-transition-designed-algorithm.webp)
