H E PAT O L O G Y
Cloning and expression profile of FLT3 gene during
progenitor cell-dependent liver regeneration
Iraz T Aydin,* Zeynep Tokcaer,* Aydin Dalgic,†
Ozlen Konu* and Kamil C Akcali*
*Department of Molecular Biology and Genetics, Bilkent University, and†Department of Surgery, Gazi University Medical School, Ankara, Turkey
Abstract
Background and Aim: The liver has a unique capacity to regenerate upon exposure to viral infections, toxic reactions and cancer formation. Liver regeneration is a complex phenomenon in which several factors participate during its onset. Cellular proliferation is an important component of this process and the factors that regulate this proliferation have a vital role. FLT3, a well-known hematopoietic stem cell and hepatic lineage surface marker, is involved in proliferative events of hematopoietic stem cells. However, its con-tribution to liver regeneration is not known. Therefore, the aim of this study was to clone and examine the role of FLT3 during liver regeneration in rats.
Methods: Partial cDNA of rat homolog of FLT3 gene was cloned from thymus and the tissue specific expression of this gene at mRNA and protein levels was examined by RT-PCR and Western blot. After treating with 2-AAF and performing hepatectomy in rats to induce progenitor-dependent liver regeneration, the mRNA and protein expression profile of FLT3 was investigated by real-time PCR and Western blot during liver regenera-tion. In addition, cellular localization of FLT3 protein was determined by immunohis-tochemistry.
Results: The results indicated that rat FLT3 cDNA has high homology with mouse and human FLT3 cDNA. It was also found that FLT3 is expressed in most of the rat tissues and during liver regeneration. In addition, its intracellular localization is altered during the late stages of liver regeneration.
Conclusion: The FLT3 receptor is activated at the late stages of liver regeneration and participates in the proliferation response that is observed during progenitor-dependent liver regeneration.
Key words
cloning, FLT3, liver regeneration, rat. Accepted for publication 15 July 2006.
Correspondence
Dr Kamil C Akcali, Department of Molecular Biology and Genetics, Bilkent University, Bilkent, Ankara 06800, Turkey. Email: [email protected]
Introduction
The liver has a great capacity to regenerate after the loss of hepa-tocytes by toxic or viral injury or secondary to liver resection1,2 with a process known as liver regeneration, as illustrated by the ancient Greek legend of Prometheus. Liver regeneration is a complex physiological response, and a series of reactions must take place for survival of the organism. Oval cells have a central role in progenitor-dependent liver regeneration and they are acti-vated to proliferate when the replication and functional capacity of the mature hepatocytes is disrupted.3,4Oval cells are regarded as bipotential precursors for the two hepatic parenchymal cell lin-eages, hepatocytes and bile duct cells, and have lineage options similar to those displayed by hepatoblasts in early stages of liver development.5–8Several models in rodents have been established for triggering oval cell proliferation.9 In the model of 2-acetaminofluorene (2-AAF) treatment and partial hepatectomy (PH) operation (2-AAF/PH), the proliferating oval cells form irregular duct-like structures that are connected with preexisting
bile ducts.10The continuous administration of a low concentration of 2-AAF suppresses the proliferation of hepatocytes and at the middle point of the treatment the animals are subjected to a massive loss of hepatocytes by PH. When the hepatocytes do not respond to growth signals, there is rapid growth of the oval cells.11 Oval cells express specific proteins, one of which is thought to be FLT3.12–14FLT3 encodes an receptor tyrosine kinase (RTK) of 993 amino acids that belongs to the RTK subclass III family and is a well-known hematopoietic stem cell marker.15,16Unstimulated FLT3 receptors are in monomeric form in the plasma membrane. In this inactive state, the conformation of the receptor might result in steric inhibition of dimerization and exposure of phosphoryl acceptor sites in the tyrosine kinase domain (TKD) by the jux-tamembrane domain.16After stimulation with the ligand FLT3L, membrane-bound FLT3 quickly changes conformation, and forms a homodimer and exposes phosphoryl acceptor sites in TKD.17 Dimerization stabilizes this conformational change, which further enhances activation of the receptor.18The rate of FLT3 production, the speed of degradation of the activated FLT3L–FLT3 complex,
and the downstream effects of activation probably participate in a complex feedback loop that regulates normal receptor activity.16A recent study also suggests that FLT3 is a hepatic lineage surface marker.19Its existence in oval cells further supports its crucial role in hepatocyte development. However, the expression pattern of FLT3 has not been investigated during liver regeneration.
Previously, our research team has examined the involvement of the bcl-2 family of genes during liver regeneration,20as prolifera-tive and apoptotic mechanisms operate to provide a balance for the survival. In this study we focused on the other aspect of this complex process; proliferative response. We aimed to monitor the expression of FLT3 at both mRNA and protein levels, in progenitor cell-dependent liver regeneration. Other than the elucidation the role of FLT3 in the proliferative response, we also aimed to isolate and sequence the cDNA of rat FLT3 and monitor its tissue specific expression.
Methods
Cloning of rat FLT3
The cDNA sequences of mouse FLT3 (NM 010229), human FLT3 (NM 004119), and predicted rat FLT3 (XM 221874) were aligned using ClustalW tool (European Bioinformatics Institute; http:// www.ebi.ac.uk/clustalw/). We aimed to clone the full-length FLT3 cDNA in three overlapping fragments. The primers were designed for the regions conserved among three species. The locations and sequences of the cloning primers are shown in Fig. 1a and in Table 1, respectively. Total cDNA from rat thymus was used as template with the following PCR conditions: the initial denatur-ation step at 95°C, followed by 45 cycles of denaturdenatur-ation for 60 s at 94°C, annealing for 60 s at 55°C and extension for 60 s at 72°C. A final extension at 72°C for 10 min was applied to all the reac-tions. PCR products were electrophoresed and sequenced.
Animals
Male 9-week-old, 280–300 g Sprague–Dawley rats were used. They were housed under controlled environmental conditions
(22°C) with a 12-h light-dark cycle in the animal holding facility of the Department of Molecular Biology and Genetics at the Bilkent University. All the animals received care according to the criteria outlined in the ‘Guide for Care and Use of Laboratory Animals’ prepared by the National Academy of Science, and this study protocol complied with Bilkent University’s guidelines on humane care and use of laboratory animals. The animals were permitted unlimited access to food and water at all times. Experimental groups
A 2-AAF solution (125 mg/mL) was prepared in DMSO, then 50 mg/kg 2-AAF was administrated to each rat for 6 days. On the seventh day, liver surgery was performed after injecting ketamine (Ketalar, Pfizer, Istanbul, Turkey) subcutaneously at a dose of 30 mg/kg. In the partial hepatectomy (PH) group 70% of the liver mass was resected,21and in the sham hepatectomy (SH) group the same surgical procedures were carried out but the liver lobes were not resected. Operations were performed between 08:00 and 12:00 hours to minimize diurnal effects. After completion of the procedure, the animals were placed under a lamp to prevent hypo-thermia and then put into cages (one animal per cage) with con-tinuous supply of food and water.
Three randomly selected animals from the PH and SH groups were killed by cervical dislocation at 2 h, 12 h, 18 h, 24 h and 7 days after the operation. The remnant liver lobes were excised and washed in DMEM medium, then immediately frozen in liquid nitrogen.
Total RNA isolation and reverse transcription Total RNA was isolated from tissue samples using Tripure solution (Roche-Boehringer Mannheim, Germany) according to the manu-facturer’s protocol. The integrity of the isolated RNA samples was determined by denaturing- (formaldehyde-) agarose gel electro-phoresis. The cDNA samples were synthesized from the total RNA samples with the RevertAid First Strand cDNA Synthesis Kit (Fermentas, Burlington, ON, Canada) according to the manufac-turer’s protocol.
Real-time RT-PCR
The primers that were used for real-time RT-PCR are shown in Table 2. Before performing the real-time RT-PCR reactions for experimental samples, the amplification efficiencies of FLT3 and cyclophilin (CYC; internal control) primers were calculated using a standard dilution series. The initial denaturation step was at 95°C (a) (b) Part2 (–1300bp) F2 F3 F1 R1 R2 R3 3’ 5’ F1e Part 1 Part 2 1500bp 1200bp 800bp Part 3 Part1 (–1200bp) Part3 (–800bp) 1 2 3 4 5 6 7 8 9 10 11 12 13 14 15 16 17 18 19 20 21 22 23 24
Figure 1 (a) Exons of FLT3 and location of cloning primers. F1e-F1 and R1 primers (blue) were used for amplifying Part 1, F2 and R2 primers (red) were used for amplifying Part 2, and F3 and R3 primers (green) were used for amplifying Part 3. (b) Agarose gel electrophoresis of PCR products of Part 1, Part 2 and Part 3. All three fragments were amplified from thymus cDNA. 100 bp DNA Ladder Plus was used as the molecu-lar size marker.
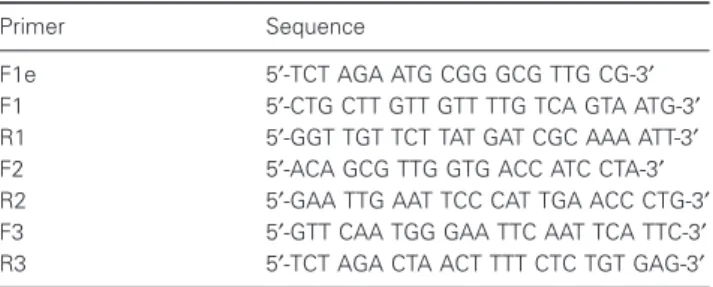
Table 1 Primers used for cloning of rat FLT3
Primer Sequence
F1e 5′-TCT AGA ATG CGG GCG TTG CG-3′
F1 5′-CTG CTT GTT GTT TTG TCA GTA ATG-3′
R1 5′-GGT TGT TCT TAT GAT CGC AAA ATT-3′
F2 5′-ACA GCG TTG GTG ACC ATC CTA-3′
R2 5′-GAA TTG AAT TCC CAT TGA ACC CTG-3′
F3 5′-GTT CAA TGG GAA TTC AAT TCA TTC-3′
for 10 min, followed by 50 (for FLT3) and 32 (for CYC) cycles of denaturation for 60 s for FLT3 and 30 s for CYC at 94°C, anneal-ing for 60 s at 60°C for FLT3 and 30 s at 55°C for CYC and extension for 60 s for FLT3 and 30 s for CYC at 72°C. A final extension at 72°C for 10 min was applied to all the reactions. The real-time PCR reactions followed by a melting curve analysis were carried out in iCycler (Bio-Rad, Hercules, CA, USA). The thresh-old cycle (Ct) values for FLT3 and CYC for each of the 2-AAF-treated SH and PH samples (normal liver, 0 h, 2 h, 12 h, 18 h, 24 h and 7 days) were obtained. Fold change in the expression of FLT3 was estimated based on the comparative Ct (2–DDCt) method22using the normal liver sample as calibrator.
Protein isolation and quantification
For protein isolation, 100 mg of tissue samples were homogenized in 1 mL of Camiolo Buffer and centrifuged at 12 000 g for 20 min at 4°C. In order to check the equal loading, 12mg of protein samples were run on 8% sodium dodecyl sulfate-polyacrylamide gel electrophoresis (SDS-PAGE). A 5mL PageRuler Prestained Protein Ladder (Fermentas) was used as protein molecular weight marker. After electrophoresis, the gel was stained with Coomassie staining solution for 5 min and then destained with Coomassie destaining solution overnight.
Western blotting
The proteins were separated on 8% SDS-PAGE and transferred to polyvinylidene fluoride membrane. The membrane was blocked with blocking solution for 1 h at room temperature. FLT3 antibody (Santa Cruz Biotechnology, Santa Cruz, CA, USA) was diluted to a concentration of 0.2mg/mL in blocking solution, and the mem-brane was incubated in antibody solution for 1 h at room tempera-ture. Then, the membrane was incubated in 1/5000 diluted antirabbit-horseradish peroxidase (HRP; Sigma, St Louis, MO, USA) secondary antibody solution for 1 h at room temperature. Finally, the membrane was incubated with ECL Plus Detection Reagent (Amersham Biosciences, Piscataway, NJ, USA) for 5 min and placed in a X-ray film cassette and developed.
Immunohistochemistry
Paraffin sections (5mm thick) were incubated for 30 min in 0.3% hydrogen peroxide in methanol to quench endogenous peroxidase activity. After washing three times with phosphate-buffered saline (PBS) for 10 min each, slides were incubated with preblocking serum (normal goat serum 1.5%, bovine serum albumin 2%, triton-X 0.1%) for 1 h at room temperature. Primary antibody of FLT3 (Santa Cruz Biotechnology) was applied at a concentration
of 5mg/mL in preblocking solution and kept at 4°C for overnight. After washing three times with PBS, tissue sections were incu-bated for 15 min each with biotinylated antimouse and antirabbit Ig and streptavidin-HRP (all Dako, Glostrup, Denmark) at room temperature. After washing 10 min with PBS, slides were rinsed in 0.5% Triton-X 100/PBS for 30 s. Color developments were achieved by incubation with Liquid DAB+ (Dako). The slides were then counterstained with hematoxylin and mounted using Faramount Aqueous Mounting Medium (Dako).
Results
Cloning of rat FLT3
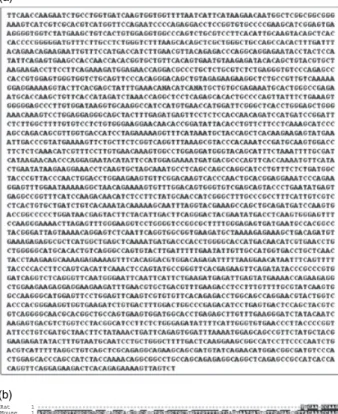
We aimed to clone rat homolog of FLT3 cDNA in three overlap-ping fragments (Part 1, Part 2, and Part 3) from thymus (Fig. 1a). However, cloning of part 1, the most 5′ fragment, could not be accomplished using F1e and R1 primer pair. Therefore, a second forward primer, F1 that recognizes a sequence located approxi-mately 35 base pairs downstream of the coding region was designed. All three fragments were amplified individually (Fig. 1b); sequencing of these fragments revealed a partial cDNA sequence for rat homolog of FLT3 gene (Fig. 2a). Alignment of this sequence with mouse FLT3 (NM010229) and human FLT3 (NM004119) by BCM Search Launcher: Multiple Sequence Alignments tool (Baylor College of Medicine) showed 90% homology with mouse and 81% homology with human sequences (Fig. 2b).
Tissue specific expression of rat FLT3
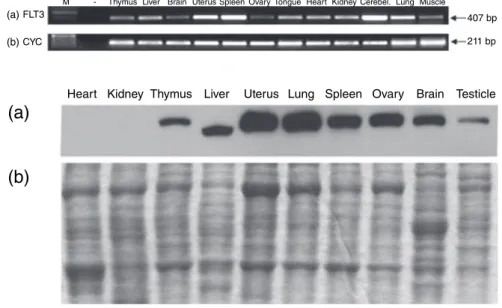
We analyzed the expression of FLT3 in different rat tissues at both the mRNA and the protein levels. Our results showed that FLT3 mRNA was expressed variably in the entire tissues examined (Fig. 3). In uterus, spleen, cerebellum and lungs, the expression of FLT3 was high, whereas in brain, ovary and skeletal muscle FLT3 level was found to be relatively low. In contrast to the presence of FLT3 mRNA in heart and kidney (Fig. 3), we did not detect any expression of FLT3 at the protein level in these tissues (Fig. 4a, first two lanes). Our Western blot experiments revealed the pres-ence of FLT3 protein in other tissues (Fig. 4a).
Expression of FLT3 mRNA during progenitor cell-dependent liver regeneration
The primer efficiencies of FLT3 and CYC were 1.95 and 1.90, respectively. As these values did not differ greatly from each other and approximated the expected value, the 2–DDCtformula was used in calculation of the fold differences among groups. Our real-time PCR results showed that FLT3 mRNA expression decreased at all time points in the PH groups compared to that of normal liver during progenitor cell-dependent liver regeneration (Fig. 5a). The expression of FLT3 also decreased in the SH groups when com-pared to normal liver although not to the extent observed in the PH groups, except at the 24 h after the operation. When we examined the expression in liver regeneration after 70% hepatectomy in rats without 2-AAF administration, we observed a similar pattern to the PH group, except at 2 h after PH (Fig. 5b). The difference between these two groups may reflect the effect of 2-AAF.
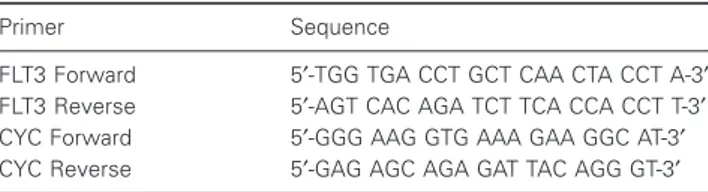
Table 2 Primers used for real-time RT-PCR
Primer Sequence
FLT3 Forward 5′-TGG TGA CCT GCT CAA CTA CCT A-3′
FLT3 Reverse 5′-AGT CAC AGA TCT TCA CCA CCT T-3′
CYC Forward 5′-GGG AAG GTG AAA GAA GGC AT-3′
(a) (b) (b) continued Rat Mouse Human 1 1 1 Rat Mouse Human 11 91 98 Rat Mouse Human 103 177 174 Rat Mouse Human 193 267 264 Rat Mouse Human 283 357 354 Rat Mouse Human 373 447 444 Rat Mouse Human 463 537 534 Rat Mouse Human 553 627 624 Rat Mouse Human 643 717 714 Rat Mouse Human 733 807 804 Rat Mouse Human 823 897 894 Rat Mouse Human 912 987 984 Rat Mouse Human 1002 1077 1074 Rat Mouse Human 1092 1167 1164 Rat Mouse Human 1182 1257 1254 Rat Mouse Human 1272 1347 1344 Rat Mouse Human 1362 1437 1434 Rat Mouse Human 1449 1527 1524 Rat Mouse Human 1455 1617 1614 Rat Mouse Human 1545 1707 1704 Rat Mouse Human 1635 1797 1794 Rat Mouse Human 1725 1887 1884 Rat Mouse Human 1815 1977 1974 Rat Mouse Human 1905 2067 2064 Rat Mouse Human 1995 2157 2154 Rat Mouse Human 2085 2247 2244 Rat Mouse Human 2175 2337 2334 Rat Mouse Human 2265 2427 2418 Rat Mouse Human 2355 2517 2508 Rat Mouse Human 2445 2607 2598 Rat Mouse Human 2535 2697 2688 Rat Mouse Human 2625 2787 2778 Rat Mouse Human 2715 2876 2868 Rat Mouse Human 2805 2940 4955
Figure 2 (a) Partial sequence of rat homolog of FLT3 cDNA. (b) Comparison of rat, mouse (NM 010229) and human (NM 004119) FLT3 cDNAs. The regions that are conserved in all three species are shown in black blocks.
Expression of FLT3 protein in progenitor cell-dependent liver regeneration
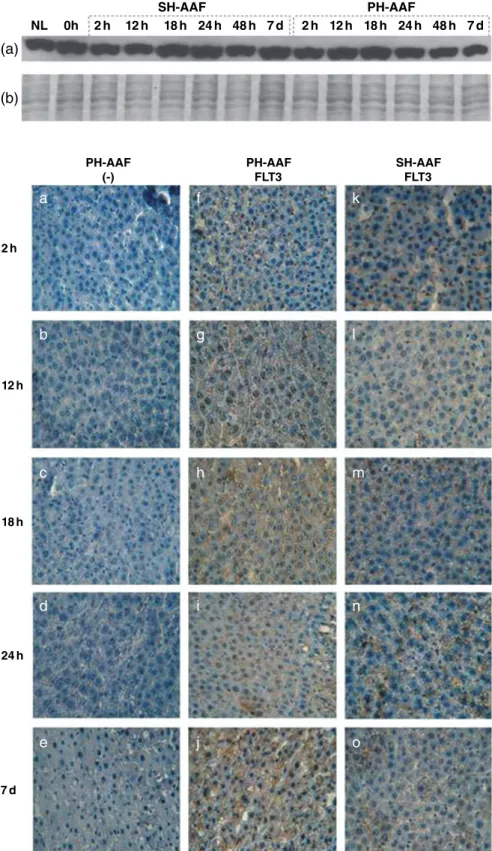
Our Western blotting data with anti-FLT3 antibody showed rela-tively constant levels of FLT3 protein during the early stages of liver regeneration compared to that of normal liver, but its level decreased starting from 18 h through to 7 days postoperatively (Fig. 6a). In contrast, there was an increase at 18 h and 24 h in the SH groups (Fig. 6a).
As we observed FLT3 protein in all samples, next we per-formed immunohistochemistry to examine the cellular location of
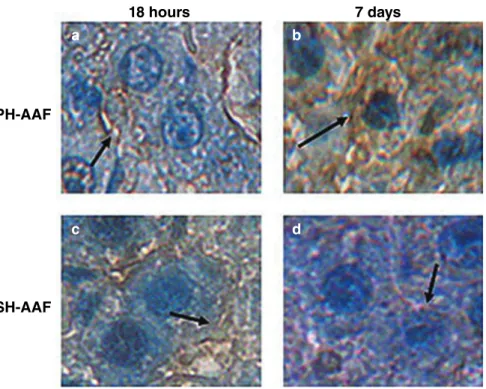
FLT3 protein in PH and SH groups (Fig. 7). In parallel with Western blot, FLT3 protein was detected in both PH (Fig. 7f–j) and SH groups (Fig. 7k–o) by immunohistochemistry. Interestingly, the cellular localization of FLT3 was different among our samples (Fig. 8). In the SH groups (Fig. 8c,d) and the early PH groups (Fig. 8a), FLT3 protein showed a membranous staining, but in the late PH groups the staining was mainly seen in the cytoplasm (Fig. 8b).
Discussion
From the work described in this article we were able to achieve the following: (i) cloning and characterization of rat FLT3 cDNA, which showed extremely high homology with mouse and to a lesser extent with human; (ii) possible explanation of the mecha-nism of FLT3 during progenitor-dependent liver regeneration.
Three different types of cells are believed to regenerate hepato-cytes: hepatocytes, oval cells and bone marrow derived stem cells.23Among these cell types, there has been debate on the role of bone marrow derived stem cells. These are multipotent cells and have a very long proliferation potential. However, they rarely constitute more than 1% of the total hepatocytes in humans,24and their role in rodents is still controversial, if any.25In contrast, the involvement of hepatocytes and oval cells during liver regenera-tion is well established.13If the liver damage is less severe, mature hepatocytes respond rapidly to liver injury.24Finally, oval cells are also the source of new hepatocytes, and these cells are activated when the liver damage is extensive and chronic, or if proliferation of hepatocytes is inhibited. Oval cell precursors located in the canal of Hering represent likely candidates for liver-repopulating stem cells, and can be considered a facultative liver stem cell.24,26,27
Oval cells express not only markers of the hepatocyte and bile duct lineage but also markers of hematopoietic stem cells such as FLT3.28,29As FLT3 is a subclass III RTK, it is logical to assign a role to FLT3 during liver regeneration. However, its expression pattern during liver regeneration is not known. Therefore, we (a)
(b)
FLT3
M - Thymus Liver Brain Uterus Spleen Ovary Tongue Heart Kidney Cerebel. Lung Muscle
CYC
407 bp 211 bp
Figure 3 Expression of (a) FLT3 and (b) CYC mRNA in rat tissues. M, 100 bp DNA Ladder Plus; (–), negative control.
(a)
Heart Kidney Thymus Liver Uterus Lung Spleen Ovary Brain Testicle
(b)
Figure 4 Expression of FLT3 protein in rat tissues by (a) Western blotting with anti-FLT3 antibody and (b) SDS-PAGE with Coomassie staining. (a) (b) 1,40 1,20 1,00 F o ld change in FL T3 e xpr ession F o ld change in FL T3 e xpr ession 0,80 0,60 0,40 0,20 0,00 2,00 1,80 1,60 1,40 1,20 1,00 0,80 0,60 0,40 0,20 0,00 NL NL 2h 12h 18h 24h 7d 0h 2h 12h Time Time 18h 24h 7d
Figure 5 Real-time PCR of FLT3 mRNA during progenitor-dependent liver regeneration in (a) 2-AAF-treated and (b) untreated rats after 70% partial hepatectomy (PH). Expression of FLT3 in regenerating (䊐) sham
hepatectomy (SH) and ( ) PH livers was measured at different time
aimed to investigate the expression profile of FLT3 during pro-genitor cell-dependent rat liver regeneration, which was triggered by 2-AAF-treatment in combination with PH. Our results showed that there was a reduction at the mRNA level of FLT3 after PH. In
both the PH and SH groups, the anesthetic used might have had an effect on the expression profile of liver cells. The reduction in the mRNA transcript level of FLT3 in the PH groups also may be related to the massive loss of cells. The observed pattern of FLT3
(a)
NL 0h 2h 12h 18h
SH-AAF PH-AAF
24h 48h 7d 2h 12h 18h 24h 48h 7d
(b)
Figure 6 Expression of proteins extracted from 2-AAF-treated sham hepatectomy (SH) and partial hepatectomy (PH) groups by (a) Western blotting with anti-FLT3 antibody and (b) SDS-PAGE with Coomassie staining.
a
b
c
d
e
k
l
m
n
o
f
g
h
i
j
PH-AAF (-) 2h 12h 18h 24h 7d PH-AAF FLT3 SH-AAF FLT3Figure 7 Immunohistochemistry of 2-AAF-treated sham hepatectomy (SH) and partial hepatectomy (PH) groups: (a–e) untreated (control) PH group, (f–j) PH group; and (k–o) SH group.
expression and lack of a tight correlation between the mRNA and protein levels of FLT3 suggests that an increase in FLT3 expres-sion may not always be a prominent feature of liver regeneration. In addition, the FLT3 protein level was almost equal in all groups. Our findings indicated that post-translational mechanisms, such as translocation of FLT3 between cellular compartments, might also play important roles. Therefore, we performed immunohis-tochemistry experiments in order to examine the localization of FLT3 protein in different experimental groups. Our results revealed that in all 2-AAF-treated SH groups and in early groups of 2-AAF-treated PH samples (2 h, 12 h and 18 h), FLT3 expres-sion was seen exclusively on the plasma membrane. Interestingly, in later AAF-treated PH groups, especially in the 7 days after PH group, there was strong cytoplasmic staining. The change in the cellular localization of the FLT3 during early and late stages of liver regeneration strongly suggests alterations in the activation status of the FLT3 receptor. Under normal conditions (normal liver and SH groups), FLT3 resides in the plasma membrane in an inactive monomeric form. However, when liver injury occurs and the liver undergoes a regeneration process, FLT3 is activated and internalized in order to relay signals for proliferative events. Acti-vation and internalization of receptors ultimately results in the degradation of receptors as shown previously.17 Therefore, the cytoplasmic staining of FLT3 protein in late 2-AAF-treated PH groups may reflect the presence of internalized FLT3 receptors. Western blotting results of the 24 h and 7 days PH groups in which FLT3 protein levels were relatively lower support this model of increased FLT3 receptor degradation.
Taking all our findings together, a likely scenario would be as follows: under normal conditions (normal liver and SH groups), FLT3 is expressed on the plasma membrane in its monomeric inactive form. The situation is also the same in the early PH
groups. However, in the late PH groups, in addition to other factors, FLT3 is activated and internalized in order to potentiate cellular proliferation.
Acknowledgments
This study was supported by Tubitak (TBAG-2284) and a Bilkent University Research Grant.
References
1 Sell S. Is there a liver stem cell? Cancer Res. 1990; 50: 3811–15. 2 Fausto N. Hepatology: A Textbook of Liver Disease, 2nd edn.
Philadelphia: Saunders, 1990; 49–64.
3 Alison M. Liver stem cells: a two compartment system. Curr. Opin. Cell Biol. 1998; 10: 710–15.
4 Factor VM, Radaeva SA, Thorgeirsson SS. Origin and fate of oval cells in dipin-induced hepatocarcinogenesis in the mouse. Am. J. Pathol. 1994; 145: 409–22.
5 Vessey cj, de la Hall PM. Hepatic stem cells: a review. Pathology 2001; 33: 130–41.
6 Kruglov EA, Jain D, Dranoff JA. Isolation of primary rat liver fibroblasts. J Investig. Med. 2002; 50: 179–84.
7 Sirica AE, Mathis GA, Sano N, Elmore LW. Isolation, culture, and transplantation of intrahepatic biliary epithelial cells and oval cells. Pathobiology 1990; 58: 44–64.
8 Sirica AE. Ductular hepatocytes. Histol. Histopathol. 1995; 10: 433–56.
9 Alison M, Golding M, Lalani el-N, Sarraf C. Wound healing in the liver with particular reference to stem cells. Philos. Trans. R. Soc. London B Biol. Sci. 1998; 353: 877–94.
10 Paku S, Schnur J, Nagy P, Thorgeirsson SS. Origin and structural evolution of the early proliferating oval cells in rat liver. Am. J. Pathol. 2001; 158: 1313–23.
a
b
c
d
18 hours
PH-AAF
SH-AAF
7 days
Figure 8 Cellular localization of FLT3 protein in (a,b) partial hepatectomy (PH) and (c,d) sham hepatectomy (SH) groups at 18 h and 7 days. The location of FLT3 protein is shown with black arrows.
11 Mitaka T. Hepatic stem cells: from bone marrow cells to hepatocytes. Biochem. Biophys. Res. Commun. 2001; 281: 1–5. 12 Matsusaka S, Tsujimura T, Toyosaka A et al. Role of c-kit receptor
tyrosine kinase in development of oval cells in the rat
2-acetylaminofluorene/partial hepatectomy model. Hepatology 1999;
29: 670–6.
13 Fausto N. Liver regeneration and repair: hepatocytes, progenitor cells, and stem cells. Hepatology 2004; 39: 1477–87.
14 Peterson BE. Hepatic ‘stem’ cells: coming full circle. Blood Cells Mol. Dis. 2001; 27: 590–600.
15 Agnes F, Shamoon B, Dina C, Rosnet O, Birnbaum D, Galibert F. Genomic structure of the downstream part of the human FLT3 gene: exon/intron structure conservation among genes encoding receptor tyrosine kinases (RTK) of subclass III. Gene 1994; 145: 283–8. 16 Stirewalt DL, Radich JP. The role of FLT3 in haematopoietic
malignancies. Nat. Rev. Cancer 2003; 3: 650–65.
17 Turner AM, Lin NL, Issarachai S, Lyman SD, Broudy VC. FLT3 receptor expression on the surface of normal and malignant human haematopoietic cells. Blood 1996; 88: 3383–90.
18 Weiss A, Schlessinger J. Switching signals on or off by receptor dimerization. Cell 1998; 94: 277–80.
19 Hong SH, Gang EJ, Jeong JA et al. In vitro differentiation of human umbilical cord blood-derived mesenchymal stem cells into hepatocyte-like cells. Biochem. Biophys. Res. Commun. 2005; 330: 1153–61.
20 Akcali KC, Dalgic A, Ucar A, Haj KB, Guvenc D. Expression of bcl-2 gene family during resection induced liver regeneration: comparison between hepatectomized and sham groups. World J Gastroenterol. 2004; 10: 279–83.
21 Wang X, Parsson H, Anderson R, Soltesz V, Johansson K, Bengmark S. Bacterial translocation, intestinal ultrastructure and cell membrane permeability early after major liver resection in the rat. Br. J. Surg. 1994; 81: 579–84.
22 Livak KJ, Schmittgen TD. Analysis of relative gene expression data using real-time quantitative PCR and the 2–DDCtmethod. Methods
2001; 25: 402–8.
23 Grompe M, Finegold MJ. Liver stem cells. In: Marshak DR, Gardner RL, Gottlieb D, eds. Stem Cell Biology. Cold Spring Harbor, NY: Cold Spring Harbor Laboratory Press, 2001; 455–97. 24 Fausto N, Riehle KJ. Mechanisms of liver regeneration and their
clinical implications. J. Hepatobiliary Pancreat. Surg. 2005; 12: 181–9.
25 Fujii H, Hirose T, Oe S et al. Contribution of bone marrow cells to liver regeneration after partial hepatectomy in mice. J. Hepatol. 2002; 36: 653–9.
26 Fausto N, Lemire JM, Shiojiri N. Cell lineages in hepatic development and the identification of progenitor cells in normal and injured liver. Proc. Soc. Exp. Biol. Med. 1993; 204: 237–41. 27 Theise ND, Saxena R, Portmann BC et al. The canals of
Hering and hepatic stem cells in humans. Hepatology 1999; 30: 1425–33.
28 Petersen BE, Grossbard B, Hatch H, Pi L, Deng J, Scott EW. Mouse A6-positive hepatic oval cells also express several hematopoietic stem cell markers. Hepatology 2003; 37: 632–40.
29 Zhang Y, Bai XF, Huang CX. Hepatic stem cells: existence and origin. World J. Gastroenterol. 2003; 9: 201–4.