1
Dynamic Impact of Trade Policy, Economic Growth, Fertility Rate, Renewable
and Non-Renewable Energy Consumption on Ecological Footprint in Europe
Andrew Adewale Alola
Department of Economics and Finance, Istanbul Gelisim University, Istanbul, Turkey. Email: [email protected]
Festus Victor Bekun
Department of Economics, Famagusta, Eastern Mediterranean University, North Cyprus, via Mersin 10, Turkey.
Email: [email protected] *Samuel Asumadu Sarkodie
Corresponding author: Nord University Business School (HHN). Post Box 1490, 8049 Bodø, Norway
2 Abstract
Climate change mitigation has become the central theme for many policy initiatives. The European Union (EU) member countries are working assiduously to achieve emission targets. As such, this study investigates the drivers essential to attaining the sustainable development goal in regards to reducing greenhouse gas emissions in EU member countries. A balanced panel of 16-EU countries from 1997-2014 was estimated with Panel Pool Mean Group Autoregressive distributive lag (PMG-ARDL) model. The study traces equilibrium relationship between the real gross domestic product, energy consumption (renewable and non-renewable consumption sources), trade openness, ecological footprint and fertility rate as suggested by both Kao and Pedroni cointegration tests. The PMG-ARDL analysis confirmed the role of non-renewable energy consumption in depleting environmental quality while renewable energy consumption was found to improve environmental sustainability. Interestingly, the unexpected fertility-ecological footprint long-run nexus is connected with the divergent fertility rate information of the EU member countries. Although the country-specific policy approach is essential, however, such a framework should be compatible with the region‘s overall Sustainable Development Goals (SDGs). The call for diversification of existing energy portfolios by either incorporating or enhancing renewable energy technologies is essential to sustain the current success strides of most member states. Thus, the EU should strengthen its commitments to achieving the emission targets by decarbonizing and sustaining its economic growth trajectory.
Keywords: Renewable consumption, conservative hypothesis, panel econometrics, economic growth
3 1. Introduction
The impact of the enormous pressure exerts through humans‘ exploitation of goods and services on the ecosystems is not unconnected with the recent concerns of environmental degradation, climate change, ecological distortions, and economic setbacks. In response, the global awareness and drive toward sustainable development amidst environmental safety (sustainability) has remained the pre-occupation of the environmentalist and economist across the globe. With the increasing human activities both directly and indirectly (Alola, 2019a, 2019b; Bekun, Alola & Sarkodie, 2019), more attention has been given to the environmental responses from the population dynamics, energy usage, economic growth, and several other notable factors (Akadiri .,2019a,Alola & Alola, 2018; Emir & Bekun, 2018; Sarkodie, 2018; Shahbaz & Sinha, 2019; Wang & Dong, 2019). In addition to utilizing carbon emissions (mostly using CO2) to account for environmental quality, ecological
accounting via the ecological footprint and biocapacity have been adopted to give broader perspectives. Given the importance of the Intergovernmental Panel on Climate Change (IPCC) report on ―climate change, desertification, land degradation, sustainable land management, food security, and greenhouse gas fluxes in terrestrial ecosystems‖ (IPCC, 2017), it definitely suggests a sustained effort toward reducing the pressure on the global ecological carrying capacity. In general, going by the economic expansions of the large economies like the United States, China, and some European countries, the aforesaid impacts remained a major concern of the governments, environmentalists, and policy makers of these countries.
In view of the European Union‘s (EU) drive toward attaining sustainable development and environmental quality, effective policies are being implemented by the union to guide member countries in meeting the Sustainable Development Goals (SDGs). For instance, the amended EU‘s
4
climate change target of 2030 includes the proposal to minimize greenhouse gas by at least 40% as compared with 1990, attaining a minimum 27% of total energy consumption from renewable energy, and attaining a 27% increase in energy efficiency (European Commission, 2019). However, since the introduction of the ecological accounting vis-a-vis the ecological footprint (EFP) by Wackernagel & Rees (1998), the EFP have consistently been used to examine environmental quality. Considering that the EFP measures the impact of human activities on the earth‘s available resources (Global Footprint Network, GFN 2019), examining the dynamics of EFP is poised to reveal further information. Information from the GFN hints on the serious concern of environmental quality in some of the EU countries since some member states are currently a deficit in ecological resources. Interestingly, although reportedly argued to vary across the member countries, there has been consistent evidence of a decline in the fertility rate most of the European countries (Rees, 2015; Coale, 2017). Thus, considering the trilemma of reducing the demand on the continent‘s EFP, averting the ageing population conundrum, and attaining sustainable development, it is yet empirically unclear if the trend of fertility decline remains desirable. In addition to the aforementioned reasons, the drive toward economic expansion, vast non-renewable have been mentioned among the determinants of environmental quality in the EU-member countries (Boyce, 1994; Soytas, Sari & Ewing, 2007; Shahbaz et al., 2017).
After Wackernagel & Rees (1998) hinted on the importance of reducing the impacts of human activities on the environment, several studies have further explored the scope of environmental perspectives within the context of ecological footprint (Gössling et al., 2002; Al-Mulali et al., 2015; Ozturk, Al-Al-Mulali & Saboori, 2016; Baabou, 2017; Destek & Sarkodie, 2019). Specifically, Al-Mulali et al (2015) and Destek & Sarkodie (2019) both validates the environmental Kuznets curve (EKC) hypothesis for 11 newly-developed countries and 93 selected countries respectively. The studies employed the ecological footprint in lieu of the conventional CO2 as a
5
proxy for environmental quality to examine the validity of the EKC hypothesis. While incorporating other factors like energy consumption and financial development, both studies inferred an inverted U-shaped relationship between GDP and the EFP. In the case of Al-Mulali et al (2015), the EKC hypothesis is observed to increase with the GDP growth. It implies that the low-income countries lack the energy-improved technologies, as such the observed countries experienced low GDP growth. Moreover, in a broader perspective, the EFP has been investigated alongside other economic-related factors like tourism, food, transportation, disposable income, infrastructure, and cultural habits (Gössling et al., 2002; Ozturk, Al-Mulali & Saboori, 2016; Baabou et al., 2017). For instance, Ozturk, Al-Mulali & Saboori (2016) found a negative relationship between the EFP and the GDP growth (GDP mainly from tourism), energy consumption, trade openness, and urbanization for 144 countries.
However, the indication from the above motivations propels the objective of investigating the dynamic impact of trade policy, renewable energy consumption, non-renewable energy, economic growth, and fertility on the EFP in sixteen (16) EU member countries. In advancing the study of Bekun, Alola & Sarkodie (2019), the current study also restricted the period of the dataset from 1996 to 2014 to 16 EU countries because of data availability. But the current study is set to present the following additional contribution to the body of knowledge. Foremost, the study considered the use of EFP against the regular CO2 because many EU countries are currently
struggling to cope with challenges related to the ecological deficit (Global Footprint Network, GFN 2019). In addition, the lingering challenge of low fertility in EU has provided the platform for incorporating fertility in the model, as such examining its impact on the EPT. Currently, most EU countries are confronted with the increase in the older population which is possibly caused by low fertility rate (Hoff, 2016), then investigating the implication of environmental quality should be informative.
6
The other part of the study is ordered as follows: Section 2 presents the material and empirical methodologies. While the empirical findings and discussion are reported in Section 3, the concluding remarks and policy implication of the study are provided in Section 4.
2. Materials and Methods
Energy has been identified, as an indispensable catalyst for the socio-economic activity and fabrics of any nations be it developing, transitions economies and even the developed economies. This is seen in the potential of energy sources to triggering wellbeing and comfort. However, there is a tradeoff for greenhouse gas (GHG) emission, which burns fossil fuel and transmits carbon dioxide emissions CO2 emissions has been identified as main contributor to GHG emissions globally. Thus,
this current study seeks to decouple environmental pollution from energy consumption-growth trajectory. Based on this highlight, this study focuses on the carbon-income function in a modified manner by disaggregation of energy consumption into (renewable and non-renewable sources) as well as the incorporation of the role of trade openness and fertility rate to the mix. The study measures the income level that is, real economic growth measured in (2010 constant USD$). The measure of environmental pollution (degradation) is the ecological footprint. This is a more boarder proxy for environmental pollution measured in a global hectare of farmland (in terms of forestry land, cropland, fishery, and grazing land) and carbon footprint. The ecological foot print also has CO2 in the composition of the dataset which makes it more encompassing and broader measure.
The ecological footprint is distinct measure for environmental quality that account for other natural areas that is needed to foster economic growth. Among such natural areas are information about the availability of water resources, forest reserve, and arable farm/grazing land and fresh air can be sourced through ecological footprint. Moreover, the availability of the aforementioned natural areas and their capacity to support life could depend on the eutrophication potential, terrestrial
7
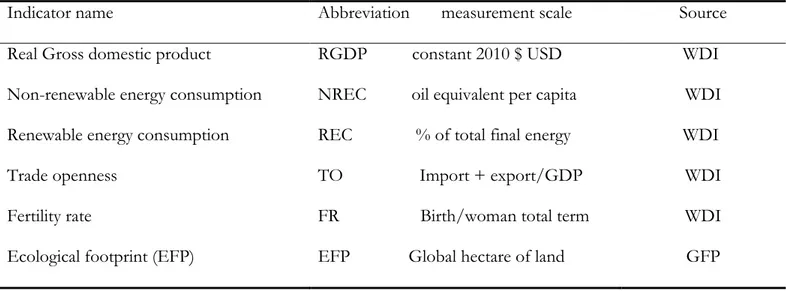
acidification and ecotoxicity of the ecosystem and the environment. It is on this premise, we adopt the use of ecological foot print as indicator for environment quality relative to previously used in the literature given it wide coverage This index offered a more enriching picture for environmental quality relative to the CO2 emissions used by previous studies which have been argued to be flawed. Non-renewable energy is made up of fossil fuels measured in a kilogram of oil equivalent in per capita while renewable energy constitutes the final total share of renewable energy consumption, expressed in percentage. Trade openness which is used to measure the impact of globalization across the investigated EU-countries is a measure of import and export as a share of GDP. The fertility rate is measured in terms of total birth accrue to a woman1. The data, unit of measurement and
sources are itemized in details in Table 1.
Table 1: Data description and measurement units
Source: Authors’ compilation
Note: WDI represents world development indicator (https://data.worldbank.org/) while GFP denotes global footprint network (https://www.footprintnetwork.org/)
1 See appendix section for list for countries investigated. The countries restriction is as results of data
availability and study scope.
Indicator name Abbreviation measurement scale Source Real Gross domestic product RGDP constant 2010 $ USD WDI Non-renewable energy consumption NREC oil equivalent per capita WDI Renewable energy consumption REC % of total final energy WDI
Trade openness TO Import + export/GDP WDI
Fertility rate FR Birth/woman total term WDI
8
The empirical route of this study is structured into five paths namely (i) test for common shock effect the cross-sectional dependency (CSD). This is necessary to circumvent the spurious assumption of cross-sectional dependency. (ii) Examination of stationarity properties of interest variables via the Fisher ADF unit root test and the Im, Pesaran and Shin (2003) unit root test (iii) Investigation of equilibrium relationship among the variables through the Pedroni cointegration test advanced by Pedroni (1999) in conjunction with Kao cointegration for robustness. (iv) Long regression is tested through the panel pooled mean group estimator by Pesaran et al. (1999) and finally (v) the directional flow is examined via the Dumitrescu and Hurlin (2012) causality test. Prior to the unit root investigations. The study examined the basic summary statistics was conducted to offer a glimpse of how the study data fare. Subsequently, Pearson correlation matrix analysis is examined to see the pairwise relationship among the variables under review.
2.1 Model Specification
The current study makes an improvement to the empirical literature on the nexus between the carbon-income dynamics, by disaggregation on energy consumption into (renewable and non-renewable energy consumption sources). In addition, the current study builds on the study of (Bekun et al.2019a; Balsalobre et al.,2018; Khoshnevis Yazdi & Shakouri, 2017) by incorporation of trade flow into the model construction and a more border environmental quality measure (ecological footprint). The functional model that capsulate this study is presented below:
( , , , , )
EFP f RGDP NREC REC TO FR (1)
, 1 , 2 , 3 , 4 , 5 , ,
i t i t i t i t i t i t i t
LnEFP LnRGDP LnNREC LnREC LnTO LnFR (2) According to Baltagi et al.(2005), Panel modelling entails the combination of both time series and cross-sectional dimension of data that renders more insightful meaning into the pool of data. The
9
current study uses panel procedure to explain how other explanatory variables like real economic growth, renewable energy consumption, non-renewable energy consumption, trade openness and fertility rate explains the quality of the environment as measure by ecological footprint in our study case. In an energy intense region, it would make theoretical and empirical sense to assume that will have a positive impact on the environment. This is in line with the popular tradeoff between economic growth and quality of environment. This is known in the energy literature as the environmental Kuznet Curve hypothesis (EKC). Also, we envisage same positive sign relationship for non-renewable energy consumption and fertility rate. On the other hand as our apriori expectation for renewable energy consumption and trade openness we expect an inverse relationship.
The logarithm-linear specification in Eq.2 is necessary to arrive at a homoscedastic model and also the double logarithms aids with ease in explanation of coefficients and estimates. In this study it makes the coefficients in elasticity form. Also, indicate the model constant term while the ' s
partial slope parameters (coefficients) to be estimated. i t, Represents the stochastic term that
captures all unobserved variables in the estimated model. The subscripts i and t represents the time dimensions in this case from 1997-2014 and cross-sectional dimensions of 16 EU countries respectively for the selected.
3. Results and Interpretation
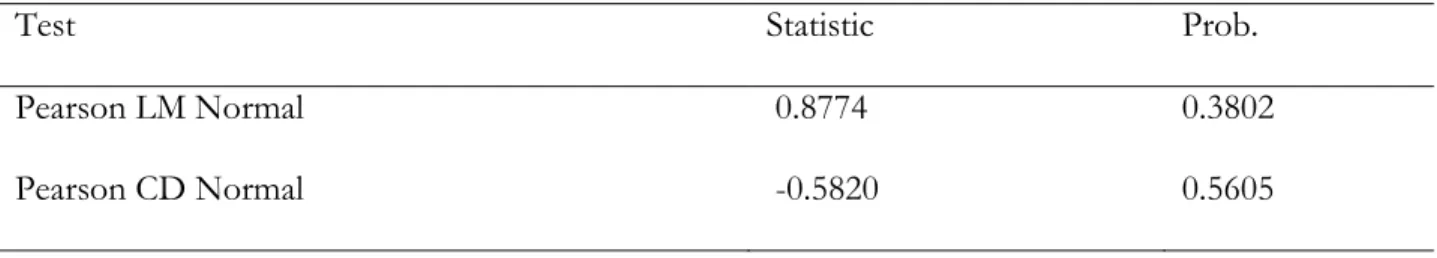
This section renders the results and discussions of all regression in the study. Table 2 presents the cross-sectional dependency test as reported by Pesaran (2004). This is necessary to ascertain the common shock phenomenon across the cross-sectional dimension of the data. The study shows a failure to reject the null of cross-independence. Thus, the study can proceed to first generational panel estimation techniques without running into the error of assuming cross-sectional dependency.
10
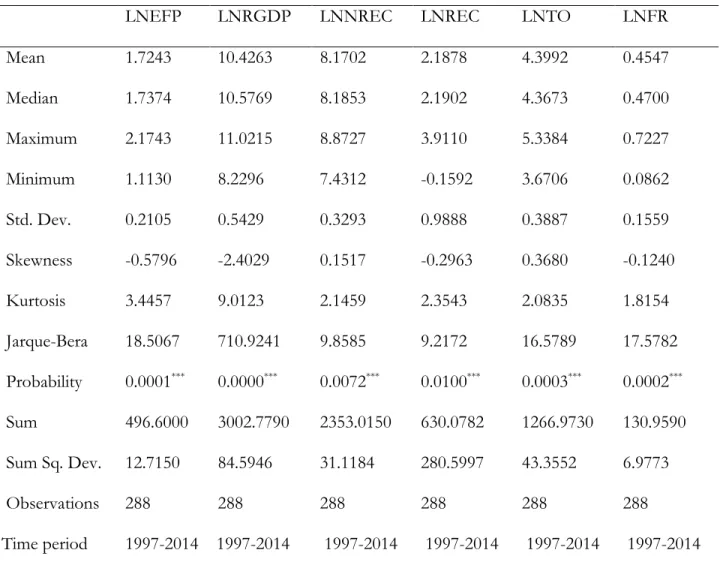
The next test conducted is the preliminary basic descriptive statistics for the indicators considered for the study. This is pertinent as it helps inform the study model and estimations choice. Table 3 of report the summary statistics that display the averages, maximum, minimum, standard deviations of the variables. In addition to the characterization of the summary statistics, it also reflects the peak as revealed by (Kurtosis), the distribution pattern by the normality test with the help of the Jarque-Bera probability. Table 3 which is computed from the dataset sourced from the World Bank development database. The simulations and reported number were obtained from E-Views 10 statistical software. Table 3 shows that ecological footprint, real gross domestic product, renewable consumption, non-renewable energy consumption, trade openness and fertility exhibits positives averages over the considered period. Also interesting, all the aforementioned variables shows considerable dispersion from their mean values. Real GDP has the highest mean values of $10, 4263 with a minimum of $8, 2296 and a maximum value of $11.0215 over the sampled period. Also, real GDP in terms of average followed by non-renewable energy consumption with a value of $8,1702 with fertility rate recording the lowest average among the variables. All the variables are negatively skewed with most of the observation on the left tail with the exception of non-renewable energy consumption, trade openness. This explains why all the variables are not normally distributed. The Jarque-Bera probability is rejected indicating the non-normal distribution of the variables under review.
Table 2: Cross sectional dependency results
Test Statistic Prob.
Pearson LM Normal 0.8774 0.3802
Pearson CD Normal -0.5820 0.5605
Note: null hypothesis: cross-sectional independence (CD (0,1)
11
LNEFP LNRGDP LNNREC LNREC LNTO LNFR
Mean 1.7243 10.4263 8.1702 2.1878 4.3992 0.4547 Median 1.7374 10.5769 8.1853 2.1902 4.3673 0.4700 Maximum 2.1743 11.0215 8.8727 3.9110 5.3384 0.7227 Minimum 1.1130 8.2296 7.4312 -0.1592 3.6706 0.0862 Std. Dev. 0.2105 0.5429 0.3293 0.9888 0.3887 0.1559 Skewness -0.5796 -2.4029 0.1517 -0.2963 0.3680 -0.1240 Kurtosis 3.4457 9.0123 2.1459 2.3543 2.0835 1.8154 Jarque-Bera 18.5067 710.9241 9.8585 9.2172 16.5789 17.5782 Probability 0.0001*** 0.0000*** 0.0072*** 0.0100*** 0.0003*** 0.0002*** Sum 496.6000 3002.7790 2353.0150 630.0782 1266.9730 130.9590 Sum Sq. Dev. 12.7150 84.5946 31.1184 280.5997 43.3552 6.9773 Observations 288 288 288 288 288 288 Time period 1997-2014 1997-2014 1997-2014 1997-2014 1997-2014 1997-2014
Source: Authors computation from pool of data for EU 16 countries investigated via E-Views 10 statistical software. Note the asterisk (***) represents a rejection of the null hypothesis of normality at 1% significance level.
Table 4: Pearson correlation matrix results
LNEFP LNGDP LNNREC LNREC LNTO LFR
LNEFP 1
t-Statistic ---
Prob.-value ---
12 t-Statistic 19.3412 --- Prob.-value 0.0000*** --- LNNREC 0.6803 0.5615 1 t-Statistic 15.6977 11.4779 --- Prob.-value 0.0000*** 0.0000*** --- LNREC -0.1062 0.0109 0.0796 1 t-Statistic -1.8060 0.1847 1.3521 --- Prob.-value 0.072* 0.854 0.1774 --- LNTO 0.1616 0.1026 0.1550 -0.1748 1 t-Statistic 2.7689 1.7446 2.6541 -3.0019 --- Prob.-value 0.006* 0.0821* 0.0084* 0.0029** --- LFR 0.4562 0.503 0.4972 -0.1150 0.4058 t-Statistic 8.6698 9.8423 9.6903 -1.9585 7.5078 1 Prob.-value 0.0000*** 0.0000*** 0.0000*** 0.0511* 0.0000*** ---
Source: Authors computation
Note the asterisk (***,** and *) represents a statistical rejection level of normality test statistics at 1 %, 5% and 10%
significance level.
Subsequently, the need to investigate the one-one relationship among the variables is worthwhile. Thus, the Pearson correlation analysis is used to explore the pairwise relationship among these variables. Table 4 shows a positive statistical significant relationship between economic growth and non-renewable energy consumption. This implies that consumption of fossil fuel energy sources will triggers higher income level for the region over the sample period. This is insightful, however, there are environmental implications as there is a tradeoff for environmental quality for higher income
13
level. That is nations become more environmental conscious on their growth trajectory especially at higher threshold level (Alola et al.2019c)In addition, there is an inverse statistical significant relationship between non-renewable energy consumption and environmental quality. This is a welcome and desirable stride by most if not all economies to minimize fossil fuel consumption that triggers increase carbon dioxide emissions. This also include the decoupling of GHG emission from energy consumption. Further estimation is required beyond the correlation analysis to either refute or validate these positions. Thus, more sophisticated econometrics tests are conducted in the course of this study.
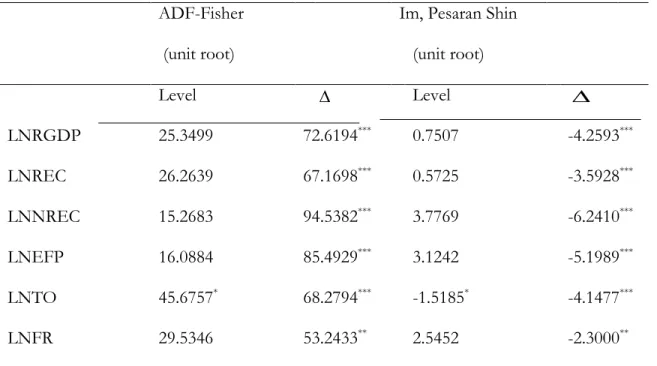
Table 5: Unit root results
ADF-Fisher
(unit root)
Im, Pesaran Shin (unit root) Level Level LNRGDP 25.3499 72.6194*** 0.7507 -4.2593*** LNREC 26.2639 67.1698*** 0.5725 -3.5928*** LNNREC 15.2683 94.5382*** 3.7769 -6.2410*** LNEFP 16.0884 85.4929*** 3.1242 -5.1989*** LNTO 45.6757* 68.2794*** -1.5185* -4.1477*** LNFR 29.5346 53.2433** 2.5452 -2.3000**
Note: the superscript (***. **,*) represents,1% ,5% and 10% statistical rejection level respectively. The symbol () means the first difference for the model with both intercept and trend at level.
The econometrics procedure generally encourages the test for stationarity properties among variables before proceeding to the modelling estimation. This is crucial in order to avoid variables
14
that are integrated of order 2 that is, ~I(2) and at large spurious analysis and policy directions. It is in this light that the current study conducted the panel unit root test for the bloc of countries investigated with the ADF Fisher and Im Pesaran shin tests in Table 5. The unit root test were conducted at both levels and first difference for both ADF and Im Pesaran Shin unit root test. At level form of the unit root test all variables under reviews were statistically insignificant at all conventional statistical significant levels with the exception of trade openness (TO) at 10% statistical significant level. However, we see a difference after first differencing on the variables al strong statistical level of 1% for all the variables considered. Thus, we made the affirmation that all the variables were integrated of mixed order at either levels or first difference. Thus, adequate modelling estimation techniques are applied accordingly. The most appropriate that support the outcome of the study unit root is the PMG-ARDL approach. Subsequently, the study proceeds to investigate the long-run equilibrium relationship to ascertain if there is convergence among the investigated variables. The Pedroni cointegration test advanced by Pedroni (1999) in conjunction with the Kao cointegration test is used to investigate the equilibrium relationship for the study in Table 6. Both co-integration tests of Kao and the Pedroni cointegration test are in harmony of cointegration relationship between ecological footprint, real gross domestic product, renewable consumption, non-renewable energy consumption, trade openness over 1997-2014 for 16 EU-countries with the rejection of the null hypothesis of no cointegration at 1% statistical significant level for both test. Table 6: Pedroni and Kao cointegration Results
Alternative hypothesis: common AR coefficients (within-dimension)
Statistic Prob. Statistic Prob.
Panel v-Statistic 0.051020 0.4797 -1.23802 0.8921
15
Panel PP-Statistic -11.0152 0.0000*** -6.9346 0.0000***
Panel ADF-Statistic -1.94519 0.0259** -3.21678 0.0006***
Alternative hypothesis: individual AR coefficient (between-dimension) Statistic Prob.
Group rho-Statistic 3.687971 0.9999
Group PP-Statistic -12.173 0.0000***
Group ADF-Statistic -3.12662 0.0009***
Kao cointegration test
t-Stat Prob.
ADF -2.2049** 0.0137
Residual variance 3.36E-03
HAC variance 0.001887
Source: Authors computation
Note the asterisk (***,** and *) represents a statistical rejection level of the null of no co-integration at 1 %, 5% and
10% significance level.
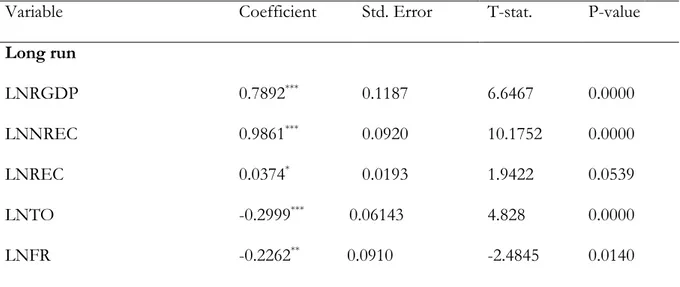
Table 7: Result of PMG-ARDL (2,1,1,1,1,1)
Model: LNEFP = f (LNRGDP, LNNREC, LNREN, LNTO, LNFR)
Variable Coefficient Std. Error T-stat. P-value
Long run LNRGDP 0.7892*** 0.1187 6.6467 0.0000 LNNREC 0.9861*** 0.0920 10.1752 0.0000 LNREC 0.0374* 0.0193 1.9422 0.0539 LNTO -0.2999*** 0.06143 4.828 0.0000 LNFR -0.2262** 0.0910 -2.4845 0.0140
16 Short run ECT(-1) -0.5940*** 0.1511 -3.9299 0.0001 LNRGDP 0.8121** 0.3140 2.5857 0.0106 LNREC -0.0855 0.0694 -1.2317 0.2199 LNNREC -0.1294 0.1279 -1.0122 0.3130 LNTO 0.0949 0.0679 1.3970 0.1644 LNFR 0.0067 0.2073 0.0321 0.9744 Constant -8.0217*** 2.0907 -3.8369 0.0002
Source: Authors computation
Note the asterisk (***,** and *) represents a statistical rejection level of the null hypothesis of no co-integration at 1 %,
5% and 10% significance level. Also, the fitted model is based on maximum lag 1 as suggested by Akaike information criterion with 256 observations.
After the establishment of the equilibrium relationship between the variables. The need to investigate the magnitude of cointegration in terms of coefficients is essential. Panel PMG-ARDL is used to explore the short-long dynamics between the dependent variable and its explanatory variables. In Table 7, the independents variable converge to their longrun path by a magnitude -0.5940, which is statistically significant at 1% level by the contribution of its explanatory variables(real economic growth, renewable energy consumption, non-renewable energy consumption, trade openness and fertility rate). The statistical significant error correction term (ECMt-1) affirms the equilibrium relationship among the variable. This indicates that deviation toward the equilibrium is correct by approximately 60% annually by the contribution of the explanatory variables. The long-run panel fitted model shows that real output (GDP) exerts a positive impact on environmental quality in both short and long run over the sampled period as
17
measured by ecological footprint. In essence, a 1% increase in the real GDP decreases the quality of the environment (increase in environmental degradation) by 0.81% and 0.79% in the short and long run respectively. This is in line with our earlier apriori expectation, suggesting an expected linear relationship between income and environmental pollution (Ulucak & Bilgili, 2018; Dogan, Taspinar & Gokmenoglu, 2019). Although the current study did not look at the situation when income is squared (the Environmental Kuznet‘s Curve, EKC hypothesis), we expect a decline in environmental deterioration (negative relationship) in such situation. The plausible explanation is that most of the EU-member countries are more environmentally conscious in their growth trajectory, however some of the member states are still dragging behind the attainment major sustainable energy targets. This is further explains the millstone achievements of most of the EU countries and the benefits of being signatories to the Kyoto Protocol and other country specific targets and energy commitments. It is also worthy of mention here that most of the member countries that are meeting their renewable energy target still have huge task in respect to those member countries that are yet to this attainment. For instance Romanian met her energy targets a decade before the actual stated dates see (Emir & Bekun, 2018).This means EU countries are on the path attaining her climate goals of more efficient consumption of renewable energy sources. This is further resonated in the study of (Akadiri et al.,2019b; Bekun & Agboola, 2019 Bekun et al. 2019b; Balcilar et al.2019) that renewables like wind energy, photovoltaic, biofuel are the pathway for cleaner environment As earlier stated in this study, energy consumption is disaggregated into non-renewable and renewable sources. The long-run estimate shows non-renewables energy consumption intensely depletes (with about 98% increase in degradation as fossil fuel consumption increases by 1%) the quality of the environment, which in turn increase global GHG emissions. Unexpectedly, the evidence in the current study indicates that the share in renewable energy (from the total energy consumption) in the bloc countries is not sufficient to improve the quality of the environment
18
especially in the long run. Precisely, as the share of the consumption of renewable energy increases, there is no corresponding increase in environmental quality in the entire panel countries, indicating that the failure of few or some is a failure of all. Also, considering that the current study employs the ecological footprint that account for larger content of the ecosystem against carbon emissions and CO2 commonly used in previous studies. This outcome is however not in line with the study of
Emire and Bekun (2018) for an individual case study of Romania. In the current study, a 1% increase in the share of renewable energy in total energy consumption increases environmental deterioration by approximately 0.04% in the long run (this significantly indicates a far lower damage to the environment as compare to 98% for non-renewable energy consumption). This means the EU countries are in conformation to energy targets like the Kyoto protocol and Paris agreements to decline global emission to 20C. However, a cautious effort is needed, as we observe that an inflow of
free trade (trade openness) and the increase in fertility rate in the long-run are responsible for decreasing environmental deterioration. Empirical evidence from this study negates the normal expectation of high fertility-ecological footprint nexus. This observation is likely to be unconnected with the United Nations Population Fund (UNPF, 2018) observation of non-uniformity in the trend of fertility rate across the EU countries. For instance, the UNPF noted that the Southern and Eastern European regions (such as Ukraine, Italy, Spain, Greece, Portugal, and Poland) are associated with low fertility rates while the North-Western European countries (like Denmark, France, Holland, Norway, United Kingdom or Sweden) have very low fertility rates. Conversely, the short-run estimate of the current study expectedly implies that fertility rate positively affects ecological footprint (0.0067), however, the impact is not statistically significant.
19
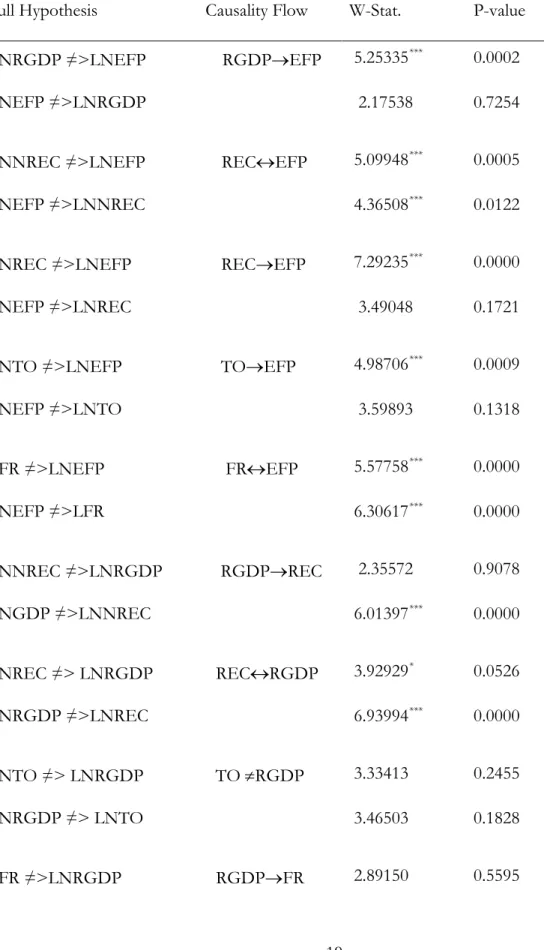
Table 8: Results of the Dumitrescu and Hurlin (2012) Panel causality Null Hypothesis Causality Flow W-Stat. P-value LNRGDP ≠>LNEFP RGDPEFP 5.25335*** 0.0002
LNEFP ≠>LNRGDP 2.17538 0.7254
LNNREC ≠>LNEFP RECEFP 5.09948*** 0.0005
LNEFP ≠>LNNREC 4.36508*** 0.0122
LNREC ≠>LNEFP RECEFP 7.29235*** 0.0000
LNEFP ≠>LNREC 3.49048 0.1721
LNTO ≠>LNEFP TOEFP 4.98706*** 0.0009
LNEFP ≠>LNTO 3.59893 0.1318 LFR ≠>LNEFP FREFP 5.57758*** 0.0000 LNEFP ≠>LFR 6.30617*** 0.0000 LNNREC ≠>LNRGDP RGDPREC 2.35572 0.9078 LNGDP ≠>LNNREC 6.01397*** 0.0000 LNREC ≠> LNRGDP RECRGDP 3.92929* 0.0526 LNRGDP ≠>LNREC 6.93994*** 0.0000 LNTO ≠> LNRGDP TO RGDP 3.33413 0.2455 LNRGDP ≠> LNTO 3.46503 0.1828 LFR ≠>LNRGDP RGDPFR 2.89150 0.5595
20
LNRGDP ≠>LFR 7.11539*** 0.0000
LNREC ≠> LNNREC RECNREC 10.7237*** 0.0000
LNNREC ≠>LNREC 6.08126*** 0.0000
LNTO ≠> LNNREC TO REC 4.71665*** 0.0030
LNNREC ≠> LNTO 3.66059 0.1124
LFR ≠> LNNREC FRNREC 4.78195*** 0.0023
LNNREC ≠> LFR 5.82716*** 0.0000
LNTO ≠>LNREC REC TO 3.32857 0.2485
LNREC ≠> LNTO 6.58293*** 0.0000
LFR ≠>LNREC FRREC 7.12778*** 0.0000
LNREC ≠> LFR 5.49205*** 0.0000
LFR ≠>LNTO FR TO 4.53087*** 0.0065
LNTO ≠> LFR 2.48278 0.9601
Source: Authors computation
Here: the superscripts (***, ** and *) means statistical rejection level. While ≠> indicate does not reject. represents one-way causality flow. denotes bi-directional causality flow and means neutrality(no causality flow in either direction)
21
The need to explore the direction of causality is necessary for studies of this sort. Table 8 renders the Dumitrescu and Hurlin (2012) Panel causality test. We observe that real income drives environmental quality in one-way for the region investigated. This is insightful as policymakers and environmentalist are to pay attention to the adverse effect of uncontrolled growth on the quality of the environment. Interestingly, for EU member countries which have had substantial strides in their energy and environmental goals (Sarkodie & Strezov, 2018). The study also observe significant evidence of Granger causality for renewable energy and trade openness with environmental quality. Feedback causality is observed running from renewable energy consumption and real GDP. This further strengthens the current position of examined panel of EU-member countries that there is clear hindrance to decoupling from fossil fuel sources of energy consumption in her energy mix. In addition, a statistically significant Granger causality with feedback is observed between fertility rate and ecological footprint. Expectedly, this implies that the historical information of each of the factor will statistically predict future characteristics of the other. This empirical evidence corroborates the statistical significance of both the dynamic relationship between fertility rate and ecological footprint and their corresponding correlation presented in Table 4.
4. Conclusion
Energy consumption has been identified as a key driver of the socio-economic activities across the globe. However, the vital role of energy consumption comes with its cost implications on environmental quality. This has been the bane of most economies to reduce the adverse impact of increased energy consumption on environmental pollution and degradation. Against the backdrop, the study focused on the path to see the blue skies of European countries again rather than the polluted atmosphere. Sixteen EU member countries based of data availability were selected with an
22
annual balanced data framework from 1997-2014. The PMG-ARDL estimation technique employed produced robust results to ensure insightful policy direction.
The current study traces the equilibrium relationship over the sampled period as suggested by Pedroni and Kao cointegration estimators. Subsequently, the long run regression validates the vital role of renewable energy consumption in improving environmental and health quality — as less atmospheric emissions enhance the air quality. However, there is a need to improve and strengthen environmental policies in the blocs investigated given that some member countries are yet to match-up to the Paris treaty for a decrease in world global emissions level. Moreover, the current study importantly observes that a bluish sky for one member country is unlikely to translate to bluish skies for all member countries. Hence, the target should be a bluish skies for all member countries without any isolated case, thus suggesting a joint approach toward attaining the sustainable development goals 2030. In doing so, the following pragmatic policy recommendations emanate from the study:
(i) More efficient and cleaner energy use of energy (by increasing the share of the renewable energy in the total energy consumption) is the central pre-requisite for successful clean energy transition from fossil fuel consumption and also to the decoupling of carbon emissions without harm on real output level. Importantly, this approach is needed to accomplish a greener economy in lieu of the negative impact of the economic growth. (ii) In order to meet the renewable energy target, renewable energy consumption alone is
not sufficient. There is a need for mix with other cleaner energy technologies blend to see a minimization of GHG emissions and attainment of the climate goal targets.
(iii) Although the UNPFA (2017) attributed the decline in fertility rate especially of the developed countries as the by-product of sustainable development, the organization, however, cautioned that the age structure of the populations is primarily hampered.
23
Since ageing and low fertility are the prevalent issues of the EU member countries, an adequate study should be devoted at underpinning and closing the gap between the very low fertility and the fertility near replacement countries (Billari, 2018).
(iv) Subsequently, effective policy that targets more structural changes like the women‘s participation in the labour market, social norms, and fertility behaviour is worthy of implementation across the region.
(v) Importantly, the member countries should reconcile their individual state interests with larger interest especially of the EU in order not to jeopardize the courageous effort of the member states that are ahead in attaining the SDGs 2030 and other regional policy drives.
However, this study could be extended in the future by incorporating further demographic components that include household and gender classifications in the experimental model. In addition, future research could weight in from the perspective of forecasting the EFP and biocapacity comparatively in order to further provide on the environmental sustainability of the EU member countries.
References
Akadiri, A. C., Saint Akadiri, S., & Gungor, H. (2019). The role of natural gas consumption in Saudi Arabia's output and its implication for trade and environmental quality. Energy Policy, 129, 230-238.
Al-Mulali, U., Weng-Wai, C., Sheau-Ting, L., & Mohammed, A. H. (2015). Investigating the environmental Kuznets curve (EKC) hypothesis by utilizing the ecological footprint as an indicator of environmental degradation. Ecological Indicators, 48, 315-323.
Alola, A. A. (2019a). The trilemma of trade, monetary and immigration policies in the United States: Accounting for environmental sustainability. Science of The Total Environment, 658, 260-267.
24
Alola, A. A. (2019b). Carbon emissions and the trilemma of trade policy, migration policy and health care in the US. Carbon Management, 1-10.
Alola, A. A., Yalçiner, K., Alola, U. V., & Saint Akadiri, S. (2019c). The role of renewable energy, immigration and real income in environmental sustainability target. Evidence from Europe largest states. Science of The Total Environment.
Alola, A. A., & Alola, U. V. (2018). Agricultural land usage and tourism impact on renewable energy consumption among Coastline Mediterranean Countries. Energy & Environment, 29(8), 1438-1454.
Balsalobre-Lorente, D., Shahbaz, M., Roubaud, D., & Farhani, S. (2018). How economic growth, renewable electricity and natural resources contribute to CO2 emissions? Energy Policy, 113, 356-367.
Baltagi, B. H., E. Bratberg and T. H. Holmås (2005) ‗A Panel Data Study of Physicians‘ Labor Supply: The Case of Norway‘, Health Economics, 14: 1035–45.
Baabou, W., Grunewald, N., Ouellet-Plamondon, C., Gressot, M., & Galli, A. (2017). The Ecological Footprint of Mediterranean cities: Awareness creation and policy implications. Environmental
Science & Policy, 69, 94-104.
Balcilar, M.,Bekun, F.V. & Uzuner, G. (2019). Revisiting the Economic Growth and Electricity Consumption Nexus in Pakistan. Environmental science and pollution research 1-13,
https://link.springer.com/article/10.1007/s11356-019-04598-0 (in press)
Bekun, F. V., & Agboola, M. O. (2019). Electricity Consumption and Economic Growth Nexus: Evidence from Maki Cointegration. Engineering Economics, 30(1), 14-23.
25
Bekun, F. V., Alola, A. A., & Sarkodie, S. A. (2019a). Toward a sustainable environment: Nexus between CO2 emissions, resource rent, renewable and nonrenewable energy in 16-EU countries. Science of The Total Environment, 657, 1023-1029.
Bekun, F. V., Emir, F., & Sarkodie, S. A. (2019b). Another look at the relationship between energy consumption, carbon dioxide emissions, and economic growth in South Africa. Science of The
Total Environment, 655, 759-765.
Billari, F. C. (2018). A ―great divergence‖ in fertility? In Low fertility regimes and demographic and societal
change (pp. 15-35). Springer, Cham.
Boyce, J. K. (1994). Inequality as a cause of environmental degradation. Ecological Economics, 11(3), 169-178.
Coale, A. J. (2017). The decline of fertility in Europe. Princeton University Press.
Destek, M. A., & Sarkodie, S. A. (2019). Investigation of environmental Kuznets curve for ecological footprint: the role of energy and financial development. Science of the Total Environment, 650, 2483-2489.
Dogan, E., Taspinar, N., & Gokmenoglu, K. K. (2019). Determinants of ecological footprint in MINT countries. Energy & Environment, 0958305X19834279.
Dumitrescu, E. I., Hurlin, C. (2012). Testing for Granger non-causality in heterogeneous panels. Economic Modelling, 29(4): 1450-1460. doi.org/10.1016/j.econmod.2012.02.014 Emir, F., & Bekun, F. V. (2018). Energy intensity, carbon emissions, renewable energy, and
economic growth nexus: New insights from Romania. Energy & Environment, 0958305X18793108.
European Commission (2019). https://ec.europa.eu/clima/citizens/eu_en. (Accessed 22nd February,
26
Global Footprint Network (2019). https://www.footprintnetwork.org/our-work/ecological-footprint/. (Access date 05/01/2019)
Gössling, S., Hansson, C. B., Hörstmeier, O., & Saggel, S. (2002). Ecological footprint analysis as a tool to assess tourism sustainability. Ecological economics, 43(2-3), 199-211.
Hoff, A. (2016). Introduction: the drivers of population ageing in Central and Eastern Europe– fertility, mortality and migration. In Population Ageing in Central and Eastern Europe(pp. 31-38). Routledge.
Im, K. S., M. H. Pesaran and Y. Shin (2003) ‗Testing for Unit Roots in Heterogeneous Panels‘, Journal of Econometrics, 115: 53–74. doi.org/10.1016/S0304-4076(03)00092-7 Intergovernmental Panel on Climate Change (IPCC, 2017). https://www.ipcc.ch/. (Access date
07/01/2019)
Khoshnevis Yazdi, S., & Shakouri, B. (2017). Renewable energy, nonrenewable energy consumption, and economic growth. Energy Sources, Part B: Economics, Planning, and Policy, 12(12): 1038-1045. doi.org/10.1080/15567249.2017.1316795
Ozturk, I., Al-Mulali, U., & Saboori, B. (2016). Investigating the environmental Kuznets curve hypothesis: the role of tourism and ecological footprint. Environmental Science and Pollution
Research, 23(2), 1916-1928.
Pedroni, P. (1999). Critical values for cointegration tests in heterogeneous panels with multiple regressors. Oxford Bulletin of Economics and statistics, 61(s 1), 653-670.
Rees, P. (2015). Population change in Europe, the Middle-East and North Africa: Beyond the demographic divide. Ashgate Publishing, Ltd.
Pesaran, M. H. (2004). General diagnostic tests for cross section dependence in panels. CESifo Working Paper Series No. 1229; IZA Discussion Paper No. 1240.
27
Pesaran, M. H., Shin, Y., & Smith, R. P. (1999). Pooled mean group estimation of dynamic heterogeneous panels. Journal of the American Statistical Association, 94(446), 621-634. doi.org/10.1080/01621459.1999.10474156.
Saint Akadiri, S., Alkawfi, M. M., Uğural, S., & Akadiri, A. C. (2019). Towards achieving
environmental sustainability target in Italy. The role of energy, real income and globalization.
Science of The Total Environment.
Sarkodie, S. A. (2018). The invisible hand and EKC hypothesis: what are the drivers of environmental degradation and pollution in Africa? Environmental Science and Pollution
Research, 25(22), 21993-22022.
Sarkodie, S. A., & Strezov, V. (2018). Empirical study of the Environmental Kuznets curve and Environmental Sustainability curve hypothesis for Australia, China, Ghana and USA. Journal of Cleaner Production, 201, 98-110.
Shahbaz, M., & Sinha, A. (2019). Environmental Kuznets curve for CO2 emissions: a literature survey. Journal of Economic Studies, 46(1), 106-168.
Shahbaz, M., Solarin, S. A., Hammoudeh, S., & Shahzad, S. J. H. (2017). Bounds testing approach to analyzing the environment Kuznets curve hypothesis with structural beaks: The role of biomass energy consumption in the United States. Energy Economics, 68, 548-565.
Ulucak, R., & Bilgili, F. (2018). A reinvestigation of EKC model by ecological footprint measurement for high, middle and low income countries. Journal of cleaner production, 188, 144-157.
United Nations Population Fund (2018). https://www.unfpa.org/world-population-trends. Accessed 8th March 2019.
Wackernagel, M., & Rees, W. (1998). Our ecological footprint: reducing human impact on the earth (Vol. 9). New Society Publishers.
28
Wang, J., & Dong, K. (2019). What drives environmental degradation? Evidence from 14 Sub-Saharan African countries. Science of the Total Environment, 656, 165-173.
Appendix
List of investigated European countries studied for this study
Austria Greece Belgium Ireland Bulgaria Italy Denmark Netherland Finland Portugal France Spain Germany Sweden
Cyprus United Kingdom