125
Beykoz Akademi Dergisi, 2018; 6(2), 125-141 MAKALE
Gönderim tarihi: 22.10.2018 Kabul tarihi: 26.10.2018 DOI: 10.14514/BYK.m.26515393.2018.6/2.125-141
CONSUMER IMPULSIVE BUYING TENDENCY SCALE DEVELOPMENT USING MIXED
METHODOLOGY
Ezgi MERDİN UYGUR
1Abstract
In the domains of marketing and consumer behavior, there has been a paradigmatic shift from fully rational and mechanical human beings towards the dominance of feelings, irrationalities and impulses. Hence, there has been a growing demand for measurement tools capturing the multidimensional nature of buying processes. This study is an attempt to generate a reliable and valid scale to measure the impulsive buying tendency of customers. Impulse buying is of great importance with the technological developments and ease of purchasing. In this paper, the aim is to provide a comprehensive, valid and reliable impulse purchasing scale consisting of multiple dimensions. The steps included the analyses of existing scales, qualitative investigations (i.e. focus groups and critical incidences), a small scale pilot study for internal reliability and validity and a large scale quantitative study for scale purification and scale fit. A tridimensional impulsive buying tendency scale has been presented to the literature.
Keywords: Impulse Buying, Scale Development, Multitrait Multimethod Matrix, Confirmatory Factor Analysis JEL Classification: M31, C00, M39
KARMA YÖNTEM KULLANIMI İLE BİR DÜRTÜSEL SATINALMA ÖLÇEĞİ
GELİŞTİRİLMESİ
Özet
Pazarlama ve tüketici davranışı yazınlarına bakıldığında, tamamen akılcı karar veren tüketici bireylerden hisleriyle, duygularıyla ve hatta dürtüleriyle karar veren tüketici bireye geçiş yaşanmıştır. Bu geçiş ise tüketicinin daha önce olmadığı kadar komplike ve karmaşık süreçler yaşadığını ortaya çıkarmıştır. Ölçüm yapmak bilimin temel vazifelerinden olduğuna göre (deVellis, 2003), tüketicinin bu karmaşık özelliklerini anlayabilmek de yeni ölçüm ve ölçeklere ihtiyacı arttırmıştır. Bu çalışma, tüketicilerin dürtüsel satınalma eğilimlerinin ölçülebileceği güvenilir ve geçerli bir ölçek sunmaktadır. Halihazırda bulunan ölçek maddeleriyle yetinilmeyerek, iki farklı nitel yöntem ile ölçek ifadeleri geliştirilmiş, pilot çalışmalar ve devamında model uygunluğunu test eden geniş ölçekli anket çalışmaları ile üç boyutlu bir ölçek sunulmuştur.
Anahtar Kelimeler: Dürtüsel Satınalma, Ölçek Geliştirme, Çoklu Özellik-Çoklu Yöntem Modeli, Faktör Analizi JEL Sınıflaması: M31, C00, M39
1. Introduction
As the dominant paradigms change in social sciences, so do the subtopics of each discipline. In the marketing domain for example, in terms of consumer behavior, there has been a relatively recent shift from rational, information processing models of buying that schematize a rational consumer according to its mental processes and cues etc. (Bettman, 1970) towards models that opened up the space for the role of emotions, fantasies, maybe irrationalities such as experiential consumption (Holbrook and Hirschmann, 1982).
126
The measurement tools, scales and models need to be varied or updated before they become obsolete in the face of emerging theories. Impulsiveness, once a clinical concept, a trait to be restrained, was adopted by the marketing academia and converted into the impulsive consumer or impulse buying (IB) concepts. Since 1940s, it has been revealed that a great portion of purchases are not very well planned as opposite to the classical assumptions. More and more people are claiming to be deciding on the spot, especially in retail settings, supermarkets and department stores (DuPont studies, 1945-1965). Impulse purchase models started to demonstrate which factors can the companies or marketers modify in order to increase the purchase of their products, in addition to planned purchasers.
This study is an attempt to construct a scale that aims to measure the impulsive buying tendency (IBT) of consumers. A growing number of studies use impulse purchasing as independent or dependent variable in their buying models because of easier than ever purchasing methods thanks to technological developments. However, there is an equally increasing need for measurement because there are only a few valid scales which are highly diverse. Second, most of these scales belong to the previous decades and they are mostly biased according to the very different definitions of impulse purchasing by the different authors. Third, most scales are made up of very few statements, as few as five items. Fourth, an accurate scale is much more efficient than simply asking the consumers to report their intention to buy a product on the spot. For all the above listed reasons, combined with a need for refreshed and triangulated methodology in scale development, we aim to provide a comprehensive, valid and reliable impulse purchasing scale consisting of multiple dimensions.
2. Construct definition and content domain
According to Churchill (1979), the first step for developing better measures of constructs is to define the domain. So, first issue is to reveal where impulse buying stands in the overall buying behavior, how it is defined and whether it has subdimensions.
2.1. Literature review
Until in-depth exploratory studies, there has been the dominance of industry-specific, product-oriented perspectives in the literature. The earliest stream of research, such as the ones by DuPont, has shown how impulse purchasing differed according to different kinds of products. Kollatt and Willet (1967) went one step further and recommended the shift towards customers rather than products themselves, by highlighting the surprising fact that most studies did not have the shopper as the independent variable.
As a result of the spot moving onto the customer rather than the store or product, Cobb and Hoyer (1986) conducted a study with the methods of direct observation and questionnaires and reached some conclusions about the characteristics of impulse purchasers. Rook’s studies (Rook, 1987; Rook and Fisher, 1995) have been among the most inspiring and revelatory on the subject because of the various methods employed.
In “The Buying Impulse” (Rook, 1987), the contents of impulse purchasing have been carefully revealed such as involving a compulsive component, coming with a spontaneous urge to buy, involving excitement and stimulation and sometimes even animating the products in mind, feelings of hedonism and conflict and lastly disregard for consequences. So in the 1990s, the research stream came back which investigates impulse buying from a negative perspective, echoed by the clinical views of impulsiveness in psychology as a disorder.
The importance of a clear construct definition also requires a discussion of unplanned buying versus impulse buying. Beginning from Stern (1962), it is observed that not only there is a dichotomy between planned versus unplanned purchases but also the authors agree that there are levels of pre-purchase planning and purchase intention.
127
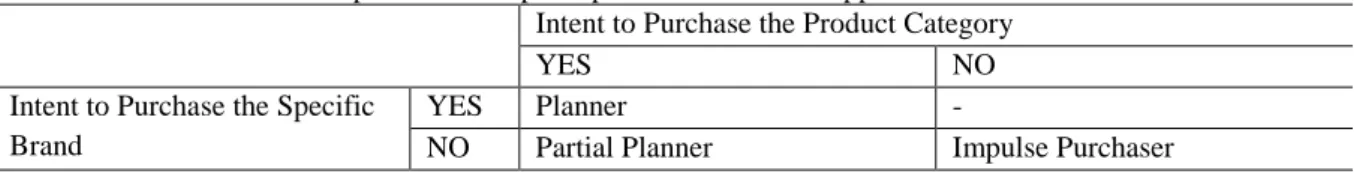
For this objective, Stern (1962) offered an impulse buying quadrant which is called “The Impulse Mix”, consisting of Pure IB, Reminder IB, Suggestion IB and Planned IB. Similarly, Kollatt and Willett (1967) listed levels of impulse buying as: product and brand decided, only product category decided, only product class decided, a general need recognized or ageneral need not recognized. However, Cobb and Hoyer (1986) managed to differentiate the impulse buying concept in the overall shopping behavior scheme according to intent to buy the category and/or the brand as in the following Table 1.
Table 1: The position of impulse purchasers in the shopper classification scheme
Intent to Purchase the Product Category
YES NO
Intent to Purchase the Specific Brand
YES Planner -
NO Partial Planner Impulse Purchaser
Source: Cobb and Hoyer (1986)
To overcome the different classifications of unplanned purchases and to make the distinction of unplanned purchases and impulse purchases more clear, an agreed definition of the concept is also necessary. The emphasis on the role of stimuli was also included in the definition with an effort to decrease the inconsistent operationalization of the subject. According to this fourfold definition: impulse buying is unplanned, decided on the spot, stem from reaction to stimulus and involves a cognitive reaction, an emotional reaction, or both (Piron, 1991). More specifically, the tendency to engage in impulse buying is the degree to which an individual is likely to make unintended, immediate, and unreflective purchases (Jones et al., 2003).
2.2. Construct dimensionality
A review of the existing scales covering the domain of IB reveals that there has been a shift from unidimensionality towards multidimensionality of scales. Parallel to the theoretical advancements in the field, a mechanical and guilty perspective towards impulsive buyers has shifted towards a multi-faceted and complex perspective involving emotions and attitudes as well as cognition and rational calculations. A summary of the dimension-related differences of existing scales are presented in Table 2.
Table 2: Dimensional structure of existing impulse buying tendency scales
Asugman and Cote, 1993
Rook and Fisher, 1995
Puri, 1996
Weun, Jones and Beatty,
1998
Verplanken and Herabadi, 2001
tridimensional unidimensional unidimensional unidimensional bidimensional
reactive buying cognitive
reminder buying affective
compulsive buying
12 items 9 items 12 adjectives 5 items 20 items
The hedonism component highlighted by Rook (1987) had been an important part of operationalizing the impulse purchasing concept in many studies (e.g. Asugman and Cote, 1993; Puri, 1996). It has been one of the most comprehensive scales tapping the IP domain.
128
The multidimensional concept of impulse buying employed in Asugman and Cote’s study (1993) revealed that impulse buying had three subcomponents as Reminder, Reactive and Compulsive Buying and also criticized emphasizing the reactive dimension too much, before. Reactive and compulsive dimensions tap the affective personality whereas the reminder dimension taps the cognitive aspect.
In Rook and Fisher’s study (1995), a 9-item unidimensional scale to measure “buying impulsiveness” has been developed and later cited and used widely (i.e. Jones et al., 2003).
Recklessness, going with the flow and lack of thinking were emphasized overall. Puri (1996) developed a much different scale of consumer impulsiveness (CIS) made up of 12 adjective-like items. However, those adjectives were far from describing any buying or shopping context but rather they were general traits like carelessness or extravagance. Weun et al. (1998) developed a unidimensional scale comprised of 5 statements and claiming better functionality than the Rook and Fisher (1995) scale.
More recently, Verplanken and Herabadi (2001) developed a two factor 10+10 item scale. The scale consists of cognitive and affective items as two dimensions. Besides these scales, in some studies impulse buying intention is measured directly by asking it or at most giving two statements of intention to buy immediately (e.g., Harmancioglu et al., 2009). Faced with different dimensional structures employed in the literature before, an in-depth investigation of the concept became necessary in addition to the literature review.
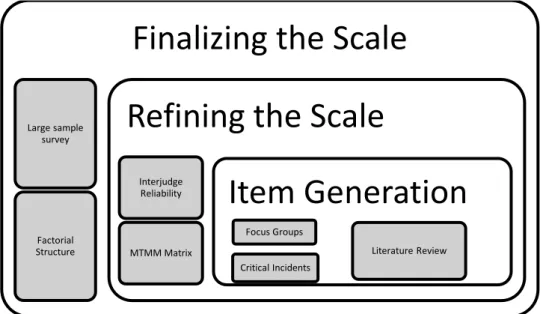
As multi-method studies are very fruitful and as the ongoing debate about the complementarities between qualitative and quantitative investigations (Sale et al., 2002) favor use of triangulation logic, scale development attempts had better begin with an in-depth hands-on exploration of the concept. Figure 1. is a summary of the methods to be employed in the scale development process.
Figure 1: The summary of the steps taken in the scale development process
3. Generating and eliminating measurement items
Before generating a new scale and quantifying the results collected with that scale, it would be very appropriate to bring more insight and explore the issue through qualitative and verbal analyses, too, as in various studies on impulse purchasing (Bayley and Nancarrow, 1998; Rook, 1987; Merdin, 2010). Also, the psychological aspects of the consumer behavior discipline and especially buying behavior bring the necessity of collecting recent and detailed information as much as possible.
Finalizing the Scale
Large sample survey
Factorial Structure
Refining the Scale
Interjudge Reliability MTMM Matrix
Item Generation
Focus Groups Critical Incidents Literature Review129
The appropriate methods chosen were focus groups and critical incidence technique. Impulse purchasing is a relatively unexplored area in marketing and it involves psychological aspects. Focus groups were chosen as appropriate to begin with because group discussions make it easier to conduct less structured interviews, produce concentrated amounts of data and provide in-depth understanding without in-depth interviews where the interviewee is assumed to have more to say (Morgan, 1997).
As a second method, critical incidence method has been employed. It has been observed that when asked normative or general questions like defining impulse purchasing or the characteristics of an impulse purchase, most subjects gave normative evaluations based on their values or socially desirable statements. But when prompted to recall one of their recent unplanned purchase, richer data and more detailed answers have been gathered. So the researcher saw a marginal benefit of the critical incidence collection to check if some aspects are missing or should be deleted.
Additionally, as also stated by Bitner et al. (1990):“when the purpose of the research is to increase knowledge of a phenomenon about which relatively little has been documented and/ or to describe a real-world phenomenon based on thorough understanding, an approach such as CIT seems particularly well suited to the task” (p.73).
3.1. Focus groups
The participants of the focus groups are selected purposively instead of randomly due to the necessary shift from random sampling toward theoretically motivated sampling (Morgan, 1997). Both groups made up a convenience sample of consumers representing both sexes and various income and age brackets.
The first focus group consisted of five participants, who were relatives of each other. The family focus group discussion lasted for 47 minutes, it was audiotaped and the participants have been informed. The age range was between 38-65. This allowed spontaneous interaction on the one hand and provided an additional advantage of conducting the group discussion without any established group roles like the parents dominating the younger or vice versa (Sykes, 1990). The group consisted of three females and two males, assuring sex differences. Three participants were retired, one was a housewife and the last one was working as an engineer in a private company. Three out of the five participants were college graduates, one had a masters degree and one had a high school degree.
The second focus group consisted of five participants as well, who were doctoral students of business in two universities and gathered together in a comfortable meeting room in the faculty where all participants were acquaintainted. The discussion lasted for 43 minutes, it was audiotaped and the participants have been informed about that. The age range was between 25-34. The group consisted of three females and two males. Two participants were also working as research assistants, one was also working as engineer in the Scientific and Technological Research Council (TUBITAK) and one was a doctoral student. Although the group was much more homogenous than the first group in terms of age and occupation, the group has been set by convenient sampling so the discussion tempo and creativity was a bit lower due to the similarities of the members. It was also a signal for the researcher that focus groups have come to the saturation.
But still, the second group is different than the first group in terms of all characteristics and provided rich data as well from a different perspective.
There are particular reasons to have chosen a group of a family and a group of business students for the focus groups. Although Morgan (1997) puts the rule of using homogenous strangers as participants among the rules of thumb of focus groups, the fact that focus groups consisting of strangers is actually a myth is accepted in many studies in the literature (Morgan and Krueger, 1993).
130
In their detailed qualitative analysis of impulse purchasing, Bayley and Nancarrow (1998) adopted friendship pair interviews technique for their inquiry with the rationale that “familiarity with each other gives them the confidence to openly explore and challenge both their own and each other’s behaviors, motivations, satisfactions and anxieties” (p.105).
Thus, using a sample for the focus groups, who are in contact with each other and have continuing relations, helped overcome the social desirability bias, the introversion which is a problem of focus groups held with total strangers and also facilitated fruitful and creative discussion.
Some main questions asked by the researcher were recalling the last purchase made on the spot, product categories generally bought on impulse, the reasons for deciding to buy on the spot and visualizing and describing an impulse purchaser prototype. During the whole course of discussion, the moderator used several techniques to facilitate deeper discussion and to help dimensionalize the concept as well as making sure that the participants were openly describing their ideas. Most of these techniques were also used in Bayley and Nancarrow’s study (1998) on impulse purchasing and provided beneficial insight.
For example, one of the techniques was “opposites”, trying to reveal the definition of impulse purchase by asking its opposites. In this case, the moderator asked the group if being a very planning person is the opposite of an impulse purchaser and more similar questions. Within this method, negative prefixes are disallowed such as “unimpulsive purchasing”.
3.2. Critical incidence technique
The decreased marginal contribution of the second focus group was also a signal for the researcher that focus groups have come to the saturation and combined with the fact that impulse purchasing is not exactly an area that there are experts on the subject to be interviewed in depth for a long time, the critical incidence technique (CIT) has been chosen as a complementary exploratory study. CIT is a useful way of content analysis for stories people have told (Bitner et al., 1990).
10 detailed cases were gathered online with the following scheme:
“As a customer, think about an incident that you purchased a product / service without a previously prepared list or any intention. For example it can be a hairdresser’s service that you decide just passing by OR a sweater that you liked and bought at the first time you saw it without any emergent need.”
The respondents were asked for details about the category bought, momentary details of seeing and deciding about the product, elaborating on the potential reasons, recalled thought processes on the spot and consequences afterwards. Most of the incidents happened in a retail setting buying clothes. A limited number of incidents have been collected due to time and convenience restraints. But since the incidents summed up with the incidents reported during the interviews showed similar patterns an informed item generation phase was initiated.
3.3. Item elimination
At this stage, an original pool of 28 items was generated using the combination of three methods: a review of the literature, two focus groups and a collection of critical incidences.
The focus group discussions audiotapes have been transcribed and all main themes have been revealed by content analysis by the researcher. Taken altogether, the qualitative data interpretation leads to some item formation. Before adding up the items from extant literature, the themes emerging from the qualitative studies had to be itemized and categorized. To distribute to the two independent judges, the themes had to be formed from the content analyses.
131
There is also the question of how many initial items is enough to tap the domain. Generally accepted rule of thumb for this question is that the initial pool consists of twice as much items as the final scale (Netemeyer et al., 2003). Following qualitative data analysis steps, in terms of data reduction the answers have been summarized, excluding the unnecessary or irrelevant items, then matched into larger patterns.
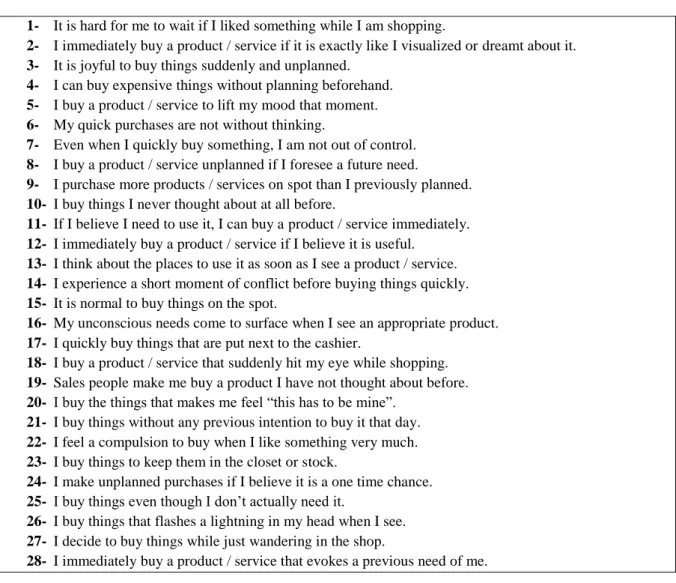
Some ambiguous items according to the judges have been deleted. The shown set of items in Table 3. emerged at the end to present to two different expert judges to check for interrater reliability:
Table 3: Original item pool
1- It is hard for me to wait if I liked something while I am shopping.
2- I immediately buy a product / service if it is exactly like I visualized or dreamt about it. 3- It is joyful to buy things suddenly and unplanned.
4- I can buy expensive things without planning beforehand. 5- I buy a product / service to lift my mood that moment. 6- My quick purchases are not without thinking.
7- Even when I quickly buy something, I am not out of control. 8- I buy a product / service unplanned if I foresee a future need.
9- I purchase more products / services on spot than I previously planned. 10- I buy things I never thought about at all before.
11- If I believe I need to use it, I can buy a product / service immediately. 12- I immediately buy a product / service if I believe it is useful.
13- I think about the places to use it as soon as I see a product / service. 14- I experience a short moment of conflict before buying things quickly. 15- It is normal to buy things on the spot.
16- My unconscious needs come to surface when I see an appropriate product. 17- I quickly buy things that are put next to the cashier.
18- I buy a product / service that suddenly hit my eye while shopping. 19- Sales people make me buy a product I have not thought about before. 20- I buy the things that makes me feel “this has to be mine”.
21- I buy things without any previous intention to buy it that day. 22- I feel a compulsion to buy when I like something very much. 23- I buy things to keep them in the closet or stock.
24- I make unplanned purchases if I believe it is a one time chance. 25- I buy things even though I don’t actually need it.
26- I buy things that flashes a lightning in my head when I see. 27- I decide to buy things while just wandering in the shop.
28- I immediately buy a product / service that evokes a previous need of me.
The independent judges employed were given the construct definition and a related explanation. The raters were asked to allocate items to the appropriate dimensions. Items that were not assigned to the same category after two rounds were to be eliminated; however in the first round items were properly placed. Three informed dimensions emerged:
1. Hedonic (experiential, affective) component is defined like emotion-related statements, measuring the experience of shopping rather than tangible benefits.
2. Cognitive (logical, deliberative) component represents the thoughts, decision making processes etc.
3. Lack of planning (spontaneity, immediacy) component represents the lack of planning beforehand and the spontaneity of the purchase decision, like the time dimension of our construct.
132
These categories have been in accordance with the literature and from here on, the categories are to be coded with H, C and L respectively.
According to Netemeyer et al.’s (2003) initial scale development rules, first issue in item generation and elimination is domain sampling, meaning that there is a universe or a pool of items, consisting of large amounts of items that tap various but exhaustive dimensions of the constructs.
The selection among them has to be done making sure that certain amounts of items are covering all necessary domains that make up the construct. As well, this consideration will provide content validity of the scale. To conclude, a two-phase process is employed for establishing content validity including an initial screening of items and expert assessments of the applicability of the items to each dimension and their representativeness. When the results have been retrieved back from the judges and compared, there were 23 exact matches out of 28 items by the two independent judges. The overall percentage of agreement is thus 82.1%, which is much more than chance level of agreement. However, percentage of agreement numbers are not enough to comment on the reliability of interjudge agreements due to many reasons also mentioned by Perrault and Leigh (1989) such as the bias of high agreement when there are a few categories. Thus, the interjudge agreement has been calculated by another method: the interrater reliability index based on Perrault and Leigh’s equation (1989):
IR= {[(F/N) – (1/k)] [k/(k-1)]}.5
where IR is the interrater reliability coefficient, F is the absolute level of observed agreement among all judges for each item placed in the same category,N is the total number of items judged, andk is the number of coding categories. Since F= 23, N= 28, k= 3,the IR can be calculated as:
IR= {[(23/28) – (1/3)] [3/(3-1)]}.5 IR= .856
There is nearly 86% interrater reliability in the coding process.
4. Designing and conducting studies to develop and refine the scale
A pilot test as an item-trimming procedure has been prepared. The resulting items were converted into their last shapes, ambiguous ones were deleted and necessary and similar items have been changed with their substitutes in the previously used scales in the literature review. In order to test for method differences in the second phase, the same items have been asked to be responded to in terms of two different methods. In the first part, the items are measured with interval (Likert) scale (where 1 = strongly agree, 5 = strongly disagree) and the respondents are requested to answer with ratio scale, too, for multimethod technique (1= I strongly disagree with the statement, 100 = I strongly agree with the statement).
This design, rather than two different questionnaires with same items, is thought to be very convenient for the respondent to fill and still allows for method variety due to different judgements of respondents with the ratio scale.
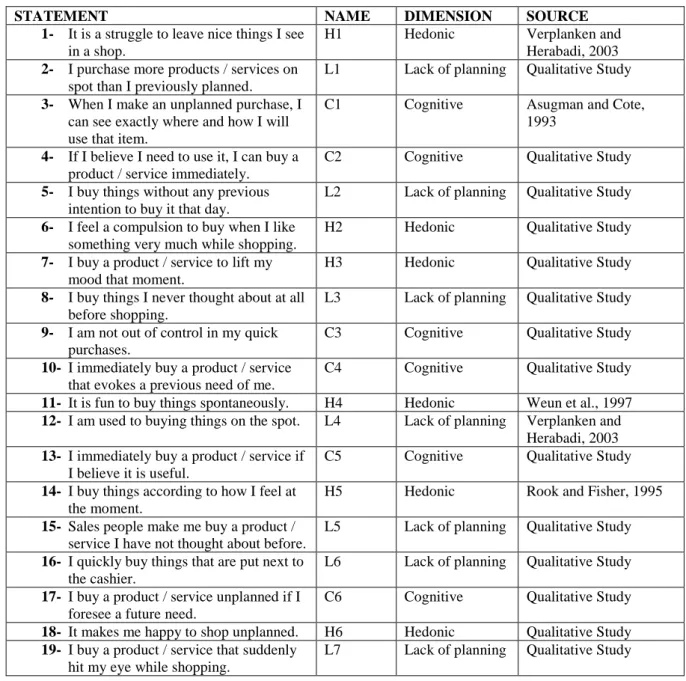
The developed and ready questionnaire to be distributed to the respondents as the pilot test for assessing reliability and validity is presented in Table 4.
133
Table 4: Pilot test questionnaire items, labels and sources
STATEMENT NAME DIMENSION SOURCE
1- It is a struggle to leave nice things I see
in a shop.
H1 Hedonic Verplanken and
Herabadi, 2003
2- I purchase more products / services on
spot than I previously planned.
L1 Lack of planning Qualitative Study
3- When I make an unplanned purchase, I
can see exactly where and how I will use that item.
C1 Cognitive Asugman and Cote,
1993
4- If I believe I need to use it, I can buy a
product / service immediately.
C2 Cognitive Qualitative Study
5- I buy things without any previous
intention to buy it that day.
L2 Lack of planning Qualitative Study
6- I feel a compulsion to buy when I like
something very much while shopping.
H2 Hedonic Qualitative Study
7- I buy a product / service to lift my
mood that moment.
H3 Hedonic Qualitative Study
8- I buy things I never thought about at all
before shopping.
L3 Lack of planning Qualitative Study
9- I am not out of control in my quick
purchases.
C3 Cognitive Qualitative Study
10- I immediately buy a product / service
that evokes a previous need of me.
C4 Cognitive Qualitative Study
11- It is fun to buy things spontaneously. H4 Hedonic Weun et al., 1997
12- I am used to buying things on the spot. L4 Lack of planning Verplanken and Herabadi, 2003
13- I immediately buy a product / service if
I believe it is useful.
C5 Cognitive Qualitative Study
14- I buy things according to how I feel at
the moment.
H5 Hedonic Rook and Fisher, 1995
15- Sales people make me buy a product /
service I have not thought about before.
L5 Lack of planning Qualitative Study
16- I quickly buy things that are put next to
the cashier.
L6 Lack of planning Qualitative Study
17- I buy a product / service unplanned if I
foresee a future need.
C6 Cognitive Qualitative Study
18- It makes me happy to shop unplanned. H6 Hedonic Qualitative Study
19- I buy a product / service that suddenly
hit my eye while shopping.
L7 Lack of planning Qualitative Study
According to Netemeyer et al. (2003), pools with small number of items (20 items or less), similar to the number of items employed in this scale (19), are counted as narrowly defined construct so a small sample is enough. 37 questionnaires have been collected but 2 of them were cancelled due to ambiguous answering and amount of blank answers.
The analysis aim is to analyze, purify and validate the scale. According to the descriptives, the ranges that the answers belong are quite normal and there is no significantly loaded item. Analyzing the means, it is observed that the highest rated item overall (mean= 4.28) is “When I make an unplanned purchase, I can see exactly where and how I will use that item”, reassuring the emphasis on cognition which was also observed in the qualitative studies. The item with the lowest mean (mean=2.14) is “I quickly buy things that are put next to the cashier”, which is one of the most specifically worded items in the scale.
134
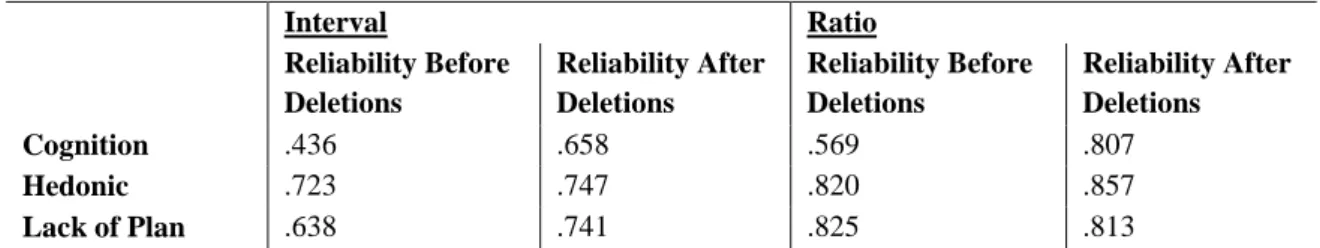
The reliability analyses have been conducted for both type of scales (interval and ratio). With the aim of scale purification, each of the three dimensions determined have been analyzed with Cronbach’s Alpha from item-total statistics of each of the three dimensions. The “Cronbach’s Alpha if Deleted” scores guided the purification process towards the highest reliability score. Table 5. sums up the whole operations for dimension reliability:
Table 5: Reliability scores before and after deletions
Interval Ratio Reliability Before Deletions Reliability After Deletions Reliability Before Deletions Reliability After Deletions Cognition .436 .658 .569 .807 Hedonic .723 .747 .820 .857 Lack of Plan .638 .741 .825 .813
As a result of the purification process, overall reliability of the scale using Cronbach’s Alpha has been calculated as .727. In this stage of the research, minimum Alpha levels acceptable are changing betwen .60 and .70 and the reliability score of the total scale satisfies this as well.
4.1. MTMM matrix
The Multitrait-Multimethod Matrix is used to assess construct validity of a set of measures in a study, developed by Campbell and Fiske (1959) which is a matrix shaped visualization of a set of correlations used within the study. It is assumed that there are several traits to be measured and each should be measured by more than one method. The method variance can be assessed through using different response scales, different type of questionnaires or assessment by different perspectives. The main diagonal, called the reliability diagonal, that does not show correlations of 1 but rather gives the result of two measurements gained through one of the techniqes of Test-Retest or Split-Half or Cronbach’s Alpha.
In this study, there are three seperate traits as three dimensions of our construct: cognitive, hedonic and lack of planning. In terms of method variance, the researcher asked the respondents to rate the statements in terms of two different scores, one over a 5 point Likert scale and one over 100 ratio scale, as previously explained.
Table 6: Multitrait-Multimethod Matrix of the pilot test
Method 1 (Interval) Method 2 (Ratio) C1 H1 L1 C2 H2 L2 Method 1 (Interval) C1 .657 H1 .258 .747 L1 -.006 .307 .741 Method 2 (Ratio) C2 .739 .392 .017 .807 H2 .155 .872 .315 .541 .857 L2 -.138 .458 .730 .161 .596 .813
In Table 6., the main diagonal is called the reliability diagonal and it represents the Cronbach’s Alpha reliability scores of each dimension of each scale. Reliability is the agreement of two efforts to measure the same trait with similar methods so the coefficients in the reliability diagonal should consistently be the highest in the matrix. In this scale, H1-H2 correlation is high to note.
135
Coming to validity checks, it is investigated whether there is agreement of two attempts to measure the same thing with different methods. The italic diagonal represents the validity diagonal and the coefficients in the validity diagonal should be significantly different from zero and high enough to warrant further investigation. In this case, they are all higher than .7, thus assuring convergence validity so we can continue the analysis.
For discriminant validity, there are three criteria to be fulfilled. First, a validity coefficient should be greater than the values lying in its column and row in the same heteromethod block. A second condition for discriminant validity is that a validity coefficient should be higher than all coefficients in the heterotrait-monomethod triangles. A final criterion is that the same pattern of trait interrelationships should be seen in all triangles (Campbell & Fiske, 1959). This criterion is met by all the heterotrait-monomethod and heterotrait-heteromethod triangles (Campbell & Fiske, 1959). These three criteria are met by the coefficients represented in our matrix.
5. Validating the scale and the dimensional structure
In order to test for the scale’s dimensionality, the remaining 11 items were distributed to a new and different sample of 200 adult consumers. The participants were members of an online consumer panel (ie. Amazon Mturk), consisting of native English speakers from member countries (ie. USA and Canada). The sample also represented a varied age distribution unlike student samples. The age of the respondents range from 18 to 76 with a mean of 31.96. 61.6% of the respondents reported themselves to be in the middle income group compared to a 36.4% of low income. High income group constructs a very small percentage of the sample like 2%, which generally is the case in survey results, probably stemming from the unwillingness for disclosure. Additional measures were also collected to assess the validity of the scale. 2 questionnaires were excluded from the analysis due to ambiguities.
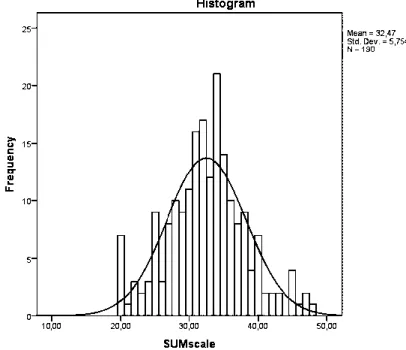
5.1. Data analysis
As observed from the histogram in Figure 2., the overall scale ratings are slightly left-skewed but well-distributed.
136
An exploratory factor analysis (EFA) has been employed first in order to check the original dimensional structure of the data gathered. Large values for the Kaiser-Meyer-Olkin (KMO) measure of sampling adequacy indicate that a factor analysis of the variables is appropriate. The observed KMO measure of .726 and a significant Bartlett’s test of spherecity encouraged the multidimensional structure. Analyzing the principal components matrix, one item from the cognitive dimension (C6) has been deleted due to doubleloading. The deleted item included the phrase of “foreseeing a future need” which may be problematic in terms of verbal evaluation. In line with this correction, the reliability score of the dimension increased from .630 to .748. This item was not omitted before because internal reliability survey’s sample was not large enough to provide sound factor analysis results.
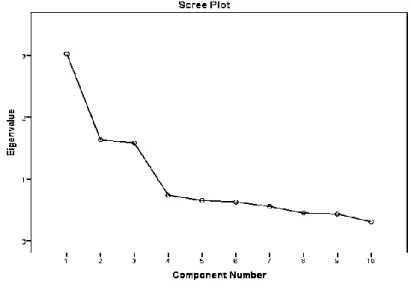
Since the factor analysis provides sound results with samples equal or more than 200 (Comrey, 1988), the analysis continued with EFA. Total variance explained by this three-dimensional structure is nearly 62%. The scree plot in Figure 3. also visually confirms the proposed structure.
Figure 3: Scree plot of the factorial structure
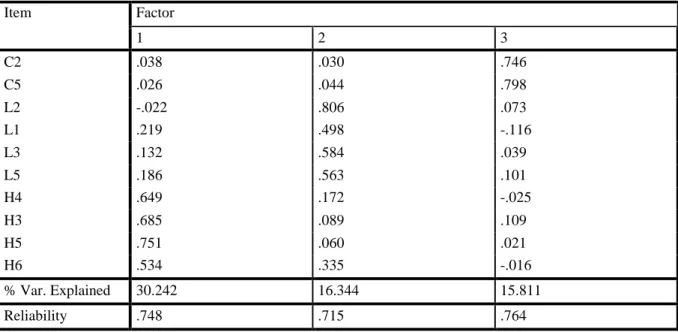
The composite reliability of the overall scale is .724 and the reliability scores for the cognitive, lack of planning and hedonism dimensions are .748, .715 and .764 respectively. As a rule of thumb, loadings between 0.60 and 0.90 considered acceptable (Bagozzi & Yi, 1988). The overall reliability score of the scale satisfies the common threshold of 0.70, even though exploratory research like this scale generation attempt allows for even less (Hair et al., 1995). Table 7. presents the rotated factor matrix.
137
Table 7: Rotated factor matrix
Item Factor 1 2 3 C2 .038 .030 .746 C5 .026 .044 .798 L2 -.022 .806 .073 L1 .219 .498 -.116 L3 .132 .584 .039 L5 .186 .563 .101 H4 .649 .172 -.025 H3 .685 .089 .109 H5 .751 .060 .021 H6 .534 .335 -.016 % Var. Explained 30.242 16.344 15.811 Reliability .748 .715 .764
After reliability, The Confirmatory Factor Analysis (CFA) has been performed via using AMOS 20.0 in order to assess model fit. The hypothesized three-factor model was estimated and the results show fit between the proposed dimensional structure and the observed covariance among items in the factors.
A carefully performed factor analysis plays a crucial role in supporting the discriminant validity of a newly developed measure (Clark and Watson, 1995; Civelek and Uca, 2017). Very low scores of covariance among three factors, .08, .12 and .39 respectively, show the discriminatory validity of the three distinct factors proposed. The PCLOSE is acceptable after .05 and the score of our model is .086. Besides; the model has good fit scores like adjusted goodness of fit index (AGFI) =.898; comparative fit index (CFI) =.931; incremental fit index (IFI) =.933 and relative fit index (RFI) =.822. In terms of Modification Indices (MI), there is no large MI score among error terms thus showing lack of covariance and lack of covariated unneccesary items. The fit indices and references are presented in Table 8 (Byrne, 2001).
Table 8: Model fit statistics
MODEL FIT
RMSEA RMR CFI PNFI PGFI AIC GFI AGFI
Default model .071 .071 .931 .621 .547 109,737 .940 .898
Fit range [0;.01] [0;1] [0;1] [0;1]
[-;+] High
value = bad fit [0;1] [-;1]
Chi-square=
63,737
138
5.2. Nomological validity
To find evidence for the place of the impulse buying intention scale in a nomological net of impulse buying, the questionnaire included some additional questions. The question about the percentage of unplanned purchases was intended to measure the impulse buying behavior. The reason of choosing that variable is that in many studies the IP intent is related with IP behavior in the theoretical models. It is proposed that consumer characteristics and new product knowledge affect impulse buying intention and in turn it affects the impulse buying behavior (Harmancioglu et al., 2009). In the same fashion, Jones et al. (2003) proposed product involvement affecting product-specific impulse buying tendency and in turn it affected product-specific impulse buying behavior. Also, in the milestone article of Rook and Fisher (1995), buying impulsiveness was put as the independent variable and impulse purchase as dependent variable. Thus, in order to look for nomological validity, the percent of unplanned purchases is checked for its relation with the IP tendency scale and a significant correlation of .387 confirmed the hypothesized relation. However, it is not appropriate to propose causality or a direction of any relationship at this stage of investigation.
The questionnaires included various demographics like age, gender and income. In this sample, only the age variable is correlated with the impulse purchasing behavior (r=.192) whereas gender and income are insignificant in terms of impulsive buying tendency or behavior.
6. Conclusion
The primary contribution of this research is to present a finalized reliable measure of the impulse buying tendency of consumers as a ten-item tridimensional scale. In addition to the various strengths and weaknesses of existing scales, the qualitative phase facilitated unique contributions to the field by generating numerous up to date insights. A pilot study aiming for purification and internal reliability has been performed on a nonrepresentative small scale sample followed by a larger scale survey on a different sample for translation and numerous other validity types. After this phase, several statistical evidence was provided regarding the dimensionality, reliability and validity of the proposed scale, including item and factor analyses, and convergent, discriminant, construct and nomological validity.
The insights developed in various phases of this inquiry are hoped to provide further insight into the literatures on impulse buying, hedonic buying and compulsive buying. For example, in the final version of the impulse buying construct scale, the “hedonic” and “spontaneity” dimensions show some similarities with the literature whereas the “utilitarianism” dimension emphasizes the co-existence of cognitive-thinking processes with impulsive purchases. The fact that impulsive purchases are unplanned and fast don’t necessarily deem it as recklessness or regretful. It is rather a pattern of a quick on-the-spot decision-making regardless of labeling it as negative and clinical behavior. The various insights developed in various phases of this inquiry are hoped to provide further insight into the literatures on impulse buying, hedonic buying and compulsive buying.
7. Limitations and future studies
The following limitations of the study are noted. The content validity assessment was conducted by academic referees in marketing; a corporate perspective or a consumer group might have cleared additional ambiguity. In addition, our measure of nomological validity was restricted to unplanned buying behavior. Also, the effects for other contexts such as web- or tele-marketing should be the subject of future research. As an ongoing process, the full validation of the scale should be the subject of future studies, including replication and extension across different contexts and cultures (i.e. Eastern vs. Western societies). Future research also should perform further testing of the scale’s dimensionality, reliability and validity.
139
Even larger samples should be employed in the future together with different variables in order to construct a nomological net of related constructs (i.e. need for control, mortality salience, autonomy etc.). For example, whether online impulse buying context involves different or similar items or traits would be a fruitful and timely research question to begin with.
References
Asugman, G. and Cote, J. (1993). Cognitive and affective decision making preferences in impulse buying. Asian
Journal of Marketing, 2, pp. 23-30.
Bagozzi, R. P. and Yi, Y. (1988). On the evaluation of structural equation model. Journal of the Academy of
Marketing Science, 16, pp. 74-94.
Bayley, G. and Nancarrow, C. (1998). Impulse purchasing: a qualitative exploration of the phenomenon,
Qualitative Market Research: An International Journal, 1(2), pp. 99-104.
Bettman, J. R. (1970). Information processing models of consumer behaviour. Journal of Marketing Research,
7, pp. 370–376
Bitner, M. J., Booms, B. H. and Tetreault, M. S. (1990). The service encounter: diagnosing favorable and
unfavorable incidents. Journal of Marketing, 54, pp. 71–84.
Byrne, B. M. (2001). Structural equation modeling with AMOS, basic concepts, applications, and programming.
Hillsdale, New Jersey: Lawrence Erlbaum Associates.
Campbell, D. T. and Fiske, D. W. (1959). Convergent and discriminant validation by the multitrait-multimethod
matrix. Psychological Bulletin, 56(2), pp. 81-110.
Churchill, G. A. (1979). A paradigm for developing better measures of marketing constructs. Journal of
Marketing Research, 26(1), pp. 59-83
Civelek, M. E., and Uca, N. (2017). Development of paperless foreign trade performance measurement scale: the
multitrait-multimethod model proposal. Beykoz Akademi Dergisi, 5(2), pp. 73-93.
Clark, L. A. and Watson, D. (1995). Constructing validity: basic issues in objective scale development.
Psychological Assessment, 7, pp. 309–319.
Cobb, J. C. and Hoyer, W. D. (1986). Planned versus impulse purchase behaviour. Journal of Retailing, 62(4),
pp. 384-409.
Comrey, A. L. (1988). Factor analytic methods of scale development in personality and clinical psychology.
Journal of Consulting and Clinical Psychology, 56(5), pp. 754-761.
DeVellis, R. F. (2003). Scale development: Theory and applications. Thousand Oaks, California: Sage
Publications.
du Pont De Nemours and Company, (1945, 1949, 1954, 1959, 1965). Consumer Buying Habits Studies.
Wilmington: DE du Pont De Nemours and Company.
Hair, J. F., Jr, Anderson, R. E., Tatham, R. L. and Black, W. C. (1995). Multivariate data analysis, 4th edn.
Englewood Cliffs, New Jersey: Prentice Hall,.
Harmancioglu, N., Finney, R. Z. and Joseph, M. (2009). Impulse purchases of new products: an empirical
analysis. Journal of Product and Brand Management, 18(1), pp. 27-37.
Holbrook, M. B. and Hirschman, E.C. (1982). The experiential aspects of consumption: Consumer fantasy,
feelings and fun. Journal of Consumer Research, 9(2), pp. 132–140
Jones, M. A., Reynolds, K. E., Weun, S. and Beatty, S. E. (2003). The product-specific nature of impulse buying
tendency. Journal of Business Research, 56, pp. 505-511.
Kollatt, D. and Willett, R. (1967). Customer impulse purchasing behaviour. Journal of Marketing Research, 4,
pp. 21-31.
Merdin, E. (2010). Bir dürtüsel satın alma yatkınlığı ölçeği geliştirme denemesi, Proceedings of 15th National
140
Morgan, D. L. (1997). Focus group as qualitative research. Thousand Oaks, California: Sage Publications. Morgan, David L. and Richard A. KRUEGER (1993). “When to use focus groups and why”, David. L. Morgan
(Ed.), Successful Focus Groups: Advancing the State of the Art, pp. 3-19. Newbury Park, Ca: Sage Publications.
Netemeyer, R.G., Bearden, W. O. and Sharma, S. (2003). Scaling Procedures: issues and applications.
Thousand Oaks, California: Sage Publications.
Perreault, W. D. and Leigh, L. E. (1989). Reliability of nominal data based on qualitative judgments. Journal of
Marketing Research, 26, pp. 135-148.
Piron, F. (1991). Defining impulse purchasing. Advances in Consumer Research, 18, pp. 509-514.
Puri, R. (1996). Measuring and modifying consumer impulsiveness: A cost – benefit accessibility framework.
Journal of Consumer Psychology, 5(2), pp. 87-113.
Rook, D.W. (1987). The buying impulse. Journal of Consumer Research, 14, pp. 189-199.
Rook, D. W. and Fisher, R. J. (1995). Normative influences on impulsive buying behaviour. Journal of Consumer
Research, 22, pp. 305-313.
Sale, J. E. M., Lohfeld, L. H. and Brazil, K. (2002). Revisiting the quantitative-qualitative debate: implications
for mixed-methods research. Quality and Quantity, 36(1), pp. 43-53.
Stern, H. (1962). The significance of impulse buying today. Journal of Marketing, 26, pp. 59-62.
Sykes, W. (1990). Validity and reliability in qualitative market research: A review of the literature. Journal of the
Market Research Society, 32(3), pp. 289–328.
Verplanken, B. and Herabadi, A. (2001). Individual differences in impulse buying tendency: Feeling and no
thinking. European Journal of Personality 15, pp. 71-83.
Weun, S., Jones, M. A. and Beatty, S.E. (1998). Development and validation of the impulse buying tendency
141
Appendix
The Proposed Impulse Buying Tendency Scale
Items Mean SD
Cognition Dimension
1- I immediately buy a product / service if I
believe it is useful.
2- If I believe I need to use it, I can buy a
product / service immediately.
Lack of Planning Dimension
3- I purchase more products / services on
spot than I previously planned
4- I buy things without any previous
intention to buy it that day.
5- I buy things I never thought about at all
before shopping.
6- Sales people make me buy a product /
service I have not thought about, before.
Hedonism Dimension
7- It makes me happy to shop unplanned. 8- I buy a product / service to lift my mood
that moment.
9- It is fun to buy things spontaneously. 10- I buy things according to how I feel at
the moment. 3.58 3.59 3.24 2.99 3.13 2.97 3.08 3.24 3.27 3.38 1.03 1.06 1.10 1.10 1.05 1.13 1.15 1.07 1.04 1.02