Full Terms & Conditions of access and use can be found at
https://www.tandfonline.com/action/journalInformation?journalCode=tjas20
Italian Journal of Animal Science
ISSN: (Print) 1828-051X (Online) Journal homepage: https://www.tandfonline.com/loi/tjas20
Lactation Curve and Persistency of Anatolian
Buffaloes
Aziz ŞEahin, Zafer Ulutaş, Yıldırım Arda, Aksoy Yüksel & Genç Serdar
To cite this article:
Aziz ŞEahin, Zafer Ulutaş, Yıldırım Arda, Aksoy Yüksel & Genç Serdar (2015)
Lactation Curve and Persistency of Anatolian Buffaloes, Italian Journal of Animal Science, 14:2,
3679, DOI: 10.4081/ijas.2015.3679
To link to this article: https://doi.org/10.4081/ijas.2015.3679
©Copyright A. Şahin et al.
Published online: 17 Feb 2016.
Submit your article to this journal
Article views: 850
View related articles
View Crossmark data
Lactation curve and
persis-tency of Anatolian buffaloes
Aziz Şahin,1 Zafer Ulutaş,2 Arda Yıldırım,3 Yüksel Aksoy,3 Serdar Genç4 1Department of Animal Science, Ahi Evran University, Kırşehir, Turkey
2
Department of Animal Production and Technologies, Niğde University, Turkey
3
Department of Animal Science,
Gaziosmanpasa University, Tokat, Turkey
4
Department of Biotechnology, Ahi Evran University, Kırşehir, Turkey
Abstract
The aim of this study was to determine the lactation curve traits of Anatolian buffaloes raised under different conditions in farms in Tokat Province, Turkey. Wood’s gamma curve parameters were employed to identify the lac-tation curve types, and values for the parame-ters beginning yield (a), coefficient of rising (b) and coefficient of decreasing (c) were used to determine the shape and type of lacta-tion curve. All parameters in typical lactalacta-tion curves were positive, and in the event of one parameter being negative, the curve was con-sidered to be an atypical lactation curve. A total of 690 lactation curves were investigated. It was determined that 406 (58.84%) of these curves were typical, while 90 (13.04%) were concave and 194 (28.12%) of a decreasing type. For typical lactation curves, a, b, c, persis-tency (S), time after parturition until the peak yield occurs (Tmax), maximum daily peak yield
(Ymax), and coefficient of determination (R2)
were 7.14±0.008, 0.85±2.1, 0.40±0.001, 2.68, 63.6, 6.41 and 76.33, respectively. For concave lactation curves, values for a, b, c, Tmax, Ymax
and R2 were 4.94±0.42, 0.73±0.016, -0.23±0.0038, 95.40, 7.41±0.004 and 71.68, respectively. For decreasing typical lactation curves, values for a, b, c, Tmax, and R2were
5.31±0.0041, -0.15±0.007, 0.039±0.0023, 3.89±0.11 and 79.94, respectively. Parameters predicted by the Wood model within the scope of this study have the potential of being useful for breeding programmes. Further breeding/selection activities could be conduct-ed by using the female Anatolian buffaloes with typical lactation curves.
Introduction
Owing to their resistance to diseases and lower feed consumption, buffaloes are a pre-ferred livestock species in various regions of Turkey (Soysal et al., 2005). In Turkey, buf-faloes are bred particularly for their milk, and are later slaughtered for their meat once past their productive age (Şekerden, 2001). Buffalo milk is one of the most valuable products obtained for buffaloes; it represents an impor-tant source of protein for low-income buffalo farmers living in rural areas, as well as a sig-nificant source of income for rural economies (Borghese, 2005; Yılmaz et al., 2011). Buffaloes in Turkey are referred to as the Anatolian buffaloes, which represent a sub-group of the Mediterranean buffalo. There are two main types of buffalo in Turkey, one being the swamp buffalo, and the other being the river buffalo. The latter type is more valuable in terms of milk production.
As milk production is one of the main source of income for dairy farms, records of milk yield are of significant importance for dairy herds. The proper estimation of annual total milk pro-duction, as well as the effective organization of breeding plans and management systems for dairy herds based on these estimates, depends both on the efficiency of the system used for recording milk production levels and the accu-racy of methods for calculating the milk yield of herds. The term lactation curve refers to a graph illustrating the relationship between milk yield and the period of time after calving. The objective of modeling a lactation curve is to predict, as precisely as possible, the level of milk production after calving, and to thereby provide an understanding of the pattern of milk production under varying environmental conditions. In other words, these graphical representations, which demonstrate the rela-tionship between milk yield and lactation, are assumed to indicate the total milk yield of a single lactation. The careful analysis of lacta-tion curve shapes is important, as they might highlight feeding and management-related problems in a dairy herd (Epaphras et al., 2004). On the other hand, persistency is defined as the slope of the decreasing phase of the lactation curve, referring to the duration of time for which the peak yield is maintained (Wood, 1967). Peak yield and persistency are the only variables of the lactation curves that can be influenced by a variety of factors, although the general shape of the curve remains mostly unchanged. A number of dif-ferent empirical models have been developed to explain the shape of lactation curves
(Gipson and Grossman, 1989; Wood, 1976). Among these, the use of analytical time func-tions allows the partition of the variability of daily milk yield into i) a regular and continu-ous component, and ii) a stochastic compo-nent (Beever et al., 1991; Sherchand et al., 1995; Grossman and Koops, 1998). Knowledge regarding the shape of lactation curves enables the prediction of total lactation milk yield based on data from a single test day (Wood, 1976) or several test days at the begin-ning of the lactation period. Therefore, such knowledge represents a valuable tool for deci-sion-making in breeding and selection proce-dures.
The Wood model has been used in most lac-tation curve model studies, for reason that it includes the basic features of lactation curves with only the three parameters beginning yield (a), coefficient of rising (b) and coefficient of decreasing (c), which allow the calculation of average yield, peak yield and peak time, respectively. This feature has allowed the Wood model to become the most widely used function for describing lactation curves (Wood, 1967; Papajcsik and Bodero, 1988). Most alter-native models are also based on the Wood model (Wilmink, 1987; Papajcsik and Bodero, 1988). The model is appreciated for its simplic-ity and accuracy in describing the lactation curve. The Wood model is used worldwide by animal scientists to describe the lactation curves of cattle, buffalo and other farm ani-mals (Kawata, 2011). The parameters of Wood’s function define the shape of the lacta-tion curve, and thus enable the estimalacta-tion of milk yield in a particular stage of lactation as well as the persistency index of lactation.
Most lactation curve studies focus on
evalu-Corresponding author: Dr. Aziz Şahin, Department of Animal Science, Faculty of Agriculture, Ahi Evran University, 40100 Kırşehir, Turkey.
Tel: +90.386.2804830 - Fax: +90.386.2804832. E-mail: [email protected]
Key words: Anatolian buffaloes; Lactation curve; Persistency; Mathematical model; Wood model.
Received for publication: 26 September 204. Accepted for publication: 24 January 2015.
This work is licensed under a Creative Commons Attribution NonCommercial 3.0 License (CC BY-NC 3.0).
©Copyright A. Şahin et al., 2015 Licensee PAGEPress, Italy
Italian Journal of Animal Science 2015; 14:3679 doi:10.4081/ijas.2015.3679
ating average patterns among homogeneous groups of animals, even when individual curves are of greater interest for many practi-cal purposes (e.g., health monitoring, individ-ual feeding, genetic evaluations). While there is considerable variation in the lactation curve shapes of different animals, the individual curve fitting in dairy animals allows a better and wider goodness of fit to be obtained (Perochon et al., 1996; Olori et al., 1999; Macciotta et al., 2005). Atypical lactation curve shapes are characterized by an absence of a lactation peak, and occur in approximately 20 to 30 percent of cases (Olori et al., 1999; Rekik and Ben Gara, 2004; Macciotta et al., 2005). Lactation curves can be used to predict lacta-tion yield by using either the entire curve, or only part of the curve’s length, and also depending on the method used to describe the underlying curve. Based on the information they provide, lactation curves can be used as tools for the selection of breeding herds, and for evaluating the current level of lactation in herds. Until now, there have been only a limit-ed number of studies in Turkey regarding the characteristics of different breeds of buffalo.
In this context, this study intends to deter-mine the lactation curve characteristics of Anatolian buffaloes by using the Wood model.
Materials and methods
Location of experiment
This study was performed in the Tokat province of the Central Black Sea Region of Turkey. The province of Tokat is located between the 35° 27’ and 37° 39’ East longi-tudes, and the 39° 52’ and 40° 55’ North lati-tudes. The province has a transitional climate between the Black Sea marine climate and the Anatolian continental climate. The long-term mean annual temperature varies between 8.1 to 14.2°C, while the mean relative moisture varies between 56 and 73% (MARA, 2013).
Buffalo management
The lactating buffaloes grazed outside between the months of April to December, while being kept and fed indoors through the winter. During the grazing period, the buf-faloes were allowed to graze between eight to seventeen hours (without any concentrates being fed), and kept indoors at night. The buf-faloes were fed a total mixed ration all year round. The buffaloes were mated naturally, and hand milked twice a day. Buffalo calves were fed on milk in the morning and evening, and weaned at approximately 120 days of age.
Data collection
Data collected during the study included the 4340 test days of milk yield records obtained for the lactation of 690 Anatolian buffaloes. These records were held by the Association of Animal Breeders in Tokat between 2011 and 2014. The data obtained from Anatolian buf-faloes at their 1st, 2nd, 3rd, 4th and 5thparity, with age at calving ranging from 30 to 48, 36 to 60 and 48 to 72 months. Number of test-day records per lactation varied from 5 to 10. The test-day milk records were obtained from monthly milk yield samples, collected on the morning and evening of every fifteenth day of each month. The test-day milk records were recorded using kilogram as units. Information about pedigree, date of birth, date of calving, type of birth and sex of the born calves were obtained from registers maintained for man-agement purposes. Lactations were grouped according to lactation number, with a total of five groups being formed. Further edits involved the removal of records of milk yield sampled earlier than the 5th
postpartum day, in which case the subsequent milk sample was considered as the first test day sample. The study data was obtained from the buffaloes in their first, second, third, fourth and fifth parity. All buffaloes were milked twice a day. To define the lactation curves, the daily milk yield data was obtained for buffaloes whose first five or more control yields were known. Records involving a lactation length of <150 days, a calving interval <300 or >700 days, abortion, and other pathological causes known to affect lactation yield were considered as abnormal, and hence excluded from the study (Tekerli et al., 2001; Cruz et al., 2009; Torshizi et al., 2011). The editing of the records resulted in a considerable loss of data. The record for a buf-falo was excluded in case i) the lactation num-ber is missing, ii) a buffalo was controlled less than five consecutive times during the whole lactation length of 275 days, iii) the interval from the date of freshening to the first test-day date is less than 5 days, and iv) the test-day production is unreasonable (a test-day yield less than 1 kg or greater than 20 kg). Following the editing process, 3830 records remained. The data comprised 899 first, 777 second, 736 third, 718 fourth and 700 fifth lactations of 690 Anatolian buffaloes.
The current milk recording scheme in Turkey is generally based on the monthly supervision of dairy herds. Although daily weighing is the most appropriate method for recording the quantity of milk (in order to then calculate the total lactation milk yield), this recording method is very time consuming and costly, especially when the size of the dairy
herd in large (Wood, 1976; Farhangfar and Rowlinson, 2007). For this reason, in many countries, the record for each test day is taken regularly at monthly intervals.
Statistical analysis
The database was first built in Microsoft Excel and then imported into Statistica 5.0. V (1995) for the modeling, graphing and fitting of the lactation curves. Milk yield was recorded on a monthly basis, and throughout the lacta-tion period, the lactalacta-tion milk yield (LMY) was calculated using the Trapez method (Koyuncu et al., 2002; Berger and Thomas, 2013). The data regarding milk production on day 5 (X1),
35 (X2), 65 (X3), 95 (X4), 125 (X5), 155 (X6),
185 (X7), 215 (X8), 245 (X9) and 275 (X10) were
recorded, along with the milk production level for all lactations (ICAR, 2008). The LMY and lactation length (LL) were calculated using the equations below. To determine LL:
LL=[na-[(a/2-A)] To determine the LMY:
where: CD is calving date, DD is drying date, n is the number of milk yield controls, a is the control period, A and A’ are consecutive milk control dates, k and k’ is milk yield in consecu-tive controls.
The mathematical expression of the lacta-tion curve is called the biometry of lactalacta-tion. Wood (1967) previously examined the varia-tions in daily milk yield. In present study, lac-tation curve shapes were analyzed by fitting individual curves into the Wood model (Wood, 1967), which has been widely used by many researchers (Macciotta et al., 2005; Farhanghfar and Rowlinson, 2007; Jeretina et al., 2013). In this context, the following statis-tical model was employed:
Yt:atbexp(-ct)
where t represents the day of milking, yt
rep-resents the daily milk yield on day t of lacta-tion, a is the general scaling factor represent-ing initial yield, and b and c are the factors associated with the inclining and declining slope of the lactation curves, respectively. Parameters a, b and c were initially estimated by fitting the Wood’s function into the log-lin-ear form.
The gamma model of Wood (1967) was transformed logarithmically into a linear form,
and was fitted to the monthly recorded milk yields:
ln(Yt)_ln(a)+b[ln(n)]-cn
Atypical lactations with negative b or c parameters, as well as herds with less than two buffaloes were excluded from the study data. The remaining lactations that were typical according to Wood s description were then analyzed using non-linear regression in accor-dance with the NLIN procedure and the Levenberg Marquardt iterative method of Statistica 5.0. V (1995). In this method, the iteration algorithm was used for the solution, with a converge criterion of 1E-0.8. In order to reduce number of iterations required to reach the solution, results from the literature and previous analyses of data were used for the ini-tial values of the parameters. Therefore, esti-mations were made for the a, b, c values of the gamma model. The lactation curve parameters obtained from the linearized form were used as the starting grids. In addition, the individ-ual buffalo lactation curve parameters obtained through non-linear regression were used to calculate the peak time.
The gamma function described the lactation curve using the mean of the predicted yield, the difference between the predicted and lacta-tion milk yield, the coefficient of determina-tion R2
, and the respective standard errors. To evaluate the effects of such factors as parity and age, the analysis of variance for the gamma function parameters was performed using the fixed-effect multiple regression model. The data was classified into the five lac-tation groups, and the mean scores were com-pared using Duncan’s multiple range test). The following statistics were calculated follow-ing the fittfollow-ing of the curve: S was calculated as:
S:-(b+1)ln(c)
The maximum daily milk yield (Ymax) was
calculated as:
Ymax: a(b/c)be–b
The time of maximum milk yield (Tmax)
was calculated as:
Tmax:b/c
The correlation coefficients were obtained from the curve components, and all statistical analysis techniques were performed using the SPSS 17 software (2009). The parameters of Wood’s model were estimated using non-linear regression, and by fitting the individual
curves. If both the b and c parameters were negative, the lactation curve had a concave shape; on the other hand, if parameter b was negative and parameter c was positive, the lac-tation curve had a negative slope (decreasing type). After fitting the model, the parameters were estimated. The parameters of Wood’s model were used to draw the lactation curve of Anatolian buffaloes, and to determine their shape.
Results and discussion
Lactation milk yield and lactation
length
The mean LMY was determined as 695 kg, with the LMY values ranging between 509 and 825 kg for the 1st
, 2nd , 3rd
, 4th , 5th
and all lacta-tions. This result is lower than the ones report-ed by İzgi and Asker (1988), Afzal et al. (2007), Özenc et al. (2008), Şekerden (2011), and higher than the ones reported by Sahin and Ulutas (2014). The mean LL was 152 days. The findings of our study were in agreement with the results of Sahin and Ulutas (2014). Our LL value was lower than the one determined by Afzal et al. (2007), who had reported an LL of 273 days. The differences between our results and those of other researchers could be associ-ated with differences in climate and manage-ment, and/or to genetic differences between the herds.
Type of lactation curves
The shapes of the obtained lactation curves are shown in Figure 1. As shown in the Figure 1, the average TDMY increased from the beginning of lactation towards the peak time, and then decreased gradually towards the end of lactation. This indicates that the milk yield of an Anatolian buffalo changes during the
course of the lactation. In this study, parame-ters relating to the lactation curves were calcu-lated using the Gamma model developed by Wood (1967). Among the 690 different lacta-tion records that were evaluated, 406 (58.84%) were typical curves, while 90 (13.04%) were concave curves and 194 (28.12%) were decreasing type curves. In the current study, the ratio of atypical lactation curves was 41.16% for Anatolian buffaloes reared under varying conditions in the province of Tokat. Of the atypical lactation curves, 68.30% were decreasing type curves, while 31.69% were concave types curves. This observation is inconsistent with the results reported by Kaygısız (1999b) for Holstein cattle (42%). On the other hand, Kaygısız (1999a) had reported that 60% of atypical lactation curves were of the decreasing type, while 40% were of the concave type. These values were higher than those previously determined for Anatolian buf-falo by Kaygısız (1999a) and for Holstein cattle by Rekik and Ben Gara (2004). On the other hand, Tekerli et al. (2000) reported that atypi-cal curves represented 26.3% of a total of 1278 completed lactations. The fact that the ratio of buffaloes with typical lactation curves is high-er than the ratio of buffaloes with atypical lac-tation curves can be considered as a positive sign for dairy farms, since such ratios indicate higher milk yields. However, different studies on buffaloes have report different percentages of atypical lactation. Mansour et al. (1992) reported that 3.5% of Egyptian buffaloes had atypical lactation curves, while the ratio of atypical lactation for Pakistan Nili Ravi buf-faloes was reported as 4.6% (Khan and Gondal, 1996).
Atypical curves were assumed to be associ-ated with buffaloes that exhibited various data-related problems, such as the lack of information, erroneous data or management problems. The occurrence of atypical shapes,
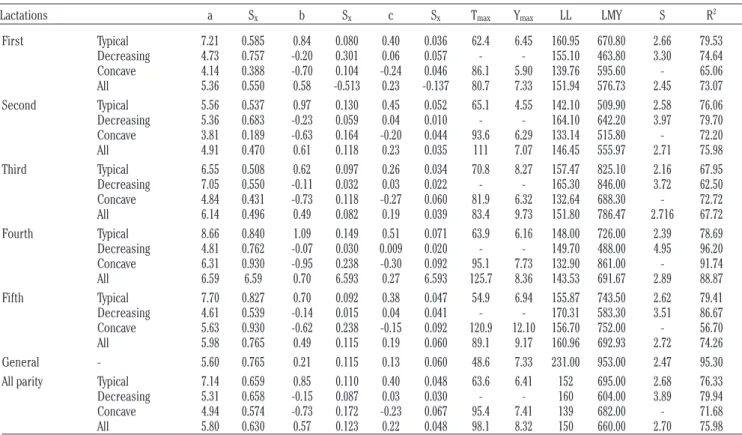
Table 1. Parameters and standard errors of lactation curve traits according to lactation number.
Lactations a Sx b Sx c Sx Tmax Ymax LL LMY S R2
First Typical 7.21 0.585 0.84 0.080 0.40 0.036 62.4 6.45 160.95 670.80 2.66 79.53 Decreasing 4.73 0.757 -0.20 0.301 0.06 0.057 - - 155.10 463.80 3.30 74.64 Concave 4.14 0.388 -0.70 0.104 -0.24 0.046 86.1 5.90 139.76 595.60 - 65.06 All 5.36 0.550 0.58 -0.513 0.23 -0.137 80.7 7.33 151.94 576.73 2.45 73.07 Second Typical 5.56 0.537 0.97 0.130 0.45 0.052 65.1 4.55 142.10 509.90 2.58 76.06 Decreasing 5.36 0.683 -0.23 0.059 0.04 0.010 - - 164.10 642.20 3.97 79.70 Concave 3.81 0.189 -0.63 0.164 -0.20 0.044 93.6 6.29 133.14 515.80 - 72.20 All 4.91 0.470 0.61 0.118 0.23 0.035 111 7.07 146.45 555.97 2.71 75.98 Third Typical 6.55 0.508 0.62 0.097 0.26 0.034 70.8 8.27 157.47 825.10 2.16 67.95 Decreasing 7.05 0.550 -0.11 0.032 0.03 0.022 - - 165.30 846.00 3.72 62.50 Concave 4.84 0.431 -0.73 0.118 -0.27 0.060 81.9 6.32 132.64 688.30 - 72.72 All 6.14 0.496 0.49 0.082 0.19 0.039 83.4 9.73 151.80 786.47 2.716 67.72 Fourth Typical 8.66 0.840 1.09 0.149 0.51 0.071 63.9 6.16 148.00 726.00 2.39 78.69 Decreasing 4.81 0.762 -0.07 0.030 0.009 0.020 - - 149.70 488.00 4.95 96.20 Concave 6.31 0.930 -0.95 0.238 -0.30 0.092 95.1 7.73 132.90 861.00 - 91.74 All 6.59 6.59 0.70 6.593 0.27 6.593 125.7 8.36 143.53 691.67 2.89 88.87 Fifth Typical 7.70 0.827 0.70 0.092 0.38 0.047 54.9 6.94 155.87 743.50 2.62 79.41 Decreasing 4.61 0.539 -0.14 0.015 0.04 0.041 - - 170.31 583.30 3.51 86.67 Concave 5.63 0.930 -0.62 0.238 -0.15 0.092 120.9 12.10 156.70 752.00 - 56.70 All 5.98 0.765 0.49 0.115 0.19 0.060 89.1 9.17 160.96 692.93 2.72 74.26 General - 5.60 0.765 0.21 0.115 0.13 0.060 48.6 7.33 231.00 953.00 2.47 95.30 All parity Typical 7.14 0.659 0.85 0.110 0.40 0.048 63.6 6.41 152 695.00 2.68 76.33 Decreasing 5.31 0.658 -0.15 0.087 0.03 0.030 - - 160 604.00 3.89 79.94 Concave 4.94 0.574 -0.73 0.172 -0.23 0.067 95.4 7.41 139 682.00 - 71.68 All 5.80 0.630 0.57 0.123 0.22 0.048 98.1 8.32 150 660.00 2.70 75.98
a, beginning yield; Sx, standard deviation of x; b, coefficient of rising; c, coefficient of decreasing; Tmax, time after parturition when peak yield occurs; Ymax, maximum daily peak yield; LL, lactation length; LMY, lactation milk yield; S, persistency; R2, coefficient of determination.
characterized by the absence of a lactation peak, is reported to occur in about 15-42% of buffaloes (Rekik et al., 2003; Soysal et al., 2005; Atashi et al., 2009; Boujenane and Hilal, 2012). However, Shanks et al. (1981) reported a lower proportion of 840 atypical lactations among 113,705 lactations.
In terms of values, the curve using all lacta-tions and the typical lactation curves were very similar to one another (Figure 1), indicating that most lactations in dairy farms/businesses are typical (in other words, have typical lacta-tion curves). Concave and descending type curves tended to decrease gradually starting from the beginning of lactation. Buffaloes with concave and descending type lactation curves produce lower quantities of milk.
Lactation curve parameters and
characteristics
The values for the model parameters, which depended on the shape of the lactation curves, are provided in Table 1. The lactation curve shapes were determined by identifying the curve type based on the curve parameter val-ues a, b and c.
The coefficients of determination R2 indi-cated that the factors studied in all parities
accounted for 75.98% of total variation. The coefficient of determination (R2
), which is an indication of the model’s fit to the structure of the available data, was determined in our study as 76.33±0.50% for typical lactation. Thus, it is possible to state that the determina-tion of coefficient sufficiently explained the variances of the lactation curves. The values/percentages reported by other researchers varied between 49.0 and 72.0% (Kaygısız, 1999a). A large coefficient of deter-mination indicates the ability of the independ-ent variable and the model to describe the dependent variable. In this study, the mean coefficient of determination values were lower than the values of 99.1%, 99.8%, 68.1%, 70.3% and 61.0% reported by Kumar et al. (1992).
As it can be seen in Table 1; the parameter a values (indicating the starting milk yield) for all lactation curves, typical lactation curves, concave lactation curves and decreasing lacta-tion curves were determined as 5.80, 7.14, 4.94 and 5.31, respectively.
The a parameter values of Wood’s model in the 1st, 2nd, 3rd, 4th, 5thand all lactations were estimated 7.21, 5.56, 6.55, 8.66, 7.70 and 7.14, respectively. These results were consistent with findings of Elahi Torshizi et al. (2011),
who reported the value for this parameter as 4.98. These results are lower than the values reported in certain studies (Barbosa et al., 2007; Anwar et al., 2009), while other studies have reported higher values (Kaygısız, 1999; Coletta et al., 2007; Jeretina et al., 2013; Şahin et al., 2014). Using the Wood model, Aziz et al. (2006) reported parameter estimates varying between 29.92 and 49.23 from the 1st
to the 10th lactation. On the other hand, Orman et al. (2000) reported with the Wood model parame-ter estimates between 4.99 and 10.76 from the 1st
to 5th
lactation.
The b parameter values of the Wood model for five and all parities were estimated as 0.84, 0.97, 0.62, 1.09, 0.70 and 0.85, respectively.
The parameter b values (which represent the coefficient of rising in all lactations) for all lactation curves, typical lactation curves, con-cave lactation curves and decreasing lactation curves were determined as 0.538, 0.85, 0.73 and 0.15, respectively. This result is similar with the findings of Kaygısız (1999a) who reported b parameter estimates between 0.49 and 0.86 from the 1stto the 6th lactation by the Wood Model. Using the Wood Model, Elahi Torshizi et al. (2011) reported b parameter estimates between 0.184 and 0.218, while and
Jeretina et al. (2013) reported b parameter estimates between 0.179 and 0.193. These results are higher than those reported by Anwar et al. (2009) and Şahin et al. (2014). Coletta et al. (2007) reported b parameter esti-mates to be between 0.25 and 0.36 by the Wood Model.
Based on the Wood model, the c parameter values for the 1st
, 2nd , 3rd
, 4th , 5th
and all parities were determined as 0.40, 0.45, 0.26, 0.51, 0.38 and 0.40, respectively. The parameter c values (which represent the coefficient of decreas-ing) for all lactation curves, typical lactation curves, concave lactation curves and decreas-ing lactation curves were determined as 0.226, 0.404, 0.234 and 0.039, respectively.
This result is higher than the values report-ed by certain studies (Kaygısız, 1999a; Barbosa et al., 2007; Coletta et al., 2007; Anwar et al., 2009; Jeretina et al., 2013; Şahin et al., 2014), while lower values have been reported in the study of Aziz et al. (2006). Elahi Torshizi et al. (2011) similarly reported a lower value of 0.002, while Patel and Vataliya (2011) reported lower values ranging from 0.023 to 0.035 for the 1st
, 2nd and >3rd
lactations. The c parameter
estimates reported by Anwar et al. (2009) was 0.038. For higher milks yields, higher values for parameters a and b and lower parameter c values are desirable. Parameter a had similar values in the all curves, typical curves and decreasing curves, while parameter b was pos-itive only in the all and typical lactation curves. These values indicated that buffalo with typical lactation curves provide higher milk yields.
In this study, the S (persistency), Tmax(time
after parturition when peak yield occurs) and Ymax(maximum daily peak yield) and R2
(coef-ficient of determination) values for typical lac-tations were determined as 2.68, 63.6 and 6.41, respectively. While the persistency values in present study were lower than some of the val-ues reported previously in the literature (Kaygısız, 1999a; Tekerli et al., 2001), they were similar to the values reported by Çilek et al. (2008) and Keskin et al. (2009). While the Ymaxvalue in our study was higher than the
value reported by Kaygısız (1999a), it was con-sistent with the value determined by Tekerli et al. (2001). In this study, the calculated Tmax
value for typical lactations was lower than the value reported by Kaygısız (1999a), yet similar
to the value determined by Tekerli et al. (2001).
The lactation curve parameters that were calculated in this study for buffalo herds were higher than those determined in previous studies, which may be attributed to the fact that the buffaloes in our study were raised in different environmental conditions, and/or that herd management for the studied buf-faloes was being performed correctly in terms of milk production (Kaygısız, 1999a).
Correlations between parameters
and characteristics
In this study, the correlations between the lactation curve parameters (a, b, c), Tmax, Ymax,
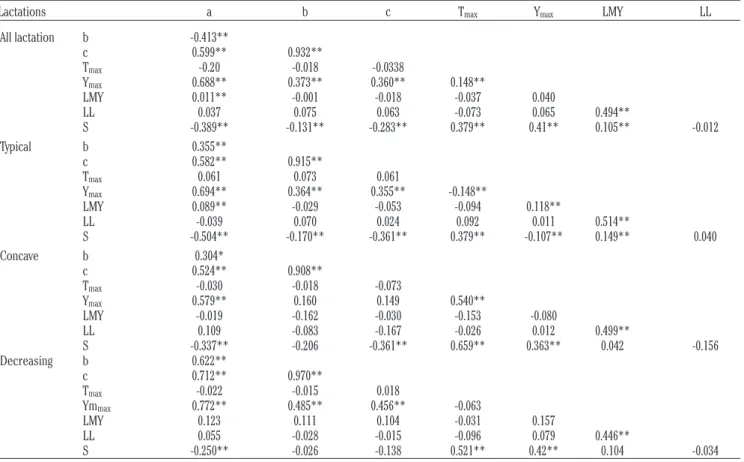
S, LL and LMY were evaluated and determined. The relevant results relating to these correla-tions are provided in Table 2. In all lactacorrela-tions and typical lactation curves, statistically signif-icant correlations (P<0.01) were identified between parameter a and the parameters b, c, Ymax, LMY and S; between parameter b and the
parameters c, Ymaxand S; between parameter c
and the parameters Ymax and S; between
parameter Tmaxand the parameters Ymax and S;
Table 2. Correlations among lactation curve parameters.
Lactations a b c Tmax Ymax LMY LL
All lactation b -0.413** c 0.599** 0.932** Tmax -0.20 -0.018 -0.0338 Ymax 0.688** 0.373** 0.360** 0.148** LMY 0.011** -0.001 -0.018 -0.037 0.040 LL 0.037 0.075 0.063 -0.073 0.065 0.494** S -0.389** -0.131** -0.283** 0.379** 0.41** 0.105** -0.012 Typical b 0.355** c 0.582** 0.915** Tmax 0.061 0.073 0.061 Ymax 0.694** 0.364** 0.355** -0.148** LMY 0.089** -0.029 -0.053 -0.094 0.118** LL -0.039 0.070 0.024 0.092 0.011 0.514** S -0.504** -0.170** -0.361** 0.379** -0.107** 0.149** 0.040 Concave b 0.304* c 0.524** 0.908** Tmax -0.030 -0.018 -0.073 Ymax 0.579** 0.160 0.149 0.540** LMY -0.019 -0.162 -0.030 -0.153 -0.080 LL 0.109 -0.083 -0.167 -0.026 0.012 0.499** S -0.337** -0.206 -0.361** 0.659** 0.363** 0.042 -0.156 Decreasing b 0.622** c 0.712** 0.970** Tmax -0.022 -0.015 0.018 Ymmax 0.772** 0.485** 0.456** -0.063 LMY 0.123 0.111 0.104 -0.031 0.157 LL 0.055 -0.028 -0.015 -0.096 0.079 0.446** S -0.250** -0.026 -0.138 0.521** 0.42** 0.104 -0.034
a, beginning yield; b, coefficient of rising; c, coefficient of decreasing; Tmax, time after parturition when peak yield occurs; Ymax, maximum daily peak yield; LMY, lactation milk yield; LL, lactation length; S, persistency. *P<0.05;; **P<0.01.
between parameter Ymaxand parameter S; and
between parameter LMY and the parameters LL and S. In typical lactation curves, the corre-lations between parameter Ymax and the
parameters Tmax and S were determined to be
significant.
In concave lactation curves, statistically sig-nificant correlations (P<0.01) were identified between parameter a and the parameters b, c, Ymaxand S; between parameter b and
parame-ter c; between parameparame-ter c and parameparame-ter S; between parameter Tmaxand the parameters
Ymax and S; between parameter Ymax and
parameter S; and between parameter LMY and parameter LL. In the decreasing lactation curves of the current study, statistically signif-icant correlations (P<0.01) were identified between parameter a and the parameters b, c, Ymax and S; between parameter b and the
parameters c and Ymax; between parameter c
and parameter Ymax; between parameter Tmax
and parameter S; and between parameter LMY and parameter LL.
In this study, the calculated correlations were very close to the values reported in liter-ature (Kaygısız, 1999a). Taking into account the typical lactation curves (which are consid-ered to be the ideal type of curve), a negative and statistically significant relationship (P<0.01) was identified between parameters a and b, while the relationship between parame-ters a and c was identified as being positive and statistically significant (P<0.01).
Based on the statistically significant (P<0.01) and negative correlation between parameter a and parameters Tmax, S and b, it is
possible to state that buffaloes with higher ini-tial milk yields took longer to achieve their maximum daily milk yields, and demonstrated a lower level of persistence. Based on the high and positive correlation between parameter a and parameter Ymax, it is possible to state that
buffaloes with higher initial milk yields achieved higher maximum daily milk yields, and consequently had high lactation milk yields. As long as the milk yields remain high, a buffalo will be kept in lactation for longer periods by the dairy farm, meaning that its lac-tation period will be longer. In sum, it is possi-ble to state that buffaloes with higher initial milk yields take longer to achieve their maxi-mum yields, and that the maximaxi-mum yields of these buffaloes are comparatively lower. A neg-ative and statistically significant (P<0.01) cor-relation between persistency (S) and parame-ters a, b and c indicated that the increase and decrease in milk yields would be slower in high persistency buffaloes. In this study, a negative correlation was identified between S and Ymax,
while a positive correlation was identified
between S and Tmax, indicating that buffaloes
with higher S values take longer to reach their maximum yields due to a slower curve. The presence of a positive and statistically signifi-cant correlation between lactation milk yield and parameters a and Ymax indicated that
buf-faloes with higher initial milk yields would have higher Ymax values, and hence higher
milk yields. The positive correlation between the lactation period and the LMY milk yield indicated that an increase in lactation period would lead to an increase also in the LMY milk yield. A reduced typical character (or an increasing atypical character) of lactation curves may result from a combination of fac-tors, such as the persistency values, the way in which the herd is managed and taken care of, the feeding of the buffaloes, and the buffaloes’ health, and may affect the lifetime productivity of buffaloes. A preference for more persistent buffaloes with standard lactation curves dur-ing selection can be a useful and effective approach to breeding, depending on the model parameters being used. In other words, in cases where the pedigrees of buffaloes in a herd are not known, the parameters calculated by taking environmental factors into account can be used as selection criteria. The shape of the lactation curve is one such criteria (along with total or lactation milk yield) that can be considered in the assessment of buffalo milk yield. As buffaloes with typical lactation curves provide higher milk yields, they should be pre-ferred during animal selection and elimination activities.
The mean milk yield values of Anatolian buf-faloes with decreasing (604 kg) and concave type (682 kg) lactation curves were 13 and 2% lower, respectively, than the mean milk yield value of buffaloes with typical lactation curves (695 kg). It was similarly reported that the mean milk yield value of buffaloes with atypi-cal lactation curves was 5-6% lower than the mean milk yield value of buffaloes with typical lactation curves (Kaygısız, 1999a; Yılmaz and Kaygısız, 2000).
The phenotypic correlation between param-eter a and Tmaxand the correlation between
parameter a and persistency were negative and medium-level, while the correlation between parameter a and Ymax was positive
and high. Buffaloes starting lactation with higher milk yields thus exhibited higher max-imum daily milk yield, although they also had lower persistency. In this study, the phenotypic correlation between Ymaxand Tmaxwas
nega-tive and low for both typical and decreasing curves.
In previous studies (Atashi et al., 2009; Seangjun et al., 2009), the correlation between
Ymax and Tmax was reported as negative,
indi-cating that buffaloes with higher daily milk yield reached their maximum daily milk yield earlier.
Therefore, buffaloes which have a higher initial production, higher peak milk, and decline at a slower rate will also have a high LMY. On the other hand, Farhangfar and Rowlinson (2007) found it equal to zero. In our study, a positive correlation was calculated between Ymaxand Tmax. Ymaxhad high and
pos-itive genetic correlation with LMY, indicating that increasing Ymax will lead to an increase in
LMY as well.
Conclusions
In conclusion, the mean values of milk yield for buffaloes with typical lactation curves (695 kg) were higher than the mean values of milk yield for buffaloes with atypical (decreasing and concave) lactation curves. Indirect selec-tions in buffalo herds based on typical lacta-tion curves (in which all parameters are posi-tive) could facilitate and contribute positively to the management of the herd. In addition, the yield level of the herd can also be improved by excluding buffaloes with atypical lactations from the herd. Such a herd selection approach can be performed by using the female Anatolian buffaloes with typical lactation curves.
References
Afzal, M., Anwar, M., Mirza, M.A., 2007. Some factors affecting milk yield and lactation length in Nili Ravi buffaloes. Pak. Vet. J. 27:113-117.
Anwar, M., Cain, P.J., Rowlinson, P., Khan, M.S., Muhammad, A., Babar, E.M., 2009. Factors affecting the shape of the lactation curve in Nili-Ravi buffaloes in Pakistan. Pak. J. Zool. 9:201-207.
Atashi, H., Moradi Sharbabak, M., Moradi Sharbabak, H., 2009. Environmental fac-tors affecting the shape components of the lactation curves in Holstein dairy cattle of Iran. Available from: http://www.lrrd.org/ lrrd21/5/atas21060.htm
Aziz, M.A., Shalaby, N.A., El-Shafie, O.M., Mahdy, A.T., Nishida, A., 2006. Comparison between the shapes of lactation curve of Egyptian buffalo milk yield estimated by the incomplete gamma function and a new model. Available from: http://www.lrrd.org/
lrrd18/5/aziz18059.htm
Barbosa, S.B.P., Pereira, R.G.A., Santoro, K.R., Batista, A.M.V., Ribeira Neto, A.C., 2007. Lactation curve of cross-bred buffalo under two production systems in the Amazonian region of Brazil. Ital. J. Anim. Sci. 6(Suppl.2):1075-1078.
Beever, D.E., Rook, A.J., France, J., Dhanoa, M.S., Gill, M., 1991. A review of empirical and mechanistic models of lactational per-formance by the dairy cow. Livest. Prod. Sci. 29:115-130.
Berger, Y.M., Thomas, D.L., 2013. Milk testing, calculation of milk production and adjust-ment factors. pp 55-63 in Proc. of 10th Great Lakes Dairy Sheep Symp., Hudson, WI, USA.
Borghese, A., 2005. Buffalo production and research. FAO Regional Office for Europe Inter‐Regional Cooperative Research Network On Buffalo (Escorena), Rome, Italy.
Boujenane, I., Hilal, B., 2012. Genetic and non genetic effects for lactation curve traits in Holstein-Friesian cows. Available from: h t t p : / / a r c h a n i m b r e e d . f b n -dummerstorf.de/pdf/2012/at12p450.pdf Çilek, S., Keskin, İ., İlhan, F., Şahin, E.H., 2008.
Lactation curve traits of Brown Swiss cat-tle reared at Ulaş state farm in Turkey. pp 703-706 in Proc. 7th Int. Symp. Anim. Biol. Nutr., Bucharest, Romania.
Coletta, A., Caso, C., Castrillo, M., Parlato, M., Zullo, A., Zicarelli, L., 2007. Fit of the Wood function to milk yield data collected by dif-ferent recording systems in Mediterranean Italian buffalo. Ital. J. Anim. Sci. 6(Suppl.1):503-505.
Cruz, G.R.B., Ribeiro, M.N., Filho, E.C.P., 2009. Estimates of lactation curve parameters of cattle. Arch. Zootec. 58:695-704.
Elahi Torshizi, M., Aslamenejad, A.A., Nasirsi, M.R., Farhangfar, H., 2011. Comparison and evaluation of mathematical lactation curve functions of Iranian primiparous Holsteins. South Afr. J. Anim. Sci. 41:104-115.
Epaphras, A., Karimuribo, E.D., Msellem, S.N., 2004. Effect of season and parity on lacta-tion of crossbred Ayrshire cows reared under coastal tropical climate in Tanzania.
Available from:
http://www.lrrd.org/lrrd16/6/epap16042.ht m
Farhangfar, H., Rowlinson, P., 2007. Genetic analysis of Wood’s lactation curve for Iranian Holstein heifers. J. Biol. Sci. 7:127-135.
Gipson, T.A., Grossman, M., 1989. Diphasic analysis of lactation curves in dairy goats.
J. Dairy Sci. 72:1035-1044.
Grossman, M., Koops, W.J., 1998. Multiphasic analysis of lactation curves in dairy cattle. J. Dairy Sci. 78:2507-2513.
ICAR, 2008. International agreement of record-ing practices. Approved by the General Assembly held in Niagara Falls, USA, on 18 June 2008. International Committee for Animal Recording, Rome, Italy.
İzgi, A.N., Asker, R., 1988. Mandalarda doğum mevsimi ve ilkine doğurma yaşının lakta-syon süresi ve süt verimi üzerine etkileri. Mandacılık Araştırma Enstitüsü, Afyon, Turkey.
Jeretina, J., Babnik, D., Škorjanc, D., 2013. Modeling lactation curve standards for test-day milk yield in Holstein, Brown Swiss and Simmental cows. J. Anim. Plant Sci. 23:754-762.
Kawata, Y., 2011. Lactation curves of dairy ani-mals. An interim literature review. Available from: http://ir.obihiro.ac.jp/ dspace/handle/10322/3113
Kaygısız, A., 1999a. Lactation curve traits of native buffaloes. J. Agr. Sci. 5:1-8. Kaygısız, A., 1999b. Lactation curve traits of
Simmental cattle’s. Turk. J. Vet. Anim. Sci. 23:15-23.
Keskin, İ., Çilek, S., İlhan, F., 2009. Lactation curve traits of Holstein cows raised at Polatlı state farm. Kafkas Univ. Vet. Fak. 15:437-442.
Khan, M.S., Gondal, K.Z., 1996. Factors affect-ing lactation curve of Nili Rawi buffaloes. pp 55-59 in Proc. Nat. Seminar in Stat. Appl. Agric. Ind., Faisalabad, Pakistan. Koyuncu M., Tuncel, E., Duru, S., 2002.
Büyükbaş Hayvan Yetiştirme (Uygulama). Uludag University, Bursa, Turkey. Kumar, D., Sharma, O.P., Manglik, V.P., 1992. A
stochastic model to describe the milk yield buffaloes. Indian J. Dairy Sci. 62:591-592. Macciotta, N.P.P., Vicario, D., Cappio-Borlino,
A., 2005. Detection of different shapes of lactation curve for milk yield in dairy cattle by empirical mathematical models. J. Dairy Sci. 88:1166-177.
Mansour, H., Soliman, A.I., Abd El Hafiz, G.A., 1992. Factors affecting lactation curve of buffaloes in upper Egypt. pp 224-237 in Proc. Int. Symp. Prospects of Buffalo Production in Mediteranean/Middle East, Cairo, Egypt.
MARA, 2013. The master plan of Tokat province, Tokat. Ministry of Agriculture and Rural Affairs, Istanbul,Turkey. Olori, V.E., Brotherstone, S., Hill, W.G.,
McGuirk, B.J., 1999. Fit of standard models of the lactation curve to weekly records of milk production of cows in a single herd.
Livest. Prod. Sci. 58:55-63.
Orman, M.N., Ertuğrul, O., Cenan, N., 2000. Fitting lactation curves of South Anatolian red cattle. Lalahan Hay. Araş. Enst. Derg. 40:17-25.
Özenç E., Vural, M.R., Şeker, E., Uçar, M., 2008. An evaluation of subclinical mastitis dur-ing lactation in Anatolian buffaloes. Turk. J. Vet. Anim. Sci. 32:359-368.
Papajcsik, I.A., Bodero, J., 1988. Modelling lac-tation curves of Friesian cows in a sub-tropical climate. Anim. Prod. 47:201-207. Patel, A.C., Vataliya, P.H., 2011. Study of
lacta-tion curve in Holstein Friesian cattle on an organized farm. Available from: http://www.wayambajournal.com/paper.ph p?n=1324127910
Perochon, L., Coulon, J.B., Lescourret, F., 1996. Modelling lactation curves of dairy cows with emphasis on individual variability. Anim. Sci. 63:120-189.
Rekik, B., Ben Gara, A., 2004. Factors affecting the occurrence of atypical lactations for Holstein-Friesian cows. Livest. Prod. Sci. 87:240-245.
Rekik, B., Ben Gara, A., Ben Hamouda, M., Hammami, H., 2003. Fitting lactation curves of dairy cattle in different types of herds in Tunisia. Livest. Prod. Sci. 83:309-315.
Şahin, A., Ulutas, Z., 2014. Some environmen-tal factors effect on milk yield estimated with different methods in Anatolian buf-faloes. Kafkas Univ. Vet. Fak. 20:79-85. Şahin, A., Ulutas, Z., Yıldırım, A., Aksoy, Y.,
Genç, S., 2014. Comparison of different lactation curve models of Anatolian buf-faloes. Kafkas Univ. Vet. Fak. 20:847-855. Seangjun, A., Koonawootrittriron, S., Elzo,
M.A., 2009. Characterization of lactation patterns and milk yield in a multibreed dairy cattle population in the Central Thailand. Kasetsart J. Nat. Sci. 43:74-82. Şekerden, Ö., 2001. Büyükbaş Hayvan
Yetiştirme (Manda Yetiştiriciliği). Temizyürek Ofset Matbaacılık, Antakya, Turkey.
Şekerden, Ö., 2011. Factors affecting somatic cell counts and their relations with milk and milk constituent yield in Anatolian and F1 Anatolian x Italian crossbred buf-faloes. J. Anim. Prod. 52:9-16.
Shanks, R.D., Berger, P.J., Freeman, A.E., Dickinson, F.N., 1981. Genetic aspects of lactation curves. J. Dairy Sci. 64:1852-1860.
Sherchand, L., McNew, R.W., Kellog, D.W., Johnson, Z.B., 1995. Selection of a mathe-matical model to generate lactation curves using daily milk yields of Holsteins cows.
J. Dairy Sci. 71:1598.
Soysal, M.İ., Özkan, E., Kök, S., Tuna, Y.T., Gürcan, E.K., 2005. Genetic characteriza-tion of indigenous anatolian water buffalo breed using microsatellite DNA markers. J. Agr. Sci. 2:240-244.
SPSS, 2009. SPSS for Windows: base system user’s guide, version 17.1. SPSS Inc., Chicago, IL, USA.
Statistica, 1995. Statistica for Windows PC 5.0. Stat Soft. Inc., Tulsa, OK, USA.
Tekerli, M., Akinci, Z., Dogan, İ., Akcan., A., 2000. Factors affecting the shape of lacta-tion curves of Holstein cows from the Balikesir province of Turkey. J. Dairy Sci. 83:1381-1386.
Tekerli, M., Küçükkebapçı, M., Akalın, N.H., Koçak, S., 2001. Effects of environmental factors on some milk production traits, persistency and calving interval of Anatolian buffaloes. Livest. Prod. Sci. 68:275-281.
Torshizi, M.E., Aslamenejad, A.A., Nassiri, M.R., Farhangfar, H., 2011. Comparison and evaluation of mathematical lactation curve functions of Iranian primiparous Holsteins. South Afr. J. Anim. Sci. 41:104-115.
Wilmink, J.B.M., 1987. Adjustment of test day-milk, fat and protein yield for age, season and stage of lactation. Livest. Prod. Sci. 16:335-348.
Wood, P.D.P., 1967. Alegabreic model of the lac-tation curve in cattle. Nature 216:164-165. Wood, P.D.P., 1976. Algebraic models of the lac-tation curves for milk, fat and protein pro-duction, with estimates of seasonal varia-tion. Anim. Prod. 22:35-40.
Yılmaz, A., Ekiz, B., Soysal, M.İ., Yılmaz, İ., Yalcıntas, H., 2011. Certain carcass and meat quality characteristics of Anatolian water buffalos. pp 149-156 in Proc. Dünya Hayvan Genetik Kaynakları 8th Global Conf. on the Cons. Anim. Genet. Res. Tekirdag, Turkey.
Yılmaz, İ., Kaygısız, A., 2000. Lactation curve traits of Holstein cattle’s. J. Agr. Sci. 6:1-10.