Istanbul Bilgi University Institute of Social Sciences Department of Financial Economics
Google Trends Search Volume Index in Estimation of Istanbul Stock Market Index (BIST)
Google Trends Arama Hacim Endeksinin Borsa Istanbul Endeksi (BİST) Üstünde Testi
M. Emre BİLGİÇ
Google Trends Search Volume Index in Estimation of Istanbul Stock Market Index (BIST)
Google Trends Arama Hacim Endeksinin Borsa Istanbul Endeksi (BİST) Üstünde Testi
Submitted by M. Emre BİLGİÇ
115620017
Asst. Prof. Serda Selin Öztürk
____________________
(Dissertation Advisor)
Asst. Prof. Haluk Yener
____________________
Asst. Prof. Ender Demir
____________________
Anahtar Kelimeler:
1. Borsa veri tahmini 2. Google arama hacimleri 3. Web aramaları ile talep tahmini 4. Borsa işlem hacmi tahmini 5. Borsa İstanbul
Keywords:
1. Stock market estimation 2. Google web search data
3. Demand estimation with web data 4. Stock market transaction volume 5. Istanbul Stock Exchange Market
i
Abstract
Internet became a considerable part of our lives so fast that even for the ones who lived most
of their lives without the internet cannot imagine how the life would be without it. We shop,
plan, talk to friends/family, search for information via the internet and doing that we create a
movement (trace) that reflects our interests even when we use it anonymously.
The stock market estimation with internet data is a subject that creates motive in researchers
to observe if the sentiment or interests of the people affect stock markets and if that effect
creates a prediction possibility. Regarding Turkey financials, two works prepared with the internet data. First one is Öztürk & Çiftçi (2014) [25]
that analyzed the Twitter sentiment index
and tested the USDTRY exchange rate with past index values and found a significant relationship. The second is Gündüz & Çataltepe (2015) [26]
that analyzed the financial
magazine sentiment data and tested the past data significance on Istanbul Stock Market Index
(BIST) the result of which was a significant explanatory power of the sentiment existed.
This study is prepared with daily [Jan.2015-Oct.2016] GTSV volume data of BIST related
keywords and focuses on whether if change in the Google Trends Search Volume Index has
any significant effect on Istanbul Stock Market Index (BIST) volume data and absolute return.
The search volume of keywords found significant in the estimation of transaction volume and
ii
Özet
İnternet hayatımızın önemli etkenlerinden biri haline geldi, öyle ki hayatının önemli kısmı boyunca telefon ve internetten uzak olan kişiler için bile internetin yokluğu düşünülemez hale geldi. Bunun sebebi temel olarak internetin yoğun ve çok geniş bir bilgi kaynağı olmakla birlikte kolay erişilebilir olmasıdır. Herhangi bir bilgiye erişim gerektiğinde artık ilk iş olarak tanıdığımız birine sormak yerine arama motoruna yazmamız yeterli oluyor. Ek olarak internetin sağladığı eğlence (müzik dinleme, film izleme, online oyun platformları gibi) ve iletişim olanakları (Facebook, Twitter, Skype, Whatsapp gibi iletişim platformları) da gün geçtikçe daha çok insanın internet kullanıcısı olmasını sağlıyor.
İnternetin sağladığı olanaklar insanların ilgisini cezbederken kullanıcı sayısı da gün geçtikçe artmaktadır. Eğer bu artış bir kullanıcı sayısı grafiği ile gösterilseydi günümüzde bu sayının artış hızının dahi arttığı (ivmeli artış) gözlenebilirdi. Bu durum, bir yandan dünyayı hızlı değiştiren her gelişme gibi teknoloji ve sosyal yaşamımızın nasıl değiştiğini gözlemleme fırsatı sunuyor bizlere, diğer bir yandan aklımızdan geçenleri sorduğumuz internet platformunda düşüncelerimizin tüm dış dünya tarafından gözlemlenebilir olmasına imkan sağlıyor. Yazdıklarımız, düşündüklerimizi ifade ediş şeklimiz veya aradığımız bir şey hareketlerimizin tahmin edilebilmesi ihtimalini de beraberinde getiriyor. Bu konularda çeşitli platform verileri ile yapılan çalışmalarda geçmiş internet verileri esas alınarak yapılan tahminlerde başarılı sonuçlara ulaşılmıştır. Finans piyasaları üzerine de çok sayıda çalışma yapılmış ve etkileşimin bulunduğu doğrulanmıştır. Borsa İstanbul özelinde Gündüz ve Çataltepe (2015) tarafından yeni yapılan bir çalışma Türkiye finansal basın makalelerinin borsa üzerindeki etkisini doğruladı. Öztürk ve Çiftçi (2014)[25]
tarafından yapılan bir çalışmada da USD-TRY kuru değişiminin geçmiş Twitter mesaj verileri sentimenti ile anlamlı bir ilişkisi olduğunu ortaya çıkardı.
Burada anlatılacak çalışma dünyanın arama motoru pazarını baskılayan Google arama motorunun Borsa İstanbul‟u işaret eden anahtar kelimelerin arama hacimleri verilerini kullanarak Borsa İstanbul‟a (BİST) talebi ölçmek ve bu ölçümün borsa işlem hacmi tahmininde ne derece anlamlı sonuçlar verdiğini test etmektir. Mevcut olarak Borsa İstanbul özelinde Google arama hacim endeksi kullanılarak yapılmış bir çalışma olmadığı için, literatüre de katkı sağlayacağını umuyorum. 2015-2016 yılları verileri kullanılarak, 458 günlük veri ile yapılan regresyon çalışması sonucu t-2‟ye kadarki arama hacim değişikliklerinin borsa hacim değişikliği üzerinde anlamlı tahmin (p<0.01) niteliğinin
iii
bulunduğu gözlemlenmiştir. Benzer ilişkinin mutlak endeks getirisinde de bulunduğu doğrulanmıştır.
iv
Contents
1. Introduction ... 1
2. A Review of Past Works ... 5
3. Methodology ... 13
3.1. About Google Trends Data ... 14
3.2. Data collection process ... 17
3.3. GARCH (Generalized Autoregressive Conditional Heteroscedasticity) ... 21
4. Results ... 23
4.1. Results for ‟hisse‟ keyword ... 23
4.2. Results for „borsa istanbul‟ keyword ... 25
4.3. Results for ‟bist‟ keyword ... 26
4.4. Results for ‟bist + borsa istanbul‟ keyword ... 27
4.5. Results for „bist + borsa istanbul + hisse‟ keyword ... 29
5. Conclusion ... 30
6. References ... 31
7. Appendix ... 36
7.1. Results for ‟hisse‟ keyword ... 36
7.1.1. Transaction Volume Change Regression Result ... 36
7.1.2. Absolute Return Regression Result ... 36
7.2. Results for ‟borsa istanbul‟ keyword ... 37
7.2.1. Transaction Volume Change Regression Result ... 37
7.2.2. Absolute Return Regression Result ... 38
7.3. Results for ‟bist‟ keyword ... 38
7.3.1. Transaction Volume Change Regression Result ... 38
7.3.2. Absolute Return Regression Result ... 39
7.4. Results for ‟bist + borsa istanbul‟ keyword ... 39
7.4.1. Transaction Volume Change Regression Result ... 39
7.4.2. Absolute Return Regression Result ... 40
7.5. Results for ‟bist + borsa istanbul + hisse‟ keyword ... 41
7.5.1. Transaction Volume Change Regression Result ... 41
7.5.2. Absolute Return Regression Result ... 41
7.6. Top searches with keywords ... 42
v
7.6.2. „bist + borsa istanbul + hisse‟ Top Searches ... 42
7.6.3. „hisse‟ Top Searches ... 42
7.7. Data ... 43
7.7.1. Data Dictionary ... 43
1
1. Introduction
Through the history of humanity, some developments changed the world abruptly and
provided the people the opportunity to observe how the world was changing. Invention of
wheel, invention of powdered guns, discovery of America, motor vehicles, air transport,
invention of computer are examples of those milestones. The most recent development of this
kind is the invention of internet, considering it puts its mark on the beginning of the 21st
century.
Internet became a considerable part of our lives so fast that even for the ones who lived most
of their lives cannot imagine how the life would be without it. We shop, plan, talk to
friends/family, search for information via internet and doing that we create a movement
(trace) that reflects our interests even when we use it anonymously.
Internet is a valuable information source that can give idea on what people think and
interested in. Which allows the demand estimations to get more precise as Choi & Varian [15]
presents. Internet is a deep sea that include irrelevant information or disinformation as well as
relevant. Therefore, to avoid the manipulative data, one must be working on the data of the
platforms that is widely preferred. Yahoo! Finance, Google, Twitter, Facebook, famous
magazine websites are examples among many.
The matter of estimation is limited with the imagination of the researchers. One of the top
subjects on estimation side is, as being directly about money, stock market estimation.
Efficient Market Hypothesis (EMH) [27], which is the most popular theory in the stock markets
literature, states that markets include all the publicly available information in prices and so it
is not possible to predict the tomorrow‟s market moves with today‟s data. Through time, there
2
that allows measuring the sentiment and the interests of public, there have been researches
that showed that there are some significant predictors.
The researches that found significant relations categorized by their data sources. Some
researchers used one source and some used combinations of sources. Wysocki (1998) [34] only
used Yahoo Messaging Boards‟ data which was available then but still found significant
results.
The most famous source among the researchers was Twitter that is an online news and social
networking platform that has a character limitation of 140. Twits are reflecting the public
sentiment and previous day sentiments might have a reflection in stock markets. Researchers
noticed that Twitter is a widespread and famous platform and decided to analyse the twits
either analysing message content with text mining techniques or just counting the related
message volume. Tayal et al. (2009) [31], Vincent & Armstrong, M. (2010) [33], Bollen et al.
(2011) [5], Sprenger & Welpe, I. M. (2010) [30], Zhang et al. (2011) [35], Rao & Srivastava
(2013) [27] and Öztürk & Çiftçi (2014) [24] are the researches that took only Twitter data as the
source. At Bar-Haim (2011) [3], researchers worked with Stocktwits platform data and found
significant estimation results.
With the development of high-level text mining techniques, the finance newspapers and
magazines became available to be as predictor data sources. The main idea behind was the
expert opinions that might be directing the investors with recommendations. That might be
observed by analysing the contents of the articles and creating an expert sentiment. The
researchers analysed past news data had significant results at estimation of stock markets.
Chowdhury et al. (2014) [9], Ishima et al. (2014) [16], Joshi et al. (2015) [17], Gündüz & Çataltepe (2015) [15]
3
Google Search Engine is dominating the search engine market with 77.82% share [38]. Google
is providing Google Trends Search Volume Index as a free public service that means it is
possible to observe what people are interested in or how their interest has changed in time.
This observation is possible on stock markets as well and various researchers worked with
Google Trends data. Mao et al. (2011) [23], Preis et al. (2013) [26] and Beer et al. (2013) [4] are
the main studies that had successful results with the data.
There are some researchers worked with combinations of data sources. Antweiler & Frank
(2004) [1] and Gu et al. (2006) [14] gained successful results by working with Yahoo! Finance
and stock market specific websites data. Ruiz et al. (2012) [28] gained the significant
relationship using Google and Twitter data. Levenberg et al. (2013) [19] had significant results
using extensive web sources including Yahoo, Google, Twitter and web news sources. In
research, Loughlin et al. (2013) [20], stock market specific platforms and Google Search data
were used resulting in significant results.
There were two available studies, namely Gündüz & Çataltepe (2015) [26] and Öztürk & Çiftçi (2014) [25], made on Turkey economy indicators (BIST and USDTRY) but none was by using
Google Trends Search Volume Index data. Öztürk & Çiftçi (2014) [25] was related to
USDTRY and completed by using Twitter data. Gündüz & Çataltepe (2015) [26] was a
research on predicting the BIST with the finance magazines text mining.
The motives in the study presented here are various. First, the curiosity of how the findings
changed in time with the improvement of the number of internet users. As quality of the
internet data is dependent on the number of people that use it while the internet usage spreads,
the results of estimation model might evolve to another way. For example, the relation that
was significant once, in time might be insignificant or vice versa. The second motive is to
4
The third one is to understand the meaning of Google Trends Search Volume Index (GTSVI)
properly. As GTSVI provides the interest to a keyword, the volume index change of that
keyword must be showing the change in demand of the real world value that keyword
presents. As I choose the keywords related to Istanbul Stock Index, the changes should
indicate a change connected to keyword volume changes. The 4th and last aim is to test the
GTSV on BIST as there was no such study in the literature.
My study is prepared by using Google Trends Search Volume Index (GTSVI) of 458 days
between Jan-2015 and Oct-2016 as the data source to test whether if the changes in some keywords‟ search volume index is meaningful in estimation of Istanbul Stock Exchange (BIST). To my knowledge, this is the first study using GTSVI for the estimation of BIST
indicators. My test results showed change in keywords search volume at lag 1 and 2 is
significant in estimation of BIST index‟s absolute return and change in transaction volume.
The next section is a review of past works that used the internet data to predict. Works to be
told are chosen mainly among the works that worked on estimation of stock market
parameters but there are some works that used internet data for estimation of useful real world
data. 3rd section first tells about Google Trends platform, then how the data was chosen and
collected. The last part of 3rd section summarizes the GARCH model and defines the model I
5
2. A Review of Past Works
Efficient Market Hypothesis(EMH), which is the most popular theory in the stock markets
literature is presented by Fama (1970) [13], says that there is no way to predict the market as
markets adjust to all the relevant information faster than any investor. There were supporters of the Efficient Market Theory in many ways and one of them was „A Random Walk Down Wall Street‟ by Malkiel (1973) [21]
which stated that markets follow a random walk and a
portfolio that was created by picking random stocks could succeed as much as stock market
professionals.
There were critics about the EMH from behavioural economics side. DeBondt and Thaler
(1995) [10] underlined the effects of optimism and pessimism of investors created a systematic
deviation from the actual state of the markets. They also indicated that their statement was
consistent with Kahneman and Tversky (1982) [18] in the way that investors were
systematically overconfident on their forecasts and this could lead the diversion. Another
behavioralist Shiller (2000) [29] stated the United States stock market upward trend towards the
end of 1990s was related to psychological state of that time in United States. His point was
that investors were affected from the prosperity during that time leading to market rise
irrationally. There observed a tendency on investors to underreact the new information.
The main past works related to useful real world data estimation via social media and web
data are provided in this section below. It is required to state that most of the articles
summarized below are the analysis results of financial market focused researches. For the
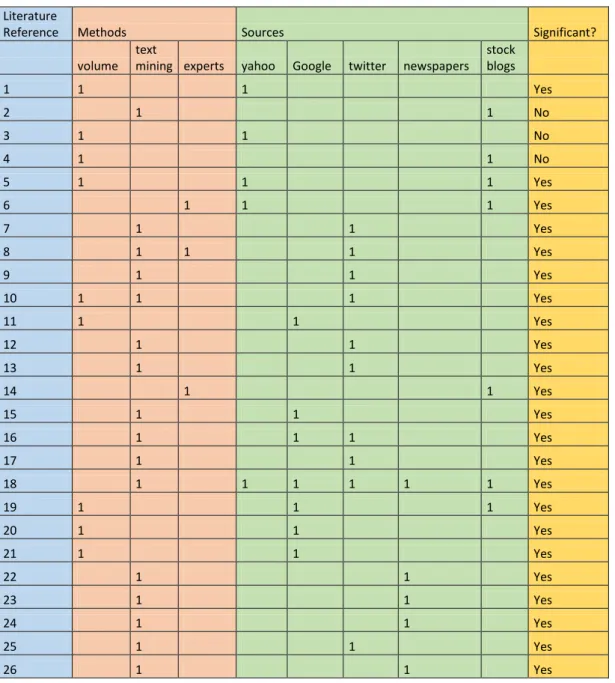
6 Literature
Reference Methods Sources Significant?
volume
text
mining experts yahoo Google twitter newspapers stock blogs 1 1 1 Yes 2 1 1 No 3 1 1 No 4 1 1 No 5 1 1 1 Yes 6 1 1 1 Yes 7 1 1 Yes 8 1 1 1 Yes 9 1 1 Yes 10 1 1 1 Yes 11 1 1 Yes 12 1 1 Yes 13 1 1 Yes 14 1 1 Yes 15 1 1 Yes 16 1 1 1 Yes 17 1 1 Yes 18 1 1 1 1 1 1 Yes 19 1 1 1 Yes 20 1 1 Yes 21 1 1 Yes 22 1 1 Yes 23 1 1 Yes 24 1 1 Yes 25 1 1 Yes 26 1 1 Yes
Table 2.1. The literature references, used methods and the data sources provided in the table.
The enthusiasm about the subject starts with Wysocki (1998) [34] who made a research
regarding the message volume of 3000 stocks in Yahoo! Message boards and noticed that
overnight message posting volumes was able to predict the market trade volume and returns.
On the regression that he formed with 50 firms (having the highest message volume in Yahoo! Finance) and 6 months‟ daily data. lag 1 message volume data over the past 5 days moving average was significant with p=0.013 when predicting lag 1 number of shares that
changed hands volume data over the past 5 days moving average. In the same way they were
7
Dewally (2000) [11] aimed to explain the value of the investment advice provided from the
several stock recommendation websites. His explanatory variable was the positive, negative
and neutral message counts in the web sites and dependant variable was the stock returns of
selected stocks in NYSE, NASDAQ, OTC BB and Canadian exchange. He did not find any
significant effect of news or messages on the stock return and also he noticed the momentum
trading behaviour. However, his work was even before the Twitter founded and Google trends
data to be public. Tumarkin & Whitelaw (2001) [32] made a study with the daily message
volume data in ragingbull.com. Their finding was, unlike Wysocki (1998) [34], that message volume was neither meaningful for the next day‟s trading volume nor there could be made an estimation for the return via the message volume. However, they concluded that relationship
was vice versa, that is the internet data is affected from the volume and return of stock market.
Bommel (2003) [7] contributed the literature with his working paper by underlining
rumourmongers and uninformed traders relationship. Finally, it is noted that the rumours
seemed having volatile but observable effects in the stock markets.
Antweiler & Frank [1] are one of the firsts of the literature with their published work in 2004.
Even as of 2004 not much of the investors were reflecting their actions in internet nor the
followers of the stock market message boards, they were able to observe the relation of
message volume with Volatility Index. The data they worked on predicting belonged to 45 big
company including Intel, Microsoft, and P&G. The message volume data collected from
Yahoo Finance and Raging Bull websites. As a result, they noticed a positive correlation
between message volume and Volatility Index. Their effect on stock returns noted as
statistically significant but economically small.
Gu et al. [14] made their analysis on 2005-2006 Yahoo! Finance data and used the same 45
8
the message content into account by recommendation categories available in the website
(1-day-holding, 1-week-holding and 1-month holding) as separate explanatory variable and
tested the categories according to their date recommendations. Moreover, they rated the users
and added more weight to the successful prediction owner messages. As of their regression,
coefficients of the messages were significant in lag 1, lag 2 and lag 3 which indicated that the
prices might not reflect the message board information at the time they were typed as efficient
market theory claims.
Tayal et al. (2009) [31] prepared their research with the stock recommendation blogs and
Twitter 2008-2009 data of Microsoft and Google stocks. They built a sentiment index from
the posts and created a prediction system using the index as input. The message contents were
systematically rated [-5,5] by focusing on the adjectives that were categorized according to
their negativity and positivity strengths. Comparison of their prediction with real data
indicated a good correlation between predicted results and real data. Even though the results
were changing stock or blog size wise, the minimum correlation result was above 0.766.
Vincent and Armstrong [33] worked on Forex data to see if using the Twitter alert would be
increasing the FX profit significantly. Twitter alert was the output of algorithm they
developed that gives alert according to the new words written by the sample Twitter user pool
chosen by them. New words were defined as not existing in the library that was automatically created by analysing the sample users‟ past twits. As a result, 5 months run, they observed that the buy and sell strategy that they built via Twitter data improved profits 0.56% to 1.27%
per month.
Bollen et al. (2010) [6] created a model that measures the Twitter Sentiment with the help of
Google Profile of Mood States(GPOMS) tool that categorizes the mood of the text in 6
9
10 months‟ data in 2008. The result of the regression of past 7 days Twitter moods data on
Dow Jones Index returns was found meaningful at the coefficients of Calm (lag 2...lag 6) and
Happy(lag 6) mood states.
Sprenger and Welpe (2010) [30] worked on explaining twitter sentiment data, stock return data
and message volume-trading volume or volatility relationship. One of their findings was that
the users that had proven good advice history to be retweeted more than the others had. With
the extensive work they created, most of the findings related to positive association of
contemporaneous message volume data with volatility, higher returns and trading volume. In
addition, they detected a lagged relationship exists in message volume and trade volume.
Mao et al. (2011) [23] analysed both Google Trends Search Volumes (GTSV) and news
sentiment to predict the Dow Jones Index in 2010-2011 data. They tested weekly search
volume data, found a significant estimation capability on trade volume, volatility, and return in Dow Jones by also verifying the relation with Granger‟s Causality Test. However, they did not have a chance to test GTSV daily data, as Google was not providing that service at the
time they prepared their work.
Asur & Huberman (2011) [2] analysed 2.89M Twitter messages related to a list of movies
whose release dates are between the dates 13-11-2009 and 26-02-2011. Categorizing the
messages according to their sentiments namely Positive, Negative and Neutral created a linear
regression model to predict the movies‟ revenue. The result of their work was to prove the
existence of a strong relationship between revenues and related twitter data. Their work was
one of the important works on the subject on how to utilise social media data and neatly
10
The work of Zhang et al. (2011) [35] was again on Twitter data. They worked on 6 months‟
data and checked the relation of data with NASDAQ, S&P500 and Dow Jones. They collected
the data according to the emotion tags of messages like negative, positive, hopeful, happy,
worried etc. and checked the correlations of the data with t+1 index movements and volatility
index. What they found was negative (anxious, worried and negative) post counts have a
stable (p<0.01) negative correlation with the return data and positive correlation with
volatility data. Counts of „Hope‟ found significantly and negative correlated with return data
but the result expected as positively correlated.
Bar-Haim et al. (2011) [3] worked on microblogs message data. Like Gu et al. [6], they focused
on expertize of the message posters. They rated the users and found the experts with the
algorithm they built. Detecting the experts and focusing expert messages data, they observed
enhancement in their stock price movement estimation.
Choi & Varian‟s (2011) [8]
made analysis with Google Trends data. Their study was not
directly related to stock markets but was aiming to show Google Trends data is useful for
estimation. The estimations were on; sales volume (US with lag 1 and lag 12 trends data),
unemployment (US was accepted as random walk and no estimation was successful), travel
amount (Several countries like US, JP, FR, IT etc. with R2 average of 73.3%), consumer
confidence (Australia Roy Morgan Consumer Confidence Index lag 1 trends data was highly
meaningful). The research results are important for showing the strength of web data in
estimation of important factors in economy management.
Rao & Srivastava (2010) [27] also worked on 15 months Google Trends Search Volume and
Twitter data together in 2010. The dependent variables were DJIA, NASDAQ and commodity
prices (gold and oil) have tested the estimation results with the sentiment predictors. The
11
superior in predicting the indexes compared to the estimation model without sentiment
predictors.
Ruiz et al. (2012) [28] worked on 150 chosen stocks‟ first 6 months‟ data of 2010 from Twitter
posts that included the stock code or the name of the company and dollar sign ($) or a hashtag
(#) with it. Decreasing the list of stocks to 20 (20 biggest companies) checked the correlations
of the data with the return and trade volume data that was obtained from Yahoo! Finance web
site and detected significant results with past Twitter data. Furthermore, they tested the
Twitter-based strategy against the random strategy and observed that the Twitter strategy was
superior.
Levenberg et al. (2013) [19] made a wider analysis with not only the Twitter or Google Trends
Data but whole news database of 700 news sources from 2000 to 2012. They analysed the
economy and employment related text in the websites sentence-by-sentence (6.6 M sentences)
via the machine-learning framework they formed. Their focus was on predicting Non-Farm
Index (NFI) as it was a solid indicator of where the markets head. They used Independent
Bayesian Classifier Combination (IBCC) model to test combinations of the sources sentiment
indexes on NFI prediction and, as a result, observed 0.85 prediction accuracy.
Loughlin and Harnish (2013) [20] tested Stocktwits.com Twits volume and Google Trends
search volume data for 4 stocks (Facebook, Microsoft, Apple, Google) and checking whether
the volume data of each is lagging or leading predictors by checking the betas. Their finding
was Stocktwits data was able to predict the stock return but Google Trends data was not.
Preis et.al.(2013) [26] analysed the Google Trends search volume data and analysed
performance of 98 search terms related to stock markets. Their work was testing the Trends
12
Google Trends on weekly basis between 2004 and 2011. The result was better than the
random strategy with the final profit of 326% (compared to random strategy whose result was
30%).
F. Beer et al. (2013) [21] created an investor sentiment index from Google search volume of the words under categories “economy” and “negative” in General Inquirer Harvard IV-4 dictionary and tested its significance in VAR analysis with mutual funds and stock market in
France. The result of their work was that investor sentiment had a negative coefficient and a
meaningful p value in 2 weeks‟ data set; however, the coefficient turns to positive over the next 3 to 4 weeks. Their work also suggested that the small firms‟ values related more with the trends data than the large ones.
Chowdhury (2014) [9] worked on creating a prediction model on Stock trends of the 15
worldwide companies (like IBM, Google, Apple etc.) stocks. The model built on the news
sentiment index, which created by analysing 4 weeks‟ interval news about the companies and
categorizing the news as positive, neutral and negative. The model was accurate 70% of given
time. However, it needs to be underlined that the model was working with present data and
presented as a support for Efficient Market Hypothesis.
Ishima et al.‟s (2014) [16]
work was related to the Nikkei and Nikkei Finance Magazine
relationship. The magazine articles were analysed for 2007-2012 interval according to an
index created as function of negative and positive words in the articles. The result was that the
sentiment index was meaningful at thirdlag.
Joshi et al. (2015) [17] recently made a study on predicting stock trends via news sentiment.
They used a classification model as Chowdhury (2014) did and categorized the messages
13
categories. Their work had detailed analysis of which sentiment classification is better in
detecting the sentiment (among SVM, Random Forest, Naïve Bayes RF provided best results)
They only focused on Apple Inc. stock returns between 2013-2016. In their article they
concluded that it is possible to predict the stock trend looking at the past news history from
88% to 92%.
Öztürk & Çiftçi (2014) [24]
made their research on Twitter data of [01-2013, 12-2013]. By analysing the Twits that include „USDTRY‟, they categorized the posts as negative, positive and neutral. They used LOGIT model to test the significance of lag 1 counts of all three
categories. They found a significant relationship with negative and positive lag 1 counts on
the exchange rate USDTRY. They also observed that neutral twits did not have any relation.
Gündüz et al. (2015) [15] had a research on BIST 100 index estimation by using Public
Disclosure Platform of BIST and financial newspapers. Their result was again a success in
estimation of whether the market will be up or down. They predicted the market up and
downs correctly 74% of the time.
The research told in sections below is prepared using 2015-2016 Google Trends Search
Volume Index(GTSVI) of keywords that are selected to indicate the interest in Istanbul Stock
Market Index BIST. The objective is to test the significance of GTSVI on the absolute return
and the transaction volume of BIST.
3. Methodology
Time series data has a property of having autocorrelation between subsequent residuals. As I
decided to analyse financial data I chose the regression method that is approved with the data.
Since the literature suggests that volatility should be taken into consideration while working
14
Heteroscedasticity) model for testing the relationships. However, we do not concentrate on
the significance of volatility parameters we only test the significance of coefficients of search
volume of keywords. The method and variables will be texplaiıned at part 3.3.
3.1. About Google Trends Data
Google Trends is a facility of Google that is open to public. Trends is a platform that provides
the search volume graph and data of given keyword starting from 2004 or any year after that
to whatever year to be chosen. Trends search can be differentiated by categories (like finance,
automotive, entertainment etc.), country, cities and at some countries in district level.
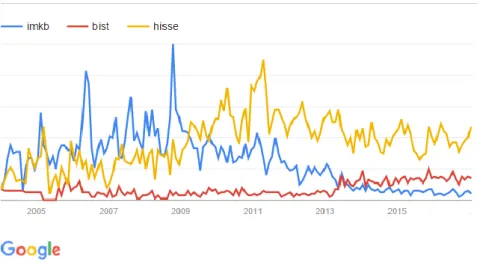
Trends platform enables comparing the search words trends history in graphs so that user
could understand how the keyword performed compared to the reference keyword. Figure
3.2.1 provides an example of a keyword history comparison. The graph taken from Google Trends website show how „imkb‟ keyword search volume decreased compared to keyword „hisse‟ (that is a Turkish word means share and mostly used for stock). Furthermore, how in 2013 it was started to be replaced with „bist‟, when IMKB (ex-short name of Istanbul stock exchange market) changed to BIST (Borsa Istanbul).
15
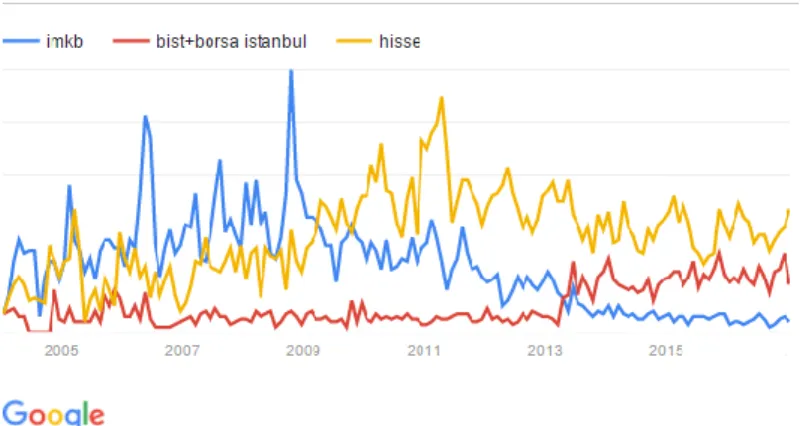
The search mechanism works with some rules and query results include only the phrase given.
For example, above searches were the graphs of search queries that include the given keywords. However, „bist‟ and „borsa istanbul‟ serve the same purpose and for providing the combination of words and/or functions were enabled in the search queries. In Figure 3.2.2 it could be observed when the or condition added to „bist‟ volume data.
Figure 3.1.2 Google Trends Search Volume Index historical search volume graph of keywords. To observe the difference of ‘+’ sign.
Google Trends daily data comes with a slight challenge that is; the daily data can be
downloaded only with at most 3 months‟ length at a time and each file indexed according to
highest volume which is accepted as 100. Remaining days‟ volume data is given relative
values. Google trends weekly data is available without time limitation and so provides whole
data in weekly scale which provides the chance to know each week‟s volume relative to
highest week. Thus, assuming to be worked with 1-month scale daily data, the data must be
normalized according to weekly data for a useful analysis. The reason behind is the relativity
of the highest search volume data. (One month‟s highest can even be the other month‟s
16
The normalization of the data is formulized as below:
RDVwi: Volume index of i‟th day of week w that is indexed relative to the month‟s highest volume.
RWVw: Sums of RDVwi for week w.
where i ={1,2,3,4,5,6,7}
WVw: Volume index of week taken from Trends.
DVt: Indexed Volume of tth day relative to highest week search volume in the history of the
data.
Equation 3.1.1
Equation 3.1.2
Note: For each w and i couple there is a t.
There is also a service in Google Trends that allows users to see what are the main searches with the queried keyword. As an example the query result for keyword „hisse‟ is provided below in Figure 3.1.2. This is helpful because a word could mean different things in different languages like „ISCTR‟ is stock code of Is Bank ant at the same time a government department in Romania (ISCTR: Inspectoratul de Stat pentru Controlul in Transportul Rutier).
17
Figure 3.1.2 Google Trends Search Volume Index the main searches list that include the keyword
3.2. Data collection process
As I will check the significance of past trends data with GARCH I need data to be stationary.
Therefore, I work with log changes of all dependent and explanatory variables.
The data collection started by choosing which dependent variable to use and what method to
test the relation. The time scale of the data was an important factor to choose. As I would be
making the analysis for Turkey and because of the political instability even hourly basis, I
found it proper to work with daily data instead of monthly or weekly.
Google Trends provides the search volume of the given keyword. The aim in this study is to
test whether past daily trends data provides any estimation regarding stock market parameters.
It could help predicting transaction volume. Furthermore, as volume estimation might not
indicate if the return changes or not I also tested absolute return data.
Taking the decisions, I formulated the dependent variables as follows:
t: indicates the order of day.
It: Stock market index value of the tth day.
Rt: Logarithmic return value of the tth day stock market index. ARt: Absolute value of Rt.
Vt: Transaction volume of the stock market index at day t. VCt: Transaction volume logarithmic change at day t.
Equation 3.2.1
18
Equation 3.2.3
To test the significance of any data on Istanbul Stock Market, assuming any of the indexes
among BIST, BIST 100 or BIST 30 would be proper, I decided to go on with daily BIST 100
data (includes 100 biggest firm stocks in stock market) that is available free of charge in
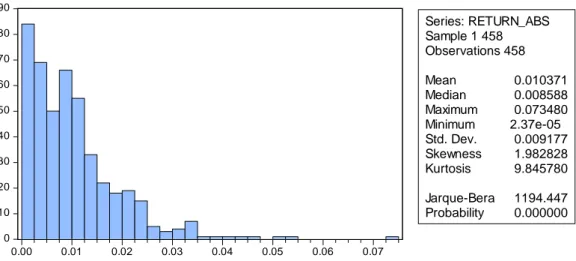
investing.com website [37]. The descriptive statistics of the dependent variables are given
below in the Table 3.3.1.
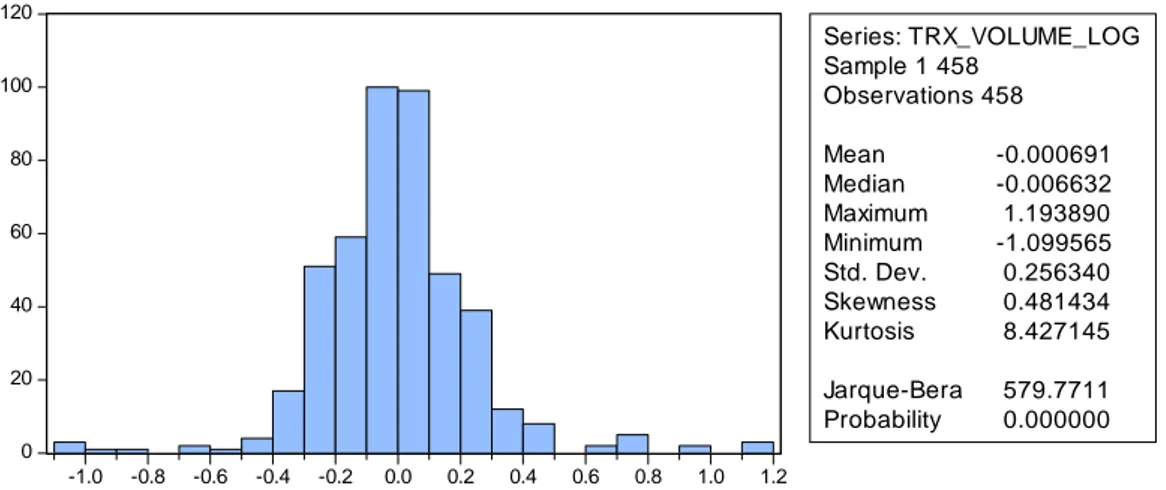
Sample 1 458 Observations 458 VCt ARt Mean -0.000691 0.010371 Median -0.006632 0.008588 Maximum 1.193890 0.073480 Minimum -1.099565 2.37e-05 Std. Dev. 0.256340 0.009177 Skewness 0.481434 1.982828 Kurtosis 8.427145 9.845780 Jarque-Bera 579.7711 1194.447 Probability 0.000000 0.000000
Table 3.2.1 Descriptive statistics of the estimated data
Figure 3.2.1 Histogram of Transaciton Volume Change
0 20 40 60 80 100 120 -1.0 -0.8 -0.6 -0.4 -0.2 0.0 0.2 0.4 0.6 0.8 1.0 1.2 Series: TRX_VOLUME_LOG Sample 1 458 Observations 458 Mean -0.000691 Median -0.006632 Maximum 1.193890 Minimum -1.099565 Std. Dev. 0.256340 Skewness 0.481434 Kurtosis 8.427145 Jarque-Bera 579.7711 Probability 0.000000
19
Figure 3.2.2 Histogram of Absolute Return
Deciding trends data had more steps compared to BIST data. Analysing trends data and stock
market relation had some complexities like;
- detecting the words which reflect the demand in Borsa Istanbul,
- detecting whether the keyword needs filtering,
- deciding which location data to use,
- deciding the time scale(monthly,weekly,daily),
- deciding whether to take weekends/holidays into account or not.
In the beginning I decided that analysing 2015-2016 data was enough as Turkey had many
political events, 2 general elections, strike and some stable intervals. I spent an important
amount of time while detecting which keywords to use. It was required to check many
keywords and to download, combine and normalize the 22 months‟ data (2015-2016) on hand
would require an extensive operational effort. Instead of spending that effort, I developed
code in R Language [39] and VisualBasic that downloads, combines and normalizes the data
according to Equations 3.2.1 and 3.2.2.
0 10 20 30 40 50 60 70 80 90 0.00 0.01 0.02 0.03 0.04 0.05 0.06 0.07 Series: RETURN_ABS Sample 1 458 Observations 458 Mean 0.010371 Median 0.008588 Maximum 0.073480 Minimum 2.37e-05 Std. Dev. 0.009177 Skewness 1.982828 Kurtosis 9.845780 Jarque-Bera 1194.447 Probability 0.000000
20
The keywords chosen to be presented here were selected among the keyword list of keywords.
The Table 3.2.2 below provides the keywords that I have checked and the explanation of the
keyword usage.
Keywords Parameter Description Explanation
Usdtry
- Might had an effect on BIST but at the first sight it did not, so I kept it aside and might be used later after digging deeper or in testing the estimation of USD TRY exchange rate in further works.
tl dolar - The same reason above
usd try - The same reason above
iş bankası hisse
- This keyword is for stock of one of the biggest
banks in Turkey however as stock and company had its private risks. Furthermore, the search volume data of the keyword was not stable(there were some impossible zeros in data) and considerably less compared to others. Therefore I decided not to show the results because of the space limitations.
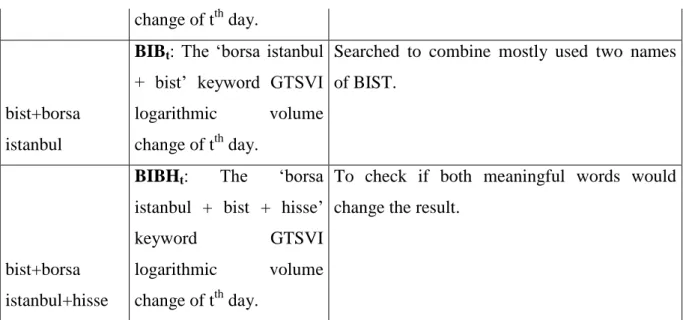
Hisse
hisset: The „hisse‟
keyword GTSVI
logarithmic volume change of tth day
„hisse‟ word is specific to Turkey and commonly it is used for stocks which seemed like a perfect word for analysis.
Bist
bistt: The „bist‟ keyword
GTSVI logarithmic
volume change of tth day
As it is the new abbreviation of the Istanbul Stock Exchange Market, it is a perfect word however the search data included the German Language „bist‟ as well. Therefore I needed to make some filtering. After implementing the constraint of Finance category.
borsa istanbul
BIt: The „borsa istanbul‟
keyword GTSVI
logarithmic volume
It is the name of the stock exchange market and needed to be included.
21
change of tth day.
bist+borsa istanbul
BIBt: The „borsa istanbul + bist‟ keyword GTSVI logarithmic volume change of tth day.
Searched to combine mostly used two names of BIST.
bist+borsa istanbul+hisse
BIBHt: The „borsa
istanbul + bist + hisse‟
keyword GTSVI
logarithmic volume change of tth day.
To check if both meaningful words would change the result.
Table 3.2.2 Descriptive statistics of the estimated data
As in GARCH method I needed stationary type data, I worked with the logarithmic changes
of the trends data(DVCt) which is calculated as follows for each explanatory variable;
After deciding the time interval and the keywords to be used, I needed to state which location
to use. In order to include international search volume data as well, I did not put any region
filtering. Trends data was available for all days of year, however BIST data was only
available for non-holiday days. For the holiday ith past data, I could take the average of the
past data till the ith past data order of BIST return data and accept it as t-i value but in that
case I would lose the time specification of the ith past data. Therefore, I decided to use directly
ith past data of trends return as the past data.
3.3. GARCH (Generalized Autoregressive Conditional
Heteroscedasticity)
Volatility is an important factor in analysing the financial data. As I aim to analyse the
22
due to the volatility in the data. Therefore I have to forecast the volatility and consider in the
regression process. Autoregressive conditional heteroskedasticity (ARCH), generalized
autoregressive conditional heteroskedasticity (GARCH) and stochastic volatility models are
the main tools used to model and forecast volatility. As a result GARCH(1,1) model whose
history is being told at next paragraph is chosen.
First, Engle (1982) [33] proposed a non-linear stationary model ARCH (Auto-Regressive
Conditionally Heteroscedasticity) mentioning conditional variance of the parameters increases
in an autoregressive way, that is tth day variance is a function of t-1th day variance. Then
Bollersev & Taylor (1986) [34] generalized the ARCH model and new generalized model was
named it as GARCH (Auto-Regressive Conditionally Heteroscedasticity). GARCH is used if
error terms are expected to show an autoregressive moving average behaviour and so it is for
analysis of financial time series.
A GARCH Model is defined with p and q, which are the orders of σ2 and ε2. The notation of
the model is provided below.
A GARCH process is defined as follows:
23
Autocorrelations of ε2 is calculated:
The null hypothesis states that no ARCH or GARCH errors exist. Rejecting the hypothesis
indicates the errors exist. The model specified to my study is given below:
In my model VCt and ARt corresponds to dependent variable and hisset, BIt, bistt, BIBt,
BIBHt are the explanatory variables correspond to based on the model I use.
4. Results
4.1. Results for ’hisse’ keyword
The keyword „hisse‟ is a Turkish specific word for stock and a great ratio of searches with that keyword reflects the demand to any stock in stock market. It is a good indicator of stock
market follower volume. I tested the significance of the trends data on transaction volume
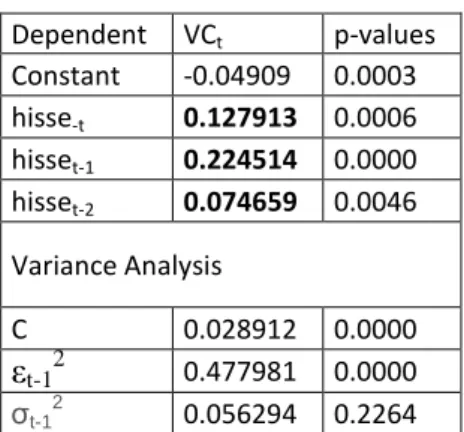
24 Dependent VCt p-values Constant -0.04909 0.0003 hisse-t 0.127913 0.0006 hisset-1 0.224514 0.0000 hisset-2 0.074659 0.0046 Variance Analysis C 0.028912 0.0000 εt-12 0.477981 0.0000 σt-1 2 0.056294 0.2264
Table 4.1.1 Regression results in BIST Transaction Volume Change estimation with ‘hisse’ search volume change.
The regression result shows that search volume changes at lag 1 and 2 are strongly significant
in transaction volume change of BIST 100 data with p<0.01. Furthermore, lag 1 explanatory
data is stronger from t in regression. The next step is to check if the data can explain index
return as well. However, the change must be checked as absolute values of return as the
change in search volume might be caused both by an expectation of rise or fall.
ARt p-values Constant 0.008748 0.0000 hisse-t 0.006449 0.0000 hisset-1 0.003646 0.0001 hisset-2 0.002124 0.0159 Variance Analysis C 1.38E-06 0.0000 εt-12 -0.027984 0.0000 σt-1 2 1.013507 0.0000
25
Table 4.1.2 Regression results in BIST Absolute Return estimation with ‘hisse’ search volume change.
For absolute return „hisse‟ search volume t and lag 1 are significant with p<0.01 strength and
lag 2 data is significant with p<0.02. The coefficients of estimators have a positive relation
with the absolute return data. Day t, which is the order (date) of the estimated data, seemed to
be having a stronger relation when compared to other two.
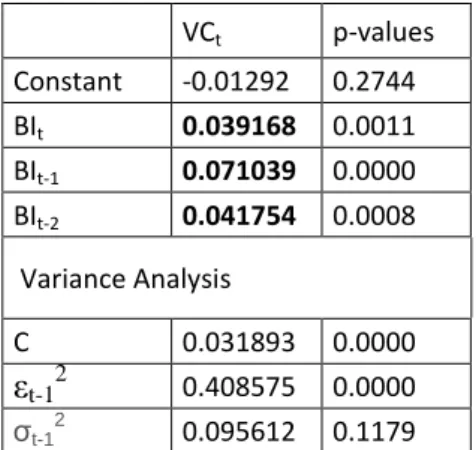
4.2. Results for ‘borsa istanbul’ keyword
Keyword „borsa istanbul‟ searches mean the searches that contained „borsa‟ and „istanbul‟ words in any order and again being the new name of the Istanbul Stock Exchange Market, it
gives some explanation for the Transaction Volume Change. The test result of absolute return
is avalible below in Table 4.2.1.
VCt p-values Constant -0.01292 0.2744 BIt 0.039168 0.0011 BIt-1 0.071039 0.0000 BIt-2 0.041754 0.0008 Variance Analysis C 0.031893 0.0000 εt-12 0.408575 0.0000 σt-1 2 0.095612 0.1179
Table 4.2.1 Regression results in BIST Transaction Volume Change estimation with ‘borsa istanbul’ search volume change.
Transaction volume change estimation with „borsa istanbul‟ keyword volume changes again
positive with t, lag 1 and lag 2 data that have p<0.01. Like „hisse‟ keyword, the strongest
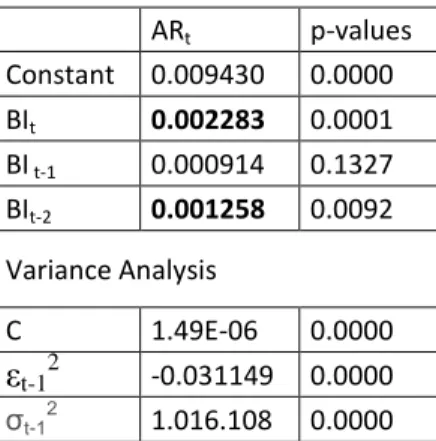
explanation again belongs to lag 1. The test result of absolute return data with the same
26 ARt p-values Constant 0.009430 0.0000 BIt 0.002283 0.0001 BI t-1 0.000914 0.1327 BIt-2 0.001258 0.0092 Variance Analysis C 1.49E-06 0.0000 εt-12 -0.031149 0.0000 σt-1 2 1.016.108 0.0000
Table 4.2.2 Regression results in BIST Absolute Return estimation with ‘borsa istanbul’ search volume change.
Despite the volume of „borsa istanbul‟ does not explain the dependents as strong as „hisse‟,
still the trends data t and lag 2 coefficients are significant in explaining the absolute return
with p<0.01. The strongest explanatory variable is t for absolute return.
4.3. Results for ’bist’ keyword
„bist‟ keyword, as it is the short name of the stock index is also taken into consideration in tests. Main searches that include „bist‟ are results of irrelevant searches (mostly with German word „bist‟), so I applied finance category filtering (the filtering option provided by Google Trends API). The reason for this filtering is to exclude the effects other than finance. The
transaction volume change estimation results are provided in Table 4.3.1 below.
VCt p-values Constant 0.001913 0.8631 bistt 0.021080 0.0690 bist t-1 0.041597 0.0047 Variance Analysis C 0.031538 0.0000 εt-12 0.042629 0.3458
27 σt-1
2
0.687765 0.0595
Table 4.3.1 Regression results in BIST Transaction Volume Change estimation with ‘bist’ search volume change.
The explanation capacity of „bist‟ is not as much as two keywords above, however still the
information it provides is consistent with the expectations. At lag 1 data is stronger in
explaining transaction volume data with p<0.01 and at time t it is significant with p <0.1.
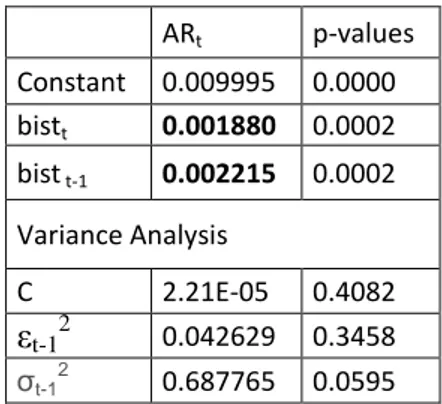
Absolute return test results are provided in Table 4.3.2 below.
ARt p-values Constant 0.009995 0.0000 bistt 0.001880 0.0002 bist t-1 0.002215 0.0002 Variance Analysis C 2.21E-05 0.4082 εt-12 0.042629 0.3458 σt-1 2 0.687765 0.0595
Table 4.3.2 Regression results in BIST Absolute Return estimation with ‘bist’ search volume change.
The results indicate significance, at lag 1 level. The results show a strong relationship with
p<0.001.
4.4. Results for ’bist + borsa istanbul’ keyword
„bist‟ and „borsa istanbul‟ keywords are the words that are used to search the stock index and their combination needed to be checked as their combination might indicate the stock market
search information stronger compared to any of two. Transaction volume estimation results
are given in the table below.
28 Constant -0.00222 0.8538 BIBt 0.039042 0.0061 BIBt-1 0.036431 0.0347 BIBt-2 0.018093 0.1582 Variance Analysis C 0.03263 0.0000 εt-12 0.427767 0.0000 σt-1 2 0.089394 0.0947
Table 4.4.1 Regression results in BIST Transaction Volume Change estimation with ‘bist+borsa istanbul’ search volume change.
Transaction volume change estimation coefficients of t (p<0.01) and lag 1 (p<0.05) are
significant and consistent with the findings for other keywords. However, the comparative
strength of lag 1 compared to t seems to disappear when this keyword is used. Absolute return
estimation result is available below.
ARt p-values Constant 0.009858 0.0000 BIBt 0.001396 0.0074 BIBt-1 0.001036 0.0613 BIBt-2 0.000367 0.4698 Variance Analysis C 1.67E-06 0.0000 εt-12 -0.034110 0.0000 σt-1 2 1.016967 0.0000
Table 4.4.2 Regression results in BIST Absolute Return estimation with ‘bist+borsa istanbul’ search volume change.
At absolute return estimation t and lag 1 volume changes seems significant with p<0.01 and
29
4.5. Results for ‘bist + borsa istanbul + hisse’ keyword
To test the combination of all the meaningful keywords‟ search volume change, the data for the three keywords „bist‟, ‟borsa istanbul‟ and ‟hisse‟ tested on volume change and the results are given in the Table 4.5.1.
VCt p-values Constant -0.018697 0.1084 BIBHt 0.057789 0.0002 BIBHt-1 0.077611 0.0000 Variance Analysis C 0.032721 0.0000 εt-12 0.414848 0.0000 σt-1 2 0.068952 0.1471
Table 4.5.1 Regression results in BIST Transaction Volume Change estimation with ‘hisse+bist+borsa istanbul’ search volume change.
This combination indicates a regression without lag 2 data like „bist‟ and „bist+borsa istanbul‟
keywords does. The high significance levels p<0.01 is consistent with other keyword search
volumes. Lag1 data is again a stronger predictor compared to t. Absolute return estimation
result is available below.
ARt p-values Constant 0.009655 0.0000 BIBHt 0.002169 0.0000 BIBHt-1 0.001876 0.0000 Variance Analysis C 1.07E-06 0.0000 εt-12 -0.025721 0.0000 σt-1 2 1015351 0.0000
Table 4.5.2 Regression results in BIST Absolute Return estimation with ‘hisse+bist+borsa istanbul’ search volume change.
For absolute return estimation both t and lag 1 data coefficients are highly significant with
30
5. Conclusion
Efficient Markets Hypothesis that Fama presented in 1970 states that even in the weak form, the market‟s current price reflects all publicly available information in the past and therefore no estimation could be feasible for the estimation of the market with past and publicly
available data. However, stock markets estimation studies went on with day-by-day growing
numbers. Results of the studies indicate that market is fast for including the information in the
prices but it is not as fast as preventing profit to the past data analysts. Markets finally will
include a type of past data however, another type of data would replace it and there will be a
new estimation opportunity. Recent researches show that internet data is now the data type
that provides some estimation advantages.
Starting from Wysocki [1] many of the researchers observed explanatory relationship from
internet data towards stock markets. The research models and results change according to the
internet source researches used like finance specific messaging boards, web search data,
newspapers, economic magazines and public messaging platforms. Researches also
differentiate in the way they process data namely focusing on message volumes, search
volumes or the content sentiment.
The aim of this research is to contribute on literature as being the first work that is prepared
on Istanbul Stock Market and Google Trends search data relationship by checking the
significance of the t-i trends data in estimation. During the study, I tested many possible
keywords that directly or indirectly indicate the demand to BIST. I expected that some of the
words might reflect the demand to stock market more than others do. It was correct but in a
way result was surprising that not the direct keywords that first come into the mind like „bist‟and „borsa istanbul‟ were less successful than the keyword „hisse‟ which simply is the Turkish specific word for stock.
31
The results show that some keywords predict better than others but for all the keywords, I find
that using web search data as predictor help to improve estimation for transaction volume and
absolute return data of Istanbul Stock Market Index (BIST). Taking absolute return and
transaction volume changes as dependent variables, search data at lag 1 and 2 is significant.
6. References
1. Antweiler, W.; Frank, M. Z. (2004), Is All That Talk Just Noise? The Information Content
32
2. Asur, S.; Huberman, B. (2011) Predicting the future with social media, … Agent
Technology (WI-IAT), 2010 IEEE, pp.492–499.
3. Bar-Haim, R.; Dinur, E.; Feldman, R.; Fresko, M.; Goldstein, G. (2011) Identifying and
following expert investors in stock microblogs, EMNLP '11 Proceedings of the Conference on
Empirical Methods in Natural Language Processing, Pages 1310-1319
4. Beer, F.; Herve, F.; Zouaoui M. (2013) Google Investor Sentiment and the Stock Market,
Economic Bulletin, Vol.33 no.1 pp. 454-466.
5. Bollen, J.; Mao, H.; Zeng, X. (2011), Twitter mood predicts the stock market, Journal of
Computational Science, 2(1), pp.1–8.
6. Bollerslev, T. (1986), Generalized autoregressive conditional heteroscedasticity, Journal of
Econometrics, 1986, vol. 31, issue 3, pages 307-327.
7. Bommel, J. (2003), Rumors. The Journal of Finance, 58(4), pp.1499–1519.
8. Choi, H.; Varian, H. (2012), Predicting the Present with Google Trends, Economic Record,
88: 2–9, doi:10.1111/j.1475-4932.
9. Chowdhury, S.G.; Routh, S.; Chakrabarti, S. (2014), News Analytics and Sentiment
Analysis to Predict Stock Price Trends, Int. J. Comput. Sci. Inform. Technol 5.3 (2014):
3595-3604.
10. DeBondt, W. F. M.; Richard Thaler (1995), “Does the Stock Market Overreact?” Journal
of Finance, 40, 793-805.
11. Dewally, M. (2000), Internet Investment Advice: Investing with a Rock of Salt, Financial
33
12. Engle, Robert F. (1982), "Autoregressive Conditional Heteroscedasticity with Estimates
of the Variance of United Kingdom Inflation", Econometrica, 50 (4): 987–1007, JSTOR
1912773.
13. Fama, E. F.; Malkiel, B. G. (1970), Efficient Capital Markets: A Review of Theory and
Empirical Work, The Journal of Finance, 25: 383–417. doi:10.1111/j.1540-6261.
14. Gu, B.; Konana, P.; Liu, A.; Rajagopalan, B.; Ghosh, J. (2006), Identifying Information in
Stock Message Boards and Its Implications for Stock Market Efficiency, Extended Abstract
for Consideration for WISE
15. Gündüz, H.; Çataltepe, Z. (2015) “Borsa Istanbul (BIST) daily estimation using financial news and balanced feature selection.” Expert Syst. Appl. 42 (2015): 9001-9011.
16. Ishima, H.; Kazumi, T.; Maeda, A. (2014), Sentiment Analysis for the Japanese stock
market, DOI: http://dx.doi.org/10.1504/GBER.2015.070303
17. Joshi, K.; Bharati, H. N.; Jyothi, R. (2015), Stock Trend Estimation Using News
Sentiment Analysis, arXiv:1607.01958 [cs.CL].
18. Kahneman, D., Slovic, P., & Tversky, A. (1982). Judgment under uncertainty: Heuristics
and biases. Cambridge: Cambridge University Press.
19. Levenberg, A.; Pulman, S.; Moilanen, K.; Simpson, E.; Roberts, S. (2013), Predicting
Economic Indicators from Web Text Using Sentiment Composition, IJCCE 2014 Vol.3(2):
109-115 ISSN: 2010-3743
20. Loughlin, C.; Harnisch, E. (2013), The Viability of StockTwits and Google Trends to
Predict the Stock Market,
34
21. Malkiel, Burton G. (1973), A Random Walk Down Wall Street (6th ed.). W.W. Norton &
Company, Inc. ISBN 0-393-06245-7.
22. Malkiel, Burton G. (2003), "The Efficient Market Hypothesis and Its Critics" Journal of
Economic Perspectives, 17(1): 59-82.
23. Mao, H.; Counts, S.; Bollen, J. (2011), Predicting Financial Markets: Comparing Survey,
News, Twitter and Search Engine Data, arXiv preprint p.10.
24. Öztürk, S.; Çiftçi, K. (2014), A Sentiment Analysis of Twitter Content as a Predictor of
Exchange Rate Movements, Review of Economic Analysis 6, 132-140, 1973-3909/2014132.
25. Posedel, P. (2005), Properties and Estimation of GARCH (1,1) Model, Metodoloski
Zvezki, Vol. 2, No. 2, 2005, 243-257.
26. Preis, T.; Maat, H. S.; Stanley, H. E. (2013), Quantifying Trading Behavior in Financial
Markets Using Google Trends, Scientific Reports 3, Article number: 1684,
doi:10.1038/srep01684.
27. Rao, T.; Srivastava, S. (2013), Modelling Movements in Oil, Gold, Forex and Market
Indices Using Search Volume Index and Twitter Sentiments. In Proceedings of the 5th
Annual ACM Web Science Conference.
28. Ruiz, E. J.; Hristidis, V.; Castillo, C.; Gionis, A.; Jaimes, A. (2012), Correlating Financial
Time Series with Micro-Blogging Activity, Proceeding WSDM '12 Proceedings of the fifth
ACM international conference on Web search and data mining, Pages 513-522
29. Shiller, R. J. (2000), Irrational exuberance. Princeton, NJ: Princeton University Press.
30. Sprenger, T.O.; Welpe, I. M. (2010), Tweets and Trades: The Information Content of
35
31. Tayal, D.; Komaragiri, S. (2009) Comparative Analysis of the Impact of Blogging and
Micro-blogging on Market Performance, International Journal, 1(3), pp.176–182.
32. Tumarkin, R.; Whitelaw, R.F. (2001), News or Noise? Internet Postings and Stock Prices.
Financial Analysts Journal, 57(3), pp.41–51
33. Vincent, A.; Armstrong, M. (2010), Predicting Break-Points in Trading Strategies with
Twitter, SSRN 1685150.
34. Wysocki, P. D. (1998), University of Michigan Business School Working Paper No.
98025
35. Zhang, X.; Fuehres, H.; Gloor, P. A. (2011), Predicting Stock Market Indicators through Twitter “I hope it is not as bad as I fear”, Social and Behavioural Sciences Volume 26, Pages 55-62
36. www.google.com/trends
37. www.investing.com
38. www.netmarketshare.com/search-engine-market-share.aspx
36
7. Appendix
7.1. Results for ’hisse’ keyword
7.1.1. Transaction Volume Change Regression Result
Dependent Variable: TRX_VOLUME_LOG
Method: ML - ARCH (Marquardt) - Normal distribution Date: 01/10/17 Time: 14:34
Sample: 1 458
Included observations: 458
Convergence achieved after 23 iterations Presample variance: backcast (parameter = 0.7) GARCH = C(5) + C(6)*RESID(-1)^2 + C(7)*GARCH(-1)
Variable Coefficient Std. Error z-Statistic Prob. C -0.049093 0.013621 -3.604282 0.0003 HISSE_LOG_T 0.127913 0.037305 3.428850 0.0006 HISSE_LOG_1 0.224514 0.028457 7.889691 0.0000 HISSE_LOG_2 0.074659 0.026358 2.832533 0.0046 Variance Equation C 0.028912 0.002833 10.20373 0.0000 RESID(-1)^2 0.477981 0.080660 5.925860 0.0000 GARCH(-1) 0.056294 0.046537 1.209663 0.2264 R-squared 0.099392 Mean dependent var -0.000691 Adjusted R-squared 0.093441 S.D. dependent var 0.256340 S.E. of regression 0.244070 Akaike info criterion -0.185400 Sum squared resid 27.04490 Schwarz criterion -0.122326 Log likelihood 49.45666 Hannan-Quinn criter. -0.160558 Durbin-Watson stat 2.504249
7.1.2. Absolute Return Regression Result
Dependent Variable: RETURN_ABS
Method: ML - ARCH (Marquardt) - Normal distribution Date: 01/10/17 Time: 14:30
Sample: 1 458
Included observations: 458
Convergence achieved after 49 iterations Presample variance: backcast (parameter = 0.7) GARCH = C(5) + C(6)*RESID(-1)^2 + C(7)*GARCH(-1)
Variable Coefficient Std. Error z-Statistic Prob. C 0.008748 0.000162 53.92011 0.0000 HISSE_LOG_T 0.006449 0.001089 5.923869 0.0000 HISSE_LOG_1 0.003646 0.000931 3.917146 0.0001 HISSE_LOG_2 0.002124 0.000881 2.410975 0.0159
37
Variance Equation
C 1.38E-06 2.36E-07 5.829889 0.0000 RESID(-1)^2 -0.027984 0.003269 -8.561148 0.0000 GARCH(-1) 1.013507 0.004588 220.8827 0.0000 R-squared 0.048633 Mean dependent var 0.010371 Adjusted R-squared 0.042347 S.D. dependent var 0.009177 S.E. of regression 0.008981 Akaike info criterion -6.640184 Sum squared resid 0.036619 Schwarz criterion -6.577109 Log likelihood 1527.602 Hannan-Quinn criter. -6.615342 Durbin-Watson stat 2.095596
7.2. Results for ’borsa istanbul’ keyword 7.2.1. Transaction Volume Change Regression Result
Dependent Variable: TRX_VOLUME_LOG
Method: ML - ARCH (Marquardt) - Normal distribution Date: 01/10/17 Time: 15:04
Sample: 1 458
Included observations: 458
Convergence achieved after 41 iterations Presample variance: backcast (parameter = 0.7) GARCH = C(5) + C(6)*RESID(-1)^2 + C(7)*GARCH(-1)
Variable Coefficient Std. Error z-Statistic Prob. C -0.012918 0.011818 -1.093058 0.2744 BI_LOG_T 0.039168 0.011987 3.267580 0.0011 BI_LOG_1 0.071039 0.016569 4.287545 0.0000 BI_LOG_2 0.041754 0.012506 3.338672 0.0008 Variance Equation C 0.031893 0.003704 8.609722 0.0000 RESID(-1)^2 0.408575 0.079785 5.120959 0.0000 GARCH(-1) 0.095612 0.061151 1.563541 0.1179 R-squared 0.034063 Mean dependent var -0.000691 Adjusted R-squared 0.027680 S.D. dependent var 0.256340 S.E. of regression 0.252768 Akaike info criterion -0.087064 Sum squared resid 29.00673 Schwarz criterion -0.023989 Log likelihood 26.93763 Hannan-Quinn criter. -0.062222 Durbin-Watson stat 2.476171
38
7.2.2. Absolute Return Regression Result
Dependent Variable: RETURN_ABS
Method: ML - ARCH (Marquardt) - Normal distribution Date: 01/10/17 Time: 15:00
Sample: 1 458
Included observations: 458
Convergence achieved after 33 iterations Presample variance: backcast (parameter = 0.7) GARCH = C(5) + C(6)*RESID(-1)^2 + C(7)*GARCH(-1)
Variable Coefficient Std. Error z-Statistic Prob. C 0.009430 1.00E-05 940.6471 0.0000 BI_LOG_T 0.002283 0.000591 3.863759 0.0001 BI_LOG_1 0.000914 0.000608 1.503695 0.1327 BI_LOG_2 0.001258 0.000483 2.605283 0.0092 Variance Equation C 1.49E-06 2.48E-07 5.999763 0.0000 RESID(-1)^2 -0.031149 0.003393 -9.179998 0.0000 GARCH(-1) 1.016108 0.005567 182.5370 0.0000 R-squared 0.033383 Mean dependent var 0.010371 Adjusted R-squared 0.026996 S.D. dependent var 0.009177 S.E. of regression 0.009053 Akaike info criterion -6.637759 Sum squared resid 0.037206 Schwarz criterion -6.574684 Log likelihood 1527.047 Hannan-Quinn criter. -6.612917 Durbin-Watson stat 2.081535
7.3. Results for ’bist’ keyword
7.3.1. Transaction Volume Change Regression Result
Dependent Variable: TRX_VOLUME_LOG
Method: ML - ARCH (Marquardt) - Normal distribution Date: 01/15/17 Time: 23:30
Sample: 1 458
Included observations: 458
Convergence achieved after 29 iterations Presample variance: backcast (parameter = 0.7) GARCH = C(4) + C(5)*RESID(-1)^2 + C(6)*GARCH(-1)
Variable Coefficient Std. Error z-Statistic Prob. C 0.001913 0.011096 0.172368 0.8631 BIST_LOG_T 0.021080 0.011592 1.818498 0.0690 BIST_LOG_1 0.041597 0.014712 2.827447 0.0047