Commun.Fac.Sci.Univ.Ank.Series A2-A3 Volume 59, Number 2, Pages 41-54 (2017) DOI: 10.1501/commua1-2_0000000103 ISSN 1303-6009
http://communications.science.ankara.edu.tr/index.php?series=A2
Received by the editors: October 18, 2017; Accepted: December 20, 2017.
Key word and phrases: Recommendation systems, collaborative filtering, user similarity.
© 2017 Ankara University Communications Faculty of Sciences University of Ankara Series A2-A3: Physical Sciences and Engineering Communications de la Faculté des Sciences de l'Université d'Ankara-Séries A2-A3: Physical Sciences and Engineering
A NEW SIMILARITY COEFFICIENT FOR A COLLABORATIVE FILTERING ALGORITHM
OZGE MERCANOGLU SINCAN and ZEYNEP YILDIRIM
Abstract. Recommender systems give the opportunity to present automatically personalized content across many digital marketing channels to visitors depending on visitor movements on the site. In recent years, there has been a lot of interest in e-commerce companies in order to offer personalized content. So, recommender systems become very popular and many studies have been done in this regard. New works are being done day by day to improve the results. In this paper, we propose a new memory-based collaborative filtering algorithm. Calculation of similarities between items or users is a critical step in memory-based CF algorithms. Therefore, we proposed a new function for calculation of similarities based on user ratings. In this study the more similar the user's pleasures are, the more similar it is to the products the users choose, is adopted. The adopted idea in this study is that the more similar the user's pleasures are, the more similar products are chosen. We estimate the degree which a user is interested in X product. To do this, we find other users who are interested in product X and calculate the similarity ratios of those users to the user. We tested our algorithm in MovieLens 100K dataset and compared to other similarity functions. We used MAE and RMSE measures in our experiments.
1. Introduction
Recommendation systems (RSs) are intelligent information filtering engines that shorten the decision-making process. These systems are the leading parts of the user experience head of our favorite platforms. RSs are fed from both open and closed interactions. Open interactions are your preferences on your platform, your scorecards, your comments, or the information you give when you create a profile. Closed interactions are clicks, purchases, and searches. Recommendation engines predict the user or client's online interests by looking at the data below the interactions in these two concepts. Correct personalization always evaluates content and real user claims together. The ultimate goal of these systems is to maximize the user experience by influencing "moment of truths". These important and short
moments of decision depend on what the user really needs, the company's communication and the information he or she can reach.
Nowadays, we can always encounter a recommendation mechanism on the internet. Suggestions are highly consistent suggestions that typically show up by recommendation mechanisms, such as Google, Youtube, where you guess what you're looking for when you're doing a search, or what other people download the same song while downloading a song from iTunes. Within e-commerce firms, advice mechanisms based on estimations and ease of travel needs will contribute to customer loyalty. Today, Amazon.com's content changes dynamically based on recommendation systems. Even Amazon.com sends the potential product to logistics centers close to the delivery address, prior to the purchase, by looking at previous orders, product searches, basket movements, to ensure orders are delivered much sooner. Therefore, RSs have become very popular in recent years. It's so popular that even site ads are now user-specific. When you visit a site, you can easily reach the prices of similar products or different sales places you have searched for before. They are applied in various applications.
RS can be considered under 3 main headings: collaborative filtering (CF), content-based filtering (CBS), and hybrid recommender systems.
CF is one of the most successful RS techniques. The main purpose of CF systems is to determine which product a particular user likes, using the user's knowledge of the products. CF systems generally use data sets that contain user information and users' interest in products. There are many challenges for CF tasks; problems with very rare data, scaling with an increasing number of users and items, satisfying short-term recommendations and being able to cope with other problems such as synchronicity, data breaches and privacy issues. Also CF systems cannot recommend for new users and items. Early-generation CF systems use the product ratings of users to calculate the similarity between users or products. Then, based on these calculations, they are predicting. Memory-based CF systems are the most preferred system by companies. The reason for this is that its application is simple and largely effective. Thanks to CF systems, the effort that users spend searching for a product is diminishing. This brings the firm; customer loyalty, high sales, more ads. However, CF systems are inadequate. CF systems do not work efficiently if the user in the dataset has very low product rating data or if the target user has limited common products available to other users. Model-based CF approaches have been proposed to solve the inadequacy of memory-based CF systems and to increase the efficiency even further. Model-based CF approaches use product rating data. Each user's score is calculated
according to their individual product ratings. Machine learning is often used for calculations.
Along with collaborative filtering, content-based filtering is also commonly used in recommendation systems. The features of the items are used to make a suggestion in content based recommendation systems. In such systems, the user is advised of new items that have the common features of the user's past preferences.
Hybrid recommender systems is the another main headings of RS. In this approach, content-based filtering and collaborative filtering methods are used together. The goal is to get rid of as much as possible the disadvantages of having a single method and to combine the advantages of the methods. Content-based and cooperative filtering methods can be used together in different ways.
In this paper, we applied memory-based CF system by using user-item ratings data. In memory-based CF systems, similarity calculations between users or products are very important. While the similarity between product
a
and productb
is calculated for product-based CF systems, two of these products have user evaluations. On the contrary, for a user-based CF algorithm, first, a similarity value betweenu
and v users that grades the same items is computed. There are many calculation methods to calculate similarity between users or products. The most commonly used similarity calculation methods are: Pearson correlation-based similarity, vector cosine-based similarity, distance-based similarity.In this study, we improve the algorithm of our preliminary work. In [1], we estimated the rate by multiplying weight and users rating. In this work, we used weighted average method for getting better results and compare our algorithm with others. The rest of this paper is organized as follows. Section 2 reviews previous studies regarding recommendation systems. Section 3 explains the proposed method. Section 4 shows the experimental results. The last section concludes our paper.
2. RELATED WORK
Interest in RS is increasing day by day. The main reason for this is the increase in the use of social media. Along with social media, different solutions are needed because the data that can be used for RSs are increased substantially. In this section, a brief summary of the work on RS will be presented.
After the CF method was found, a number of recommendation systems were created using this method. Tapestry [2], is the best known of these. This work was done in order to allow users to see the titles that attracted only the interest of users, in their
e-mails. After Tapestry, GroupLens [3] was proposed in 1994. The GroupLens study was designed to make it easier for users to read news from the Internet. While users were reading the news, they could see the predicted values that they could give and then change it according to their own values. Thus, they contributed to the operation of the system. Until now, this method has been applied to many areas.
Breese et al. divided CF into two classes: memory-based, model-based. Similarity ratios, correlation coefficients and statistical methods were applied in this study. Correlation coefficients and statistical methods gave good results [4]. Herlocker et al., proposed an estimation method that is based on weighting according to the similarity coefficient of the degree of co-products between the target user and other users. [5]. In [6], a probabilistic structure was used. The solution to the problem of "new user" of CF systems is provided by the structure used. In addition, they have reduced the operating cost because they work on carefully selected user data. They took their results on two different datasets. In [7], they do not consider the general consistency relationship between users or products of existing memory-based CF systems. They suggest a self-learning system based on solving the problems that arise as a result of this approach. In this system, rational individual prediction is made by looking at the preferences and ratings of the users. The results were higher when compared to other methods available. Adamopoulos et. al. [8] proposed a new method for estimating prospective opportunities based on unknown ratings and weighted percentages. The proposed approach demonstrates the practical application of classical KNN in the context of neighborhood models that adapt the near neighbor method. In addition, they have conducted an empirical study that shows that the proposed method is better than the standard user-based collaborative filtering approach with a wide range of ratings in areas such as item forecast accuracy and discounted cumulative earnings normalized on F basis. Bulut et al. [9] proposed two new methods for the estimation step, which is the last step of collaborative filtering algorithms. The sparsity of rating matrix is always the major challenge which restricts the performance of collaborative filtering [10]. The cause of this problem is that the vector dimension of users or items is always very large. As the developing of machine learning algorithms, a method called matrix factorization is now the major method to decrease the sparsity of the matrix. Luo et. al. [11] focuses on non-negative matrix factorization (NMF)-based CF development with a single-element-based approach. The main idea is to replace the missing function of the standard distance with the sum of the square-errors and search for a non-negative update process depending on each relevant property parameter, instead of all property matrices. The experimental results in the four large industrial datasets show that their method can take advantage of the computational efficiency over NMF-based CF model. Hernando et. al. [12] presents a new technique for collaborative filtering based proposal systems.
As with the classical matrix multipliers, a vector of the K component is associated with each user and each item. However, unlike the classical matrix multipliers, the components of this vector vary in the range [0, 1], and this change provides significant advantages in the probabilistic sense. It is also the level at which techniques can compete with classical matrix multiplier separation techniques in terms of accuracy in estimates and recommendations. The works in [13,14] can be examined for detailed information.
Another common method is content-based filtering (CBS) algorithms. In this method, when a new product is proposed to the user, the similarity between the user's other products and the new product is checked. Content-based methods use information about the product to make suggestions. This, in turn, makes a great contribution to the proposal of the new product. In [15], a content based book recommendation system was developed. Machine learning has been used for word groups. It has been observed that this approach has the right recommendation. In [16], a method for solving problems arising from natural language ambiguity is proposed. In this method, it is suggested to classify semantic approaches from top to bottom and from bottom to top. This method has not been able to fully solve the problem of the words used according to synonyms and specialization areas. The work in [17] can be examined for detailed information.
The last method we will examine in this section is the hybrid systems. In this system, it is aimed to obtain more efficient results by using existing methods together. In [18], a hybrid system was created by using CF and CBS methods together. [19] suggests a new content-collaborative hybrid system. In the study, the similarity between users is calculated according to the content-based profiles of users. Machine learning is used when semantic profiling is being done. From the results, it is understood that the proposed system made successful estimates. The work in [20] can be examined for detailed information.
3. THE PROPOSED METHOD
In collaborative filtering approaches, data which includes
m
users (𝑢1to um) andn
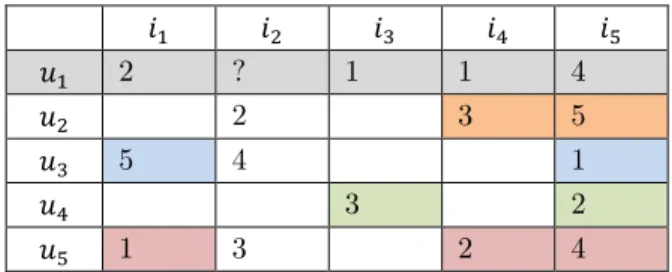
items (𝑖1 to 𝑖𝑛) are converted to a user-item matrix. Table 1 shows a movie
rating-matrix concerning five users and five items. As seen in the table, some values are missing. Here, CF estimates the missing values in these tables and recommend the users the items which the user can like.
Table 1. An example of a user-item matrix. 𝑖1 𝑖2 𝑖3 𝑖4 𝑖5 𝑢1 2 ? 1 1 4 𝑢2 2 3 5 𝑢3 5 4 1 𝑢4 3 2 𝑢5 1 3 2 4
Collaborative filtering algorithms can be analyzed in three stages: similarity function that used, neighborhood selection and estimation of rate.
3.1. SIMILARITY FUNCTIONS
In our preliminary work [1], we proposed a new similarity coefficient, sim(𝑎, 𝑢)[1]. The
formula of similarity coefficient between the active user 𝑢 and the other user 𝑣, can be defined as equation (1) where |𝑢𝑣| denotes the average absolute differences of the ratings for common rated items for both users, 𝑘 denotes a constant. |𝑢𝑣| and 𝑘 can be calculated as in the equation (2) and (3) where 𝐶 denotes the set of common rated items, 𝑅𝑢,𝑖 and 𝑅𝑣,𝑖 denote the ratings of users 𝑢 and 𝑣 on item 𝑖, 𝑈 denotes set of
users who rate for missing item of 𝑢 and have common rated items with 𝑢. The similarity coefficient is inversely proportional to the difference between the persons. The greater sim(𝑢, 𝑣)[1], the more similar the users are to each other.
sim(u,v)[1]= k |uv| (1) |𝑢𝑣| = ∑|𝑢𝑖− 𝑣𝑖| (2) 𝑖 ∈𝐶 k= 1 ∑ 1 |uv| v ∈ U (3)
In this study, besides sim(𝑢, 𝑣)[1], we used Pearson correlation coefficient, cosine
where 𝑅𝑢_𝑚𝑒𝑎𝑛 , 𝑅𝑣_𝑚𝑒𝑎𝑛 denote the averages of all 𝑅𝑢,𝑖 and all 𝑅𝑣,𝑖 respectively; 𝑛
denotes the number of items commonly rated by both users. Pearson correlation coefficient takes a range of values -1 to 1. The closer the value to 1 shows the more similarity between users. Cosine similarity takes a value between 0 and 1.
sim(u,v)Pearson= ∑ (Ru,i-Rumean)(Rv,i-Rvmean) n
i=1
√∑ (Ru,i-Rumean) 2 n
i=1 √∑ (Rv,i-Rvmean)
2 n i=1 (4) sim(u,v)Cosine= ∑n (Ru,i)(Rv,i) i=1 √∑ (Ru,i) 2 n i=1 √∑ (Rv,i) 2 n i=1 (5) sim(u,v)Distance= 1 1+√∑ (Ru,i-Rv,i) 2 n i=1 (6) 3.2. NEIGHBORHOOD SELECTION
Thresholding and 𝑘 nearest neighbors (KNN) are the most used neighborhood selection methods [9]. We applied KNN algorithm to choose most similar users to the active user. In order to choose similar users to the active user, we sort the users in the set of 𝑈 according to similarity coefficients in ascending order. We choose 𝑘 = 5, 𝑘 = 10 and 𝑘 = 𝑚𝑎𝑥. We mean that the number 𝑘 is maximum, we have not limited the 𝑘 to any number. It is the element number of in 𝑈 set (all users who rate for missing item 𝑖 and have common rated items with the active user).
3.3. ESTIMATION OF RATE
In order to estimate missing item’s rate for a user, we first find the user set 𝑈 which described in Section 3.1. Then, we calculate similarity coefficients sim(𝑢, 𝑣)[1] between the active user and these users. After calculating similarity coefficients, we estimate the missing value by using equation (7) in or preliminary work [1].
Ru,i[1]=∑ Rv,i sim(u,v)
[1]
v ∈U
(7)
In this study, we estimate the rates with weighted average as in equation (8). In this calculation, the users’ evaluation criteria are also considered [9].
Ru,i= Rumean+
∑v ∈ U(Rv,i- Rvmean)sim(u,v)
∑v ∈ Usim(u,v)
(8)
4. RESULTS AND DISCUSSION
In this paper, we use MovieLens [21] 100K Dataset. MovieLens data sets were collected at the University of Minnesota by the GroupLens Research Project. There are three sets of data with different number of ratings, i.e. 100K data set contains 100000 points for 1682 movies by 942 users; The 1M dataset includes grading from 3,0209 to 6040 users in 3900 movies; In the 10M data set, 71567 users have a rating of 100,00054 for 106,000 film in. All ratings in the three data sets range from 1 to 5. For the 100K data set, 106 votes are awarded per average user; each user will rate at least 20 movies and each movie is rated 59 times on average. For 1M data, the average vote order for each user and each movie is 166 and 256, 936 per movie in the 140 and 10M data sets per user, respectively. As the data size increases, more ratings are included, but, the densities are 0.063 for a 100K data set, 0.042 for a 1M data set, and 0.013 for a 10M data set. In this respect, 100K data is better than the other two.
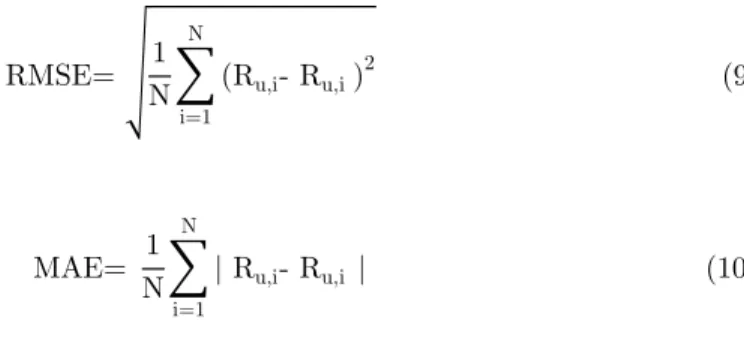
We estimate the score of 1300 videos. Then we compare the estimated and the actual rates with the most popular evaluation metrics; Root Mean Square Error (RMSE) and Mean Absolute Error (MAE) [13]. RMSE and MAE are calculated by equations (9) and (10), where 𝑁 is the number of all data, 𝑅𝑢,𝑖 denotes the real rating value
and 𝑅𝑢,𝑖′ denotes predicted rating value for item 𝑖 by user 𝑢. MAE is the average
absolute difference between the real and predicted ratings. RMSE is the square root of the average square of all errors. It amplifies the large absolute difference between the real and predicted ratings. We measure the estimation accuracy by using both of
them. The lower MAE/RMSE means the predicted ratings are closer to the real rating values. RMSE= √1 N∑ (Ru,i- Ru,i') 2 N i=1 (9) MAE= 1 N∑ | Ru,i- Ru,i' N i=1 | (10)
We first compare rate estimation functions by using our similarity coefficient. In rate estimation, method 1 uses the equation (7) and method 2 uses the equation (8). In method 1, the active user has no contribution to rate estimation, only similar users are used for calculation. In method 2, besides the contribution of similar persons, the weight of the active user is added. Table 2 shows MAE and RMSE values of these methods. It is shown that weighted average calculation (method 2) gives better results. Therefore, we decided to work on with this rate calculation function.
Table 2. MAE/RMSE values when rate estimation function changes
MAE RMSE KNN with K=5 KNN with K=10 KNN with K=Max KNN with K=5 KNN with K=10 KNN with K=Max Method1 0.8309 0.8086 0.8179 1.0769 1.0458 1.0473 Method2 0.7794 0.7723 0.7618 0.9937 0.9844 0.9800
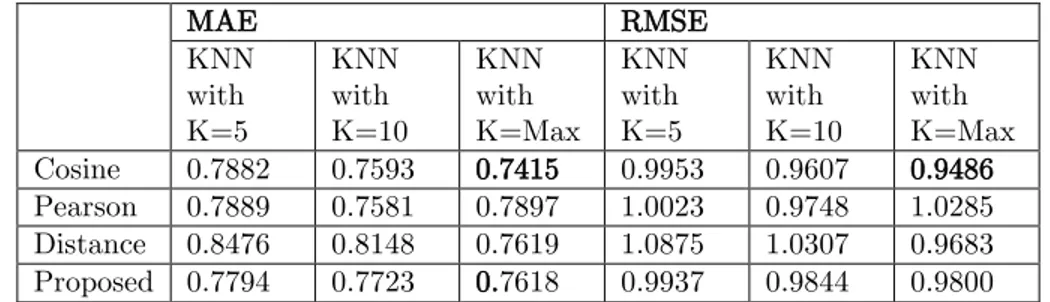
After choosing the rate estimation function, we compare the similarity coefficients and effect of the choosing k similar users with KNN algorithm. Table 3 shows the
results. It is seen that our similarity coefficient outperforms distance similarity and it gets closer performance to other coefficients. It can be concluded that choosing similar users to active user has positive effect as seen in Figure 1 and 2, because when the number of used similar user increases, the lowest MAE and RMSE are obtained. Figure 1 gives the MAE values of similarity coefficients with different number of nearest neighbor on the Movielens-100K data set.
Table 3. Comparison of similarity coefficients and effect of the choosing k similar users MAE RMSE KNN with K=5 KNN with K=10 KNN with K=Max KNN with K=5 KNN with K=10 KNN with K=Max Cosine 0.7882 0.7593 0.7415 0.9953 0.9607 0.9486 Pearson 0.7889 0.7581 0.7897 1.0023 0.9748 1.0285 Distance 0.8476 0.8148 0.7619 1.0875 1.0307 0.9683 Proposed 0.7794 0.7723 0.7618 0.9937 0.9844 0.9800
Figure 1. The MAE values of similarity coefficients with different K-neighbors 0,72 0,75 0,78 0,81 0,84 0,87 N = 5 N = 10 N = max Cosine Pearson Distance Proposed
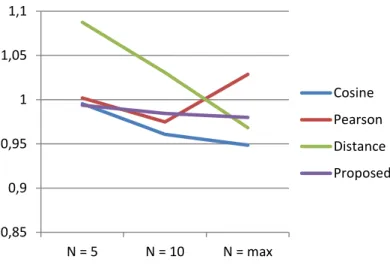
Figure 2. The RMSE values of similarity coefficients with different K-neighbors
5. CONCLUSION
In recommendation systems, collaborative filtering is one of the most widely used methods. In our preliminary work, we proposed a new similarity function to calculate similarities between users. In this study, to get better results, we extended our preliminary work. We included the user weights together with the active user weight. We used MAE and RMSE evaluation metrics to evaluate our study. We observed that our similarity coefficient outperforms distance similarity and it gets closer performance to other coefficients. We also observed that when the number of nearest neighbor increases, it gives better results.
REFERENCES
[1] Sincan, O.M., Yildirim, Z., “Video recommendation system using collaborative filtering”, International Conference on Advances in Science and Arts ICASA'2017, ( 2017). 0,85 0,9 0,95 1 1,05 1,1 N = 5 N = 10 N = max Cosine Pearson Distance Proposed
[2] Goldberg, D., Nichols, D., Oki, B. M., Terry, D. “Using collaborative filtering to weave an information tapestry.” Communications of the ACM, 35/12 (1992) 61-70.
[3] Resnick, P., Iacovou, N., Suchak, M., Bergstrom, P., Riedl, J. “GroupLens: an open architecture for collaborative filtering of netnews.” In Proceedings of the 1994 ACM conference on Computer supported cooperative work, (1994), p. 175-186.
[4] Breese, J. S., Heckerman, D., Kadie, C. “Empirical analysis of predictive algorithms for collaborative filtering.” In Proceedings of the Fourteenth conference on Uncertainty in artificial intelligence, (1998), p. 43-52.
[5] Herlocker, J. L., Konstan, J. A., Riedl, J. “Explaining collaborative filtering recommendations.” In Proceedings of the 2000 ACM conference on Computer supported cooperative work, (2000), p. 241-250.
[6] Yu, K., Schwaighofer, A., Tresp, V., Xu, X., Kriegel, H. P. “Probabilistic memory-based collaborative filtering.” IEEE Transactions on Knowledge and Data Engineering, 16/1(2004) 56-69.
[7] Yang, J. M., Li, K. F. “Recommendation based on rational inferences in collaborative filtering.” Knowledge-Based Systems, 22/1 (2009) 105-114. [8] Adamopoulos, P., Tuzhilin, A. “Recommendation opportunities: improving item
prediction using weighted percentile methods in collaborative filtering systems.” In Proceedings of the 7th ACM conference on Recommender systems, (2013), p. 351-354).
[9] Bulut, H., Milli, M. “İşbirlikçi filtreleme için yeni tahminleme yöntemleri.” Pamukkale Üniversitesi Mühendislik Bilimleri Dergisi, 22/2(2016) 123-128. [10] Gogna, A., Majumdar, A. “A comprehensive recommender system model:
Improving accuracy for both warm and cold start users.” IEEE Access, 3(2015) 2803-2813.
[11] Luo, X., Zhou, M., Xia, Y., Zhu, Q. “An efficient non-negative matrix-factorization-based approach to collaborative filtering for recommender systems.“ IEEE Transactions on Industrial Informatics, 10/2(2014) 1273-1284. [12] Hernando, A., Bobadilla, J., Ortega, F. “A non negative matrix factorization for
collaborative filtering recommender systems based on a Bayesian probabilistic model.” Knowledge-Based Systems, 97(2016), 188-202.
[13] Yang, X., Guo, Y., Liu, Y., Steck, H. “A survey of collaborative filtering based social recommender systems.” Computer Communications, 41(2014) 1-10. [14] Yang, Z., Wu, B., Zheng, K., Wang, X., Lei, L. “A Survey of Collaborative
Filtering-Based Recommender Systems for Mobile Internet Applications.” IEEE Access, 4(2016) 3273-3287.
[15] Mooney, R. J., Roy, L. “Content-based book recommending using learning for text categorization.“ In Proceedings of the fifth ACM conference on Digital libraries, (2000), p. 195-204.
[16] Elahi, M., Ricci, F., Rubens, N. “A survey of active learning in collaborative filtering recommender systems.” Computer Science Review, 20(2016) 29-50. [17] Lops, P., De Gemmis, M., Semeraro, G. (2011). “Content-based recommender
systems: State of the art and trends.” In Recommender systems handbook, (2011), p. 73-105
[18] Semeraro, G., Lops, P., Degemmis, M. “WordNet-based user profiles for neighborhood formation in hybrid recommender systems.” In Hybrid Intelligent Systems, 2005. HIS'05. Fifth International Conference on, (2005), p. 6-pp.
[19] Degemmis, M., Lops, P., Semeraro, G. “A content-collaborative recommender that exploits WordNet-based user profiles for neighborhood formation.“ User Modeling and User-Adapted Interaction, 17/3(2007) 217-255.
[20] Burke, R. “Hybrid recommender systems: Survey and experiments.” User modeling and user-adapted interaction, 12/4(2002) 331-370.
[21] Miller, B. N., Albert, I., Lam, S. K., Konstan, J. A., Riedl, J. “MovieLens unplugged: experiences with an occasionally connected recommender system.” In Proceedings of the 8th international conference on Intelligent user interfaces, (2003), 263-266.
Current Address:
Ozge MERCANOGLU SINCAN: Ankara University, Faculty ofEngineering, Department of Computer Engineering, 06830, Gölbaşı, Ankara, TURKEY
E-mail Address:
:[email protected]
ORCID:
https:// orcid.org/0000-0001-9131-0634
Current Address:
Zeynep YILDIRIM: Ankara University, Faculty of Engineering,Department of Computer Engineering, 06830, Gölbaşı, Ankara, TURKEY E-mail Address: