Carpathian Journal of Earth and Environmental Sciences, February 2019, Vol. 14, No. 1, p. 171 - 180; DOI:10.26471/cjees/2019/014/069
SOIL–AQUIFER INTERACTIONS AND VADOSE ZONE MODELING: AN
EXAMPLE FROM MARAIS POITEVIN (WESTERN FRANCE)
Mustafa Can C
ANOĞLU*
a, Bedri KURTULUS
b& Moumtaz RAZACK
caSinop University, Faculty of Engineering and Architecture, Environmental Engineering Department, TR-57000 Sinop,
Turkey, [email protected]
bMuğla Sıtkı Koçman University, Faculty of Engineering, Geological Engineering Department 48000 Kötekli / Muğla,
cPoitiers University, Sciences Fondamentale et Appliqué, IC2PM Laboratory UMR 7285, Poitiers / France,
Abstract: Water flux in unsaturated zone is one of the most important phenomenon for determining the
recharge characteristics of an aquifer. In-situ measurement and simulation models have been developed in recent years to characterize the recharge process in unsaturated zone. Recently, a mechanistic model named as “AgriFlux” have been adopted to specify the water fluxes in unsaturated zone. In this study, water flows in the unsaturated zone is investigated in order to understand a global interaction of soil-aquifer exchange system and to simulate the water flux leaching from unsaturated zone of soil and capacitance using AgriFlux model. Input parameters of the model were characterized by in-situ measurement and laboratory works. In-situ measurement were done by auger hole and Porchet test at 36 locations. Within laboratory tests, mineralogy of soil samples is characterized by X ray diffraction (XRD) and grain size distribution is determined on the undisturbed soil sampled from study area. The modelling results reveal that a percolated total water flow leaching through the unsaturated zone. The results were also compared with the observed ground water level fluctuations in the aquifer. Consequently, water flow quantification of a soil – aquifer system in Poitevin Marshland signpost the recharge characteristics of Bri Aquifer.
Keywords: AgriFlux model, vadose zone, Poitevin Marshland, soil-aquifer exchanges, Bri
1. INTRODUCTION
Hydrogeological characterization of vadose zone is crucial to assess the water income to an aquifer which represents a complex process involving precipitations, water uptake by plants, evaporation, infiltration, drainage, runoff and percolation. Generally, unsaturated zone models are very useful to forecast short and long term effects of water income and has an aim to minimize the impact on the environment. Among the assessment methods, stochastic model is the most relevant analytical tool due to their ability to simulate of recharge from the vadose zone.
Since 1990s, vadose zone models have become highly developed because of their frequently use in groundwater science (Hansen et al., 1991; Larocque & Banton, 1996; Zheng & Wang, 1999; Vernieuwe, 2006; Wriedt et al., 2007; Bonton et al., 2012). There
are also numerous techniques available for the estimation of water infiltration rate through the vadose zone (Ravi & Williams 1998). AgriFlux Model is a one of the most effective finite-difference mechanistic stochastic model to simulate water and nitrate fluxes leaching from the vadose zone (Banton & Larocque, 1997). AgriFlux is a model that attempts to describe all phenomena by taking into account the spatial variability of the input parameters using their statistical distribution in a Monte Carlo approach (Lasserre et al., 1999). Until now, there are several applications in the literature (Clement, 1997, Flipo et al., 2007a, Flipo et al., 2007b, Polus et al., 2011) of nitrate transport in vadose zone modelling using Agriflux. However, a few of them were used to estimate for water infiltration. The model (AgriFlux) uses a simplified solution of the Richards’ equation (for water flow) with a cubic function to calculate unsaturated hydraulic conductivity (Richard, 1931).
Unsaturated hydraulic conductivity is calculated in the model for each time step as a function of the moisture content for each layer in order to calculate the water flow, from one layer to another, according to the Irmays estimation (Irmay, 1954; Bear, 1988; Dupuy, 1997).
Most studies of water movement in the unsaturated zone have focused also on understanding of soil moisture content variations and their effects on atmospheric boundary layer processes affecting weather and climate (e.g. Manabe, 1969; Ookouchi et al., 1984; Dickinson, 1984; Pielke and Avissar, 1990; Pielke et al., 1991). How much water infiltrates, evapotranspires, and recharges the subsurface depends on the soil moisture content (D’odorico et al., 2000).
AgriFlux is divided up three principal modules; it simulates the water cycle (HydriFlux), nitrogen transformation (NitriFlux) and the fate of pesticides (PestiFlux) in the unsaturated zone. The present AgriFlux application used one of the three modules (PestiFlux and NitriFlux are not used). The module HydriFlux simulates water flow in the unsaturated zone of the soil, including water input (precipitation, infiltration, percolation, and snow melt) and water uptake (water uptake by plants, evaporation, runoff, drainage). In AgriFlux, daily precipitation data are provided by the user or are generated from inter-annual mean statistics (number of days with precipitation, monthly precipitation) (Novak et al., 2002).
The objective of this study is to investigate and to highlight the main process involved in alimentation of Bri Aquifer. For this purpose AgriFlux is utilized as a modelling tool which is a mechanistic stochastic model involving precipitation, runoff, infiltration, evaporation, percolation and drainage. The amount of drained water to determine the alimentation characteristics of Bri Aquifer is also quantified with AgriFlux, in Poitevin Marshland. The computed data simulated by the AgriFlux model and field data handled from the boreholes are compared in order to verify the validity of the vadose zone water flux simulation in Poitevin Marshland (Marais Poitevin) in France.
2. DESCRIPTION OF THE STUDY AREA The study area is located in south west of France called as “Bri Aquifer” which signify the silty/clay deposits in Poitevin Marshland, France. Bri aquifer circulates in the quaternary aged marine deposits. Its soil texture and clay mineralogy are the same, with 45 to 60% clay and more than 95% clay plus silt. Clay minerals consist of illite (50–60%), kaolinite and montmorillonite (20–25%) (Pons et al.,
2000). The Bri formation has a very heterogeneous character; the soil and its hydraulic properties are variable with distance. When the temporal and spatial variability of the region is considered, the required measurements of unsaturated soil hydraulic properties are tremendous, time-consuming, and very expensive (Li et al., 2006).
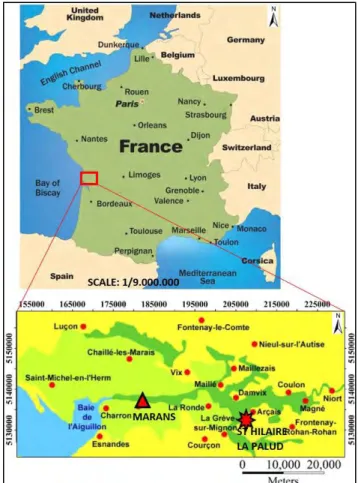
Poitevin Marshland is a most important of all French wetlands with its beautiful nature and tourism potential (Bourcart, 1958). Since 19th century many studies have realized to determine different soil and hydraulic properties of Western Marshlands of France (Marais de l’Ouest de la France) (e.g. Tournade & Bouzillé, 1995; Pons et al., 2000; Weng et al., 2003; Bernard et al., 2006). Poitevin Marshlands (Marais Poitevin) is a small part of Western Marshland of France (Fig. 1). This unit covers an area of approximately 95,000 ha and its climate is coastal-oceanic.
Figure 1. Site location map of the experimental site The field studies were carried out at Marans located between Niort and La Rochelle cities in the west region of France. The climate is coastal-oceanic, with a mean annual rainfall of 780mm distributed through two well-marked seasons: 52% of the rainfall occurs between October and January (Giraud et al., 2000). The average temperature for the April through August 2003 period was 19.4°C and the potential
KV.:'~~":m
NA
Dunk rque Germany LIiie. Belgium ~ne\ ,Che;bo<lrg Rauen Luxembourg Paris Nancy. Strasbourg Austria •Orleans • Nantes Dijon France· Switzerland • Limoges • Lyon Grenoble• Italy Spain 55000 165000 175000 185000 195000 205000 ?15000 2250•
Lu~on • Fonte nay-le-ComteCh11illEl-le11-Marai11
•
• Nleul-sur-l'Autise
• Maltlitzais
0 , Saint~Michel-en•l'Herm
r
.
VixeMaw.• Coulon
I
.& •Oamviz • e N:rt u-i
Bale e - La Ronde• ~ . .-agne de Charron MARA NS La Grev Arc•'-'
, . Frontena
y-l Algull':n su;Mlg: " ' ILAIRlllihan-Rohan Esnandes Courcon lA PALUD
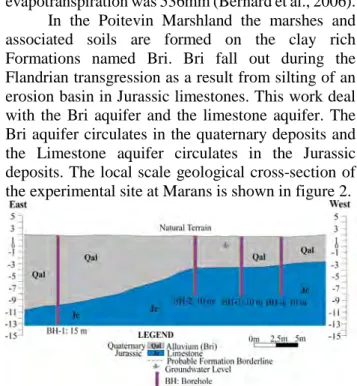
evapotranspiration was 536mm (Bernard et al., 2006). In the Poitevin Marshland the marshes and associated soils are formed on the clay rich Formations named Bri. Bri fall out during the Flandrian transgression as a result from silting of an erosion basin in Jurassic limestones. This work deal with the Bri aquifer and the limestone aquifer. The Bri aquifer circulates in the quaternary deposits and the Limestone aquifer circulates in the Jurassic deposits. The local scale geological cross-section of the experimental site at Marans is shown in figure 2.
Figure 2. Local scale geological cross-section of the study area.
3. METHODOLOGY AND INPUT DATA The AgriFlux model is a mechanistic, stochastic and one-dimensional model based on finite difference approach. Mechanistic concept of AgriFlux procures a physical representation of different process. Through the mechanistic conceptualization, AgriFlux can describe the internal mechanisms of the system (e.g. water flux which is based on physical laws and resolvable with analytical or numerical equations). Stochastic approach includes the notion of spatial variability of parameters and process. Every parameter is represented by its statistical distribution (discrete, uniform, normal, log normal or Beta type) and for each assemblage of simulation the values picked out randomly (Mote-Carlo approach) for the preset statistical distributions. Monte-Carlo method is generally applied to study equilibrium systems in statistics. In AgriFlux Monte-Carlo approach is performed to generate the parameters randomly.
AgriFlux is created as a modular form which enables a large flexibility to use. AgriFlux is divided up three principal modules HydriFlux, NitriFlux and PestiFlux. NitriFlux is created for the simulation of nitrogen transport and the nitrogen cycle in the unsaturated zone of soil. PestiFlux serves to simulate the transformation of the pesticides and its secondary products. The aim of this work is to quantify the soil aquifer exchanges therefore, NitriFlux and PestiFlux are useless. On the other hand HydriFlux is the
essential module for all simulations; water budget (each component of the transport and the water cycle) can be simulated by HydriFlux. Water budget includes the simulation of precipitations, water uptake by plants, evaporation, infiltration, drainage, runoff and percolation.
Percolation represents vertical water movement through the unsaturated zone which aliments the unconfined aquifer. The model determines the water flux in a heterogeneous field by considering the soil profile as homogeneous layers. Each soil layers is defined as a reservoir. The water can accumulate in a soil layer until its total porosity is completely saturated. Water movement from an upper layer through the subjacent layer is possible when the water content of the upper layer attain a value nearby field capacity. Water flux from upper layer through the subjacent layer is determined by unsaturated hydraulic conductivity variation as presented by Irmay (Bear, 1988) (Eq. 1). Water flow velocity is calculated using the integrated finite difference approach of the Darcy-Richard equation (Eq. 2).
(1)
(2)
Where, K(θ) is unsaturated hydraulic conductivity (m/s), Ksat is hydraulic conductivity at saturation
(m/s), θ is water content (m3/m3), θ
res residual water content (m3/m3), n is porosity, H is hydraulic head, h
is relative water pressure and z is depth.
The quantification of soil-aquifer exchanges requires defining numerous parameters. These parameters are grouped into three principal data: 1) Agricultural data 2) Climatic data 3) Pedological data.
Agricultural activities don’t exist on the experimental sites; thence agricultural data are ignored in the model. Climatic data required for the model (AgriFlux) are precipitations, temperatures and evaporation. These data must be specified in the space and the time. In the model climatic data are collected from different stations of the Region.
Principal pedological parameters for every soil layer required by AgriFlux are saturated hydraulic conductivity, porosity, residual water content, wilting point and grain size distribution. For the Pedological datas, physico-chemical characteristics and hydraulic properties of the Bri material are betrayed.
( )
(
(
)
)
3 − − × = res res sat n K K θ θ θ θ( )
− ∂ ∂ ∂ ∂ = ∂ ∂ 1 z h K z t θ θ West LEGEND Q~~~f:?' ~ t!l~~!~~JBri)--_..-Probable Form:uion Oorderli1'e
I
G1111: lloreroundw:ntr hole Level Op1 2-J!!!..jm1
l
:!
-5j'
-7 _q -11 -13 ...J_,,
-3.1. Laboratory analysis (sieve and X ray diffraction analysis)
Physico-chemical characteristics of the Bri material are analysed to determine the mineralogy and to approximate the required pedological data. Mineralogy of Bri is determined by x ray diffraction analyses. The used equipment is a panalytical Xpert diffractometer. It is constituted of goniometer system which fixes the sample. Present principal minerals are identified through their principal reflections.
Moreover, granulometric characteristics of Bri material were analyzed to determine the grain size distribution. Generally, granulometric studies of a material are useful to determine the proportion of the elements, classified by their size category. This study fine grained soils (particle size < 2mm) are analyzed. General application of this analysis realized as drying the soil samples before sieving. However, the material of Poitevin Marshland has a fine granulometric character and its drying (at 24°C normal conditions or 105°C in the oven) drives the sample extremely hard and coherent. Thus, rehydratation of the sample is very difficult at natural conditions.
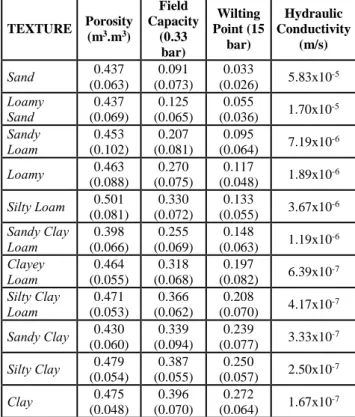
Table 1. Hydrologic properties of soils based on their textural class (Adapted from Rawls & Brakensiek, 1982)
TEXTURE Porosity (m3.m3) Field Capacity (0.33 bar) Wilting Point (15 bar) Hydraulic Conductivity (m/s) Sand (0.063) 0.437 (0.073) 0.091 (0.026) 0.033 5.83x10⁻⁵ Loamy Sand (0.069) 0.437 0.125 (0.065) 0.055 (0.036) 1.70x10 -5 Sandy Loam (0.102) 0.453 0.207 (0.081) 0.095 (0.064) 7.19x10 -6 Loamy 0.463 (0.088) 0.270 (0.075) 0.117 (0.048) 1.89x10 -6 Silty Loam (0.081) 0.501 (0.072) 0.330 (0.055) 0.133 3.67x10⁻⁶ Sandy Clay Loam (0.066) 0.398 0.255 (0.069) 0.148 (0.063) 1.19x10 -6 Clayey Loam (0.055) 0.464 0.318 (0.068) 0.197 (0.082) 6.39x10 -7 Silty Clay Loam (0.053) 0.471 0.366 (0.062) 0.208 (0.070) 4.17x10 -7 Sandy Clay (0.060) 0.430 (0.094) 0.339 (0.077) 0.239 3.33x10⁻⁷ Silty Clay (0.054) 0.479 (0.055) 0.387 (0.057) 0.250 2.50x10⁻⁷ Clay 0.475 (0.048) 0.396 (0.070) 0.272 (0.064) 1.67x10 -7
*The value entered between parentheses is the standard deviation
Furthermore, sieve analysis gives the essential parameters (grain size distribution) to define all of the soil parameters in the model by the table proposed by
Rawls & Brakensiek (1982) (Table 1). And the model necessitates in situ soil properties. Therefore, sieve analysis was realized with undisturbed soil samples, without drying process.
The soil fraction which is greater than 50µm is sieved. And for the fraction smaller than 50 µm, laser granulometer machine (MALVERN IP 100) is used. The principle of this instrument is based on the analysis of the diffraction pattern of a laser beam created by particles in the suspension which includes the fraction smaller than 50µm. This tool directly measures the amount of particles in the suspension and indicates their size distribution (from 0.1 µm to 50 µm). Clay (< 2 µm), fine grained silt (from 2 to 20 µm) and coarse grained silt (from 20 to 50 µm) particles belong to this size range.
3.2. Variable head Porchet tests
Porchet test is one of the in situ methods to determine the hydraulic conductivity at saturation in the unsaturated zone of the soil. Mathematical exploitation of Porchet test is based on the hypothesis that the media is homogeneous and isotropic and the water flows with a hydraulic gradient of 1. This hypothesis is verified only when the fringe area of the auger hole is completely saturated. These two conditions are rarely presented in the nature thence treated results are approximate values.
In this work, variable head Porchet test is applied on 36 representative points. This method is preferable to determine the saturated hydraulic conductivity of a large area on the field. Variable head Porchet method consists of boring a hole to a given depth, filling it with water and measuring the rate of fall of the water level. Hydraulic conductivity at saturation (Ksat) is characterized by the “time – log (r/2+h)” curve (Fig. 3).
Figure 3. Representation of “time – log (r/2+h)” curve for the hole “T1-1”
Representative line of the “time – log (r/2+h)” curve is considered to determine the slope (E.g. for the hole T1-1 slope is 3*10-6). Then hydraulic conductivity
Time (s) 5000 1 0000 15000 20000 25000 0,80 + - - - + - - - < - - - - + - - - + - - - < 0,35 - _l_ __ J_ _ _ _l _ _ _ l __ _ I I I
l
0,90- -+- - -+-
--+---
!
-0,95
·~·_.+-
-
-+-
-i---
l
---1 ,00 __ l_-.--•
± •
__l I -1 I I ... I Y=3*W-' X + 0 9482 1 ,05 J - - - + - - - < - - - - + - - - + - - - _ _ _ ,to saturation calculates by the equation 3:
(3)
Where, r is radius of auger hole, tan α is slope of representative line. Comparing hydraulic conductivity values treated from the soil texture proposed by Rawls & Brakensiek (1982) and the Porchet tests results is useful to bring to light the conformity of hydraulic conductivity values based on the soil texture (Table 1).
3.3. Modelling scenarios
The main objective of the study is to evaluate the model results in comparison with field measurements. The simulations were effectuated for period of 4 years comprise from 1 January 2003 to 31 December 2006.
The unsaturated zone of soil is discretized in 4 layers which the thickness raises with the depth. Soil profile is simulated until 1.5m depth with a view to cast all of the pedological horizons. The depths of first and second layers are considered 0.25m and the third and the fourth layers are considered 0.50m.
The pycnometer analysis realized by Bernard et al., (2006) in Poitevin Marshland indicate that the dry apparent density of Bri is about 2.58 g /cm3. And
the total porosity values are defined in the model (AgriFlux) by the graphic (Fig. 4) proposed by Bernard et al., (2006).
Figure 4. Evolution of the total porosity with the depth Meteorological data were obtained from the weather stations at Beauvoir sur Niort and Cramchaban (figure 1). And for the pedological data, grain size distribution is characterized (Fig. 5 and Table 1).
First simulations indicate that the model is very sensitive to the variation of residual water content. This parameter serves to characterize the unsaturated hydraulic conductivity by the cubic relation of Irmay with a view to determine the infiltration from upper layer to lower layer. This mathematical relation considers that the residual water content is equivalent to the field capacity. Consequently, the value of residual water content (θr) must be between the field
capacity (θcap) and the wilting point (θwp) values.
Therefore, as the utilized model AgriFlux is very sensitive to the residual water content, the simulations were realized for three different scenarios to test the different values of residual water content, comparing with the values proposed by Rawls and Brakensiek (1982): (1) Scenario 1 :
θ
rθ
capθ
wp 3 1 3 2 + ≈ (2) Scenario 2 :θ
rθ
capθ
wp 2 1 2 1 + ≈ (3) Scenario 3 :θ
r ≈θ
capIn the present case, first scenario corresponds to the table 1. Testing these scenarios in the model will betray the reliability of the Rawls and Brakensiek’s proposition (1982).
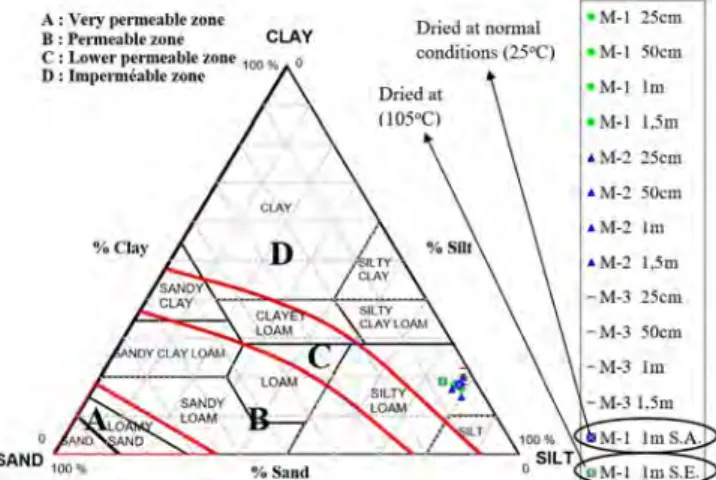
Figure 5. Representation of the grain size distribution (with and without drying) and the relation between the
grain size and permeability at Marans 4. RESULTS
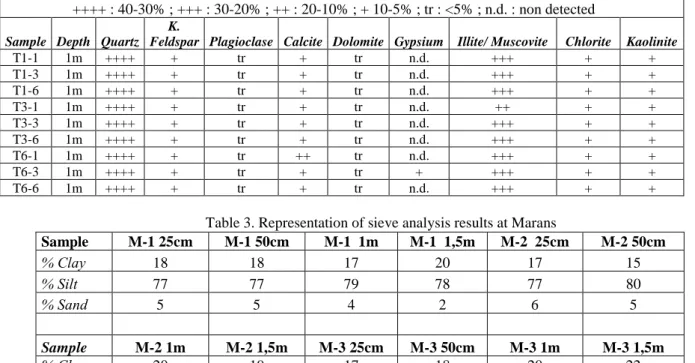
X ray diffraction analysis displays the mineralogical composition of Bri material. Synthesis of the mineralogical results is represented at Table 2. The mineralogy of the study area is very heterogeneous. Quartz and illite are the major constituents. The feldspar and the calcite constitute respectively less than 5-10 % of the material as chlorite and kaolinite. Any trace of swelling mineral such as smectite wasn’t observed. Finally only sample T6-3 contain gypsium (5 to 10%).
Sieve and granulometric analysis are realized to determine the clay percentage “%C”, silt percentage “%S” and sand percentage “%Sd” of the soils sampled from all auger holes (M-1, M-2, M-3) for each soil layer (0.25m, 0.50m, 1m, 1.5m) at Marans. The grain size distribution of each soil samples at Marans is represented in Table 3.
α tan 2 3 . 2 r Ksat × = 0 10 20 40 50 00 0
..
•-• -• 100
.
• 1!:D 200 Depth (cm)A : Very penur-able ione
B : Penneable :zone CLAY C: Lowe:t· 1,ermc.1ble z<rnt 100111 0 0: lmpermbble zonc, 70 Porosity (%) • Total porosity ~ •
•
Dried at nonnal condi1ions (25 •MTI 25cm M-1 50cm M-1 Im •M-1 Um • M·1 ~Scru •M-2 50cm •M-2 Im •M~l UmTable 2. Representation of major mineral quantity in the samples
Table 3. Representation of sieve analysis results at Marans
Undisturbed grain size distribution at St Hilaire la Palud shows off the same characteristics with Marans. At the experimental sites (Marans) the dominant character is silty loam (≈ 75%), the sample includes a small amount of clay (< 20% average) and very poor for the sand fraction (%5 average). According to the textural classification of Rawls & Brakensiek (1982), analyzed samples are in the domain of “silty loam”. This domain corresponds to permeability very feeble nearby impermeable (Fig. 5).
So, analyze of the sample “M-1 1m” after drying at normal conditions (25°C) “M-1 1m S.A.” and at 105°C “M-1 1m S.E.” is realized to characterize the drying impact on the results (Fig.5 and Table 4).
In these analytical conditions (especially drying at 105°C), percentage of fine fraction (clay) don’t change. But percentage of silt fraction decreases in aid of the percentage of the silt fraction. Consequently, on the studied horizons, drying process drives the samples to the aggregate formation which falls under the sand domain.
The results emphasized in figure 5, broach two hypotheses which can explain this behavior. So,
drying:
1) Collapse the fine grained particles and reduce the porosity which rehydrates the sample.
2) Drives to the formation of strong liaisons between the particles with an irreversible reaction which avert the rehydratation of the aggregates (in the sand fraction).
In conclusion, grain size distribution doesn’t change considerably despite the drying process. On the other hand, drying at 105°C, cause a little movement from impermeable zone through the lower permeable zone (Fig. 5). That means, rehydratation cycles in terms of geological periods, can change the grain size distribution of the aggregates in Poitevin Marshland.
The Porchet tests results made on the experimental site at Marans indicate that there isn’t an important variation of hydraulic conductivity (K). In such a case, required hydraulic conductivity data for the AgriFlux model represents the entire experimental site at Marans (Table 5).
Therefore, hydraulic conductivity at Marans is approximately “2x10⁻⁶ m/s” and these results
correspond to the proposition of Rawls & Brakensiek (1982) (Tables 1 and 5). So, it’s acceptable to use the proposed hydraulic conductivity values at table 1 for the AgriFlux model for the experimental site.
The simulation results confirm the importance of residual water content parameter for different scenarios in the model. Generally, curves of cumulated water flux of first scenario are nearby the ++++ : 40-30% ; +++ : 30-20% ; ++ : 20-10% ; + 10-5% ; tr : <5% ; n.d. : non detected
Sample Depth Quartz K.
Feldspar Plagioclase Calcite Dolomite Gypsium Illite/ Muscovite Chlorite Kaolinite
T1-1 1m ++++ + tr + tr n.d. +++ + + T1-3 1m ++++ + tr + tr n.d. +++ + + T1-6 1m ++++ + tr + tr n.d. +++ + + T3-1 1m ++++ + tr + tr n.d. ++ + + T3-3 1m ++++ + tr + tr n.d. +++ + + T3-6 1m ++++ + tr + tr n.d. +++ + + T6-1 1m ++++ + tr ++ tr n.d. +++ + + T6-3 1m ++++ + tr + tr + +++ + + T6-6 1m ++++ + tr + tr n.d. +++ + + Sample M-1 25cm M-1 50cm M-1 1m M-1 1,5m M-2 25cm M-2 50cm % Clay 18 18 17 20 17 15 % Silt 77 77 79 78 77 80 % Sand 5 5 4 2 6 5 Sample M-2 1m M-2 1,5m M-3 25cm M-3 50cm M-3 1m M-3 1,5m % Clay 20 19 17 18 20 22 % Silt 78 78 79 79 78 77 % Sand 2 3 4 3 2 1
Table 4. Sieve analysis results of dried samples Sample M-1 1m S.A. M-1 1m S.E.
% Clay 18 19
% Silt 78 74
% Sand 4 7
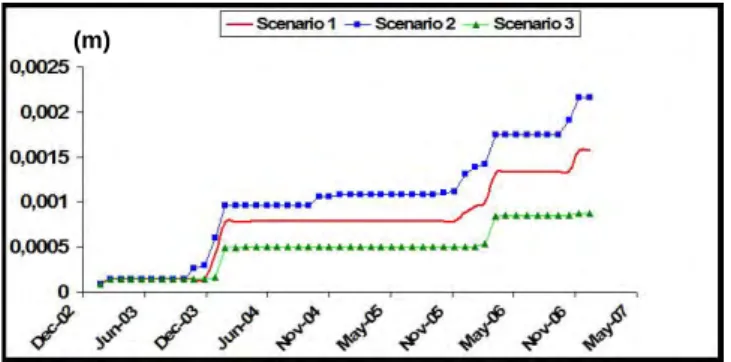
reality, because they are always between the curves of second and third scenario (Figs. 6, 7, 8).
Table 5. Porchet tests results at the experimental site in Marans (K in x10-7m/s) T1-1 T2-1 T3-1 T4-1 T5-1 T6-1 3,01 10,00 20,00 10,00 20,00 10,00 T1-2 T2-2 T3-2 T4-2 T5-2 T6-2 10,00 10,00 10,00 6,02 30,10 20,00 T1-3 T2-3 T3-3 T4-3 T5-3 T6-3 20,00 20,00 30,10 30,10 20,00 10,00 T1-4 T2-4 T3-4 T4-4 T5-4 T6-4 10 9,03 9,03 20 21 20 T1-5 T2-5 T3-5 T4-5 T5-5 T6-5 2,00 2,00 2,00 2,00 2,00 1,00 T1-6 T2-6 T3-6 T4-6 T5-6 T6-6 2,00 2,00 2,00 2,00 1,00 1,00
The observed simulation curve for the first scenario (θr=2/3 θcap+1/3 θpf) echoes globally the
percolated water quantity (Figure 6) laundering, soil aquifer exchanges characteristics are determined. According to the findings, during the given period (from 01/01/2003 to 31/12/2006) percolated water amount which aliment Bri Aquifer is 60cm, as well as water amount of runoff is 12cm. On the other hand, water quantity accumulated in the artificial drains is very poor (Figs. 6, 7, 8).
Meteorological data (rainfall and potential evapotranspiration “ETP”) taken from IIBSN for the simulation period (from 01/01/2003 to 31/12/2006) marks a drought at 2005 (Table 6). This drought appears on the cumulative water elevation curves with their low slope (Figs 6, 7, 8).
Figure 6. Cumulative drained water elevation for three different scenarios
Water-mass balance adequacy between the simulated results and the observed ground water fluctuation results in the Bri aquifer constitute a
preliminary necessity to the characterization of soil- aquifer exchanges. In this way, validity of defined parameters in the model is tested. Therefore, available field observation data (from August 2005 to January 2007) at the experimental site are compared with the simulation curves for the cumulative percolated water elevation (figures 9 and 10). Used material for the groundwater level observation is “Nivemac 98 S*S-4” produced by Hydroemac materials Auteg.
Figure 7. Cumulative percolated water elevation for three different scenarios
Figure 8. Cumulative run-off water elevation for three different scenarios
Table 6. Annual ETP and rainfall values at Beauvoir sur Niort meteorological station from 2003 to 2006.
Rainfall (mm) ETP (mm)
2003 742.7 958.6
2004 729.2 767.2
2005 590.1 860.9
2006 857.6 787.8
The correlation coefficient (ρ) is determined to underline the relation between the simulated and the observed data. The correlation coefficient is a measure of the strength of the linear relationship between two interval data variables. Correlation coefficient between the simulation of percolated water flux (Fig. 9) and the observation of ground water level variation in the Bri Aquifer at Marans (Fig. 10) is ρsimulated-observed at Marans = 0, 87. Therefore,
ground water level variation at Marans (Fig. 10) is highly correlated to the simulation of percolated water flux (Fig. 9).
On the other hand, simulation of percolated
(m) (m) (m) 0,0025 0,002 0,0015 0,001 0,0005 I I I I I I I I I I I I I I I I I I I I I I I I I I I I I I I I I I I I I I I I I I I I I I I I I I I I I I I I I I I I
I- Scenario 1 ~ Scenario 2 __,.._ Scenario 3 I
0,9 0,8 0,7 0,6 0,5 0,4 0,3 0,2 0,1 · 0,18 0,16 0,14 0,12
/r
__...--
...
. ....
~..
-
/' 'I- Scenario 1 ---Scenario 2 ---Scenario
31
0,1 0,08 0,06 0,04 0,02 o~~~~-~~~~-~~ / ),>/' / ),><'c!' /
~.f'
~p
~.f
~p ~'
178
w ate r f lu x c u rv e f ea tu re a s tr o n g s im ila rity w it h th e obs er v at ion of gr o un d w at er l eve l va ria tio n c ur ve s (F igs . 9 and 10 ). T ha t m ea ns , t he B ri A qu if er i s al im ent ed by onl y t he s ur fa ce w at er s. F ur th er m or e, o n t he ba si s of ob ta ine d r es u lts , d ef in ed p ar am et er s i n t h e m o d el r ef lec t t h e r ea lit y an d the m ode l w or k pe rf ec t. S o, hy dr aul ic pr op er tie s of so ils b ased o n t h ei r t ex tu ra l cl ass p ro p o sed b y R aw ls & B ra k ens ie k ( 198 2) i s c on for m abl e w ith t he r ea lit y . F ig ur e 9 . S im u la tion of pe rc ol at ed w at er f lu x f ro m A ugu st 2005 t o J an u ar y 2007 Fi g ur e 1 0 . O b se rv at ion of g roun d w at er l ev el va ria tion in t he B ri A q u if er a t M ar ans fr o m A u gu st 2005 t o J anu ar y 2007 5. CO NCL US IO N A g ri F lux m ode l i s pe rf o rm ed i n thi s s tudy t o si m u lat e t h e tem p o ral v ar ia tio n s o f p er co lat ed w at er am ount i n u ns at ur at ed z one o f s o il i n o rde r to com pa re s im ul at ed da ta w ith g roundw at er fl uc tua tions . T h is c om pa ra tiv e s tudy i ndi ca te s t ha t t h e re su lts ob ta ine d f rom s im ul at ion and fr om t he obs er v at ion a re i de n tic al a n d t he a de qua cy i s g loba lly sat isf ac to ry b et w een t h e w at er e lev at io n s o f ea ch scen ar io . A d d it io n ally , th e g ra in s iz e d is tr ib u tio n d ete rm in ed w ith in th e la b o ra to ry s tu d ie s is s im ila r f o r al l sam p les t ak en fr o m th e ex p er im en ta l si te (M ar an s) . T h e m aj o r g rai n si ze i s si lt an d th e ch ar act er o f t h e s am p les is si lty l o am . S o , t h e g ra in si ze d is tr ib u tio n is g en er al iz ed fo r a ll P o it ev in M ar shl and re g ion. O n the o the r ha nd, d ry ing pr oc es s b et ray t h e im p act o f re h y d rat at io n cy cl es in a g eol og ic al pe riods poi nt of v ie w . C ons eque n tly , he te rog ene ity of P oi te v in M ar shl and a nd the f is sur es g en er at ion n ot ic ed by B er n ar d e t al ., (200 6) m ay be an ef fec t o f t h e d ry in g o f P o itev in M ar sh lan d a s hum an a ct io n. F ur th er m or e, d roug ht a t 2 005 a p pe ar s on cu m u lat iv e w at er e lev at io n cu rv es w ith t h ei r feeb sl ope s ( F igs . 6 , 7, 8 ). S o, tha t obs er v at ion c an b e a ar g um ent of a lim ent at ion of B ri A qu if er by t su rf ace w at er s. A n d th e g ro u n d w at er l ev el o b ser si nc e A ug us t 200 5 r ea ct w el l w ith the s tr ong r ai nf pe riod ( F ig . 7 ). T h e si m ila rit y b et w ee n t h e o b se rv and t he s im ul at ed cu rv es at tes ts t h e so u rce o f t h e A qui fe r i s t he s u rf ac e w at er s in th e e x p er im en ta l at M ar an s ( F igs . 9 and 10 ). M or eov er , th e rech ar g e an d d isc h ar ch ar act er is tic s o f th e B ri aq u if er i s in v est ig at ed w th e a n al y si s o f t h e i n fil tr at io n p ro ces ses o f t h e v ad zone . G roundw at er fl ow sy st em i s not pr o ce ss inde p ende n tly f rom t he w at er f lu xe s of t he v ados zone . T he o bt ai ne d re sul ts show s tha t ex p er im en tal si te i s a r ec h ar g e ar ea c o n ce rn in g t g roundw at er f low s y st em . F ig ur e 10 r ef le ct s t he g roun dw at er f luc tua tions for a pe riod o f 2 y ea rs due t o the da ta a cc es si bi lit T h is pe ri o d of obs er v at ion is n o t su ff ic ien t f o r a long ter m a n al y ze t o u nde rs ta n d t h e g ene ra l be ha v ior the g roundw at er f low s y st em of t he s tudy a re a. C om pa ri son o f s im ul at ed da ta a nd f m easu rem en ts r ev ea ls t h at the m ai n f ac tor inv ol v ed i so il -aq u if er ex ch an g es in t h e P o itev in Ma rsh lan st ru ct u red so ils i s t h e re si d u al w at er co n ten t. T stu d y u n d er lin es th e s im ila rit y b etw ee n th e sim u la and obs er v ed w at er p er col at ion da ta ov er l ong pe riods of t im e i s a n im por ta n t f ind ing . In a ddi tion, i t s h oul d be c o ns ide re d t h at the si tu m easu rem en ts a n d so il sam p lin g h av e b car ri ed o u t a t l o ca l sca le. F o r t h is r easo n , t h e res shoul d be e v al ua te d i n i ts el f in t er m s of i nf lue ar ea . T he a p pr o ac h de v el op ed in t h is s tudy s ee pr om is ing . H ow ev er , it shoul d be f ound m pi ez om et ri c ob se rva tion p oi n ts f or B ri A q u if er w the ir i nt eg ra tion to t h e m ode ling r es u lts i n te rm s of fu tu re st u d ie s. R EF ER EN C ES B an ton , O . & L a ro cq u e, M ., 1 997 . A griF lu x 2. 0 Logi cie l d’ év al uat ion de s pe rte s e nv ironne m ent de nitr ate s et pe stic id es ag ric ole s . INR S -E Q u éb ec, C an ad a. B ea r, J ., 1 988 . D ynam ics of flui ds in por ous m edi a. D ov publ icat ions , In c., N e w Y o rk , U S A . B er na rd, M ., D udo ig no n , P., C h ev a lli er , C ., & Po n s, Y 2006. Shr ink age a nd su bs ide nc e i n a m ar sh soi M eas ur em ent s and pr elim inar y m ode l. S o il S cie S o ci et y o f A m er ica J o u rn al , 70, 18 34 -184 2 . B o n to n , A ., B o u ch a rd , C ., R o u le a u , A ., R o d ri g u ez , M J. & T h erri en , R ., 201 2. Cal ibr at ion and (c m ) (c m ) ~ ~ ~ ~:g
~ ~ tin,l !ll ~ iUl 8: 8 ~ 0 Jul-05 Jul-05 Aug-05 Aug-05 Sep-05 Sep-06 0::1-05 Oct-05 Nov-05 Nov-05 Deo-05 Dec-05 Jan-06 Jan-06 Feb-06 Feb-06 Mao-06 Mar-06 Apr-06 Apr-06 May-06 May-06 Jun-06 Jun-06 Jul-06 Jul-06 Aug-06 Aug-06 Sep06 Sep-06 0::1-06 Oct-06 No\l-06 Nov-06 Deo.Q6 Deo-06 Jan-07 Jan-07 Feb-07 Feb-07validation of an integrated nitrate transport model within a well capture zone. Journal of Contaminant
Hydrology, 128, 1-18.
Bourcart, J., 1958. Le littoral de La Tranche (Vendée) à
l’Ile Madame (Charente Maritime). Bulletin de la
Société Géologique de France, 3, 393-7.
Clement, T. P., 1997. RT3D A modular computer code for
simulating reactive multispecies transport in 3-dimensional groundwater systems. Pacific
Northwest National Laboratory, Richland, Washington, USA.
D’Odorico, P., Ridolfi, L., Porporato, A. & Rodriguez-Iturbe, I., 2000. Preferential states of seasonal soil
moisture: The impact of climate fluctuations. Water
Resources Research, 36 (8) 2209-2220.
Dickinson, R. E., 1984. Modelling evapotranspiration for
three dimensional global climate models.” Climate Processes and Climate Sensitivity. Geophys.
Monogr. Ser., Vol. 29. AGU, Washington, DC, 58– 72.
Dupuy, A., 1997. Simulation de la contamination diffuse
des eaux souterraines par les nitrates à l’échelle du basin versant. Thèse de 3ème cycle, Université de Poitiers, 237 pp.
Flipo, N., Even, S., Poulin, M., Théry, S. & Ledoux, E.,
2007(a). Modeling nitrate fluxes at the catchment
scale using the integrated tool CAWAQS. Sci. Tot.
Env., 375, 69-79.
Flipo, N., Jeannee, N., Poulin, M., Even, S. & Ledoux, E., 2007(b). Assessment of nitrate pollution in the
Grand Morin aquifers (France): combined use of geostatistics and physically-based modelling.
Environmental Pollution, 146 (1), 241-256.
Giraud, F., Lachassagne, P., Ladouche, B., Weng, P. H., Pinault, J. L. & Chevallier, C., 2000. Etude
hydrologique et hydrogéologique du marais de Rochefort (Charente-Maritime), Report
RP-50247-FR. Burreau des Recherche Geologique et Minieres, Orléans, France.
Hansen, S., Jensen, H. E., Nielsen, N. E. & Svendsen, H., 1991. Simulation of Nitrogen Dynamics and
Biomass Production in Winter-Wheat Using the Danish Simulation-Model Daisy. Fertilizer
Research, 27, 245-259.
Irmay, S., 1954. On the hydraulic conductivity of
saturated soils. Transactions American
Geophysical Union, 35, 463-468.
Larocque, M. & Banton, O., 1996. Using field data and
simulation modeling to determine nitrogen cycle parameters. Soil Science Society of America
Journal, 60, 1840-1845.
Lasserre, F., Razack, M. & Banton, O., 1999. A
GIS-linked model for the assessment of nitrate contamination in groundwater. Journal of
Hydrology, 224, 81-90.
Li, Y., Chen, D., White, R. E., Zhu, A. & Zhang, J.,
2006. Estimating soil hydraulic properties of
Fengqiu County soils in the North China Plain using pedo-transfer functions. Geoderma, 138,
261-271.
Manabe, S., 1969. Climate and the ocean circulation: The
atmospheric circulation and the hydrology of the Earth’s surface. Monthly Weather Review, 97,
739–774.
Novak, S. M., Banton, O. & Schiavon, M., 2002.
Modelling metolachor exports in subsurface drainage water from two structured soils under maize (eastern France). Journal of Hydrology, 270
(3-4), 295-308.
Ookouchi, Y., Segal, M., Kessler, R. C. & Pielke, R. A.,
1984. Evaluation of soil moisture effects on the
generation and modification of mesoscale circulations. Monthly Weather Review, 112, 2281–
2291.
Pielke, R. A. & Avissar, R., 1990. Influence of landscape
structure on local and regional climate. Landscape
Ecology, 4, 133–155.
Pielke, R. A., Dalu, G., Snook, J. S., Lee, T. J. & Kittel, T. G. F., 1991. Nonlinear influence of mesoscale
land use on weather and climate. Journal of
Climate, 4, 1053–1069.
Polus, E., Flipo, N., De Fouquet, C. & Poulin, M., 2011.
Geostatistics for assessing the efficiency of distributed physically-based water quality model; Application to nitrates in the Seine River. Hydrol.
Process., 25, 217-233.
Pons, Y., Capillon, A. & Cheverry, C., 2000. Water
movement and stability of profiles in drained, clayey and swelling soils: at saturation, the structural stability determines the profile porosity.
European Journal of Agronomy, 12, 269-279.
Ravi, V. & Williams, J. R., 1998. Estimation of
infiltration rate in the vadose zone: Compilation of simple mathematical models. Subsurface Protection
and Remediation Division National Risk Management Research Laboratory Ada, OK 74820, 26.
Richards, L., 1931. Capillary conduction of liquids
through porous mediums. Physics, 1, 318-333.
Rawls, W. J. & Brakensiek, D. L., 1982. Estimating soil
water retention from soil properties. ASCE Journal
of Irrigation and Drainage, 108(IR2), 166–171.
Tournade, F. & Bouzille, J. B., 1995. Déterminisme
pédologique de la diversité végétale d’écosystème prairaux du Marais Poitevin Application à la définition d’une gestion agri-environnementale.
Etude et Gestion des Sols, 2 (1), 57-72.
Vernieuwe, H., Verhoest, N. E., Bate, B., Hoeben, R. & Troch, F. P., 2006. Cluster-based fuzzy models for
groundwater flow in the unsaturated zone.
Advances in Water Resources, 30, 701-714.
Weng, P. H., Giraud, F., Fleury, P. & Chevallier, C.,
2003. Characterising and modelling groundwater
discharge in an agricultural wetland on the French Atlantic coast. Hydrology and Earth System
Science, 10, 33-42.
Wriedt, G., Spindler, J., Neef, T., Meissner, R. & Rode, M., 2007. Groundwater dynamics and channel
concentrations in a lowland catchment system.
Journal of Hydrology, 343, 154-168.
Zheng, C. & Wang, P. P., 1999. A modular
three-dimensional multispecies transport model for
simulation of advection, dispersion and chemical reactions of contaminants in groundwater systems.
Documentation and user's guide. U.S. Army Corps of Engineers, Washington, DC., USA.
Received at: 05. 06. 2018 Revised at: 31. 10. 2018
Accepted for publication at: 25. 10. 2018 Published online at: 05. 11. 2018