CAUSAL RELATIONSHIPS BETWEEN
FINANCIAL AND ECONOMIC
DEVELOPMENT IN GULF COUNTRIES
Gürsoy, Cudi Tuncer
D oğuş University
Al-Aali, Hassan, MBA
Arab Banking Corporation,Bahrain
Abstract: This paper examines the causal relationships between financial and economic aggregates in three G ulf countries, Bahrain, Kuwait, and Saudi Arabia, over the 64-quarterly period from 1973 to 1988.Patrick’s causality patterns at different stages o f economic development were also investigated by dividing the entire analy-sis period into the sub-periods o f 1973-81, and 1982-88. Financial variables used were M1, M2 and the total bank credits. Exports in all the three countries plus government expenditures in Kuwait were employed as proxies to GDP.
Sims' causality model which is based on G ranger’s definition was utilized and the following general patterns were detected: For the entire analysis period causality ran from financial to economic variables in Kuwait, but from economic to financial varia-bles in Bahrain. W hile no generalization was possible for Saudi Arabia for the first sub-period (l973-81), a supply-leading phe-nomenon was dominant in Bahrain and Saudi Arabia. In Kuwait the results were mixed. In the second sub-period (1982 88), the dominant relationship was dem and following in all the three countries. These results were seen in conformity with the economic trends in these countries over the study period.
Key words: Financial D evelopm ent, G u lf Countries, Causality test
Özet: Bu makale üç körfez ülkesi olan Bahreyn, Suudi Arabistan ve Kuveytte 1973 1988 yılları arasındaki 64 üç aylık dönem boyunca finansal ve ekonomik büyüklük ler arasındaki nedensellik ilişkilerini irdelemektedir. Patrick’in gelişmenin farklı aşa malarındaki farklı nedensellik ilişkileri savı da analiz döneminin 1971-81 ve 1982 88 alt dönemlerine bölünmesi suretiyle sınanmaktadır. Araştırmada kullanılan finan sal değişkenler M1, M2 ve toplam banka kredileri; ekonomik değişkenler ise her üç ülke için toplam ihracat, Kuveyt için ise ayrıca kamu harcamalarıdır.
Araştırmada Granger’in nedensellik tanımına dayanan Sims modeli kullanılmış ve şu ge nel eğilimler saptanmıştır : Analiz döneminin tümü için nedensellik ilişkisi Kuveyt’te fi nansal değişkenlerden ekonomik değişkenlere doğru, Bahreyn’de ise ekonomik değiş kenlerden finansal değişkenlere doğrudur. Suudi Arabistan için genelleme olanağı bulu namamıştır. 1973-81 alt döneminde Bahrain ve Suudi Arabistanda arz güdümlü ilişki saptanmış, Kuveytte ise net bir nedensellik ilişkisi görülememiştir. İkinci alt dönem olan 1982-88 döneminde ise her üç ülkede de talep güdümlü ilişki gözlenmiştir. Bu bulgular her üç ülkede 1973-1988 dönemindeki genel ekonomik gelişmelerle uyumludur.
I. INTRODUCTION
The purpose of this article is to investigate the im pact o f financial deepening on economic development in three G ulf coun-tries, Saudi Arabia, Kuwait and Bahrain, over the years 1973 through 1988. Huge amounts o f petro-dollars flowing into these countries during the seventies, and the resulting financial deepening in a relatively short period of time provide for, we believe, a unique case worth to study in expectation of making some contribution to the findings o f earlier empirical works on the relationships between financial and economic development.
Various scholars have extensively studied the topic since the early sixties. Some of these studies provided theoretical support for the leading role of financial development in real economic development (Hooley 1963, Patrick 1966, Khatkhate 1972 and 1982, M cKinnon l973, Bhatia and Khatkhake l975, Galbis 1977, and Drake 1980). These conclusions were clearly contradictory with some earlier theories of economic development, which, as argued by Shaw (1973), were almost designed for a barter world. In those theories, financial deepening was seen passively adaptive to real economic development. Some extremists went even further to suggest repressive financial policies for higher rates o f real economic growth. Determining the causal relationship between financial and econom-ic development in practice is not an easy task at all. This is why some leading researchers either appear to take a neutral position by just saying that financial and economic development go hand in hand (Goldsmith 1969}, or find it satisfactory to distinguish between two possible phenomena of financial develop-ment, demand-following and supply-leading, which may exist at different stages of the developm ent process(Patrick 1966).
Econom etric studies of causal relationship between financial and economic development mostly employ either the Granger(l969), or Sims(1972) test. Granger's definition of causality for temporal systems is adopted by the researchers not because it is the best definition of causation in philosophical sense, but simply be-cause there seems to be no alternative definition which can be empirically and conveniently tested. According to Granger the variable x causes the variable y, if future values of y can be better predicted by using all available past information in the universe including x than by using all available past information excluding x. As the reference is to all available information in the universe, Granger's approach is essentially a m ultivariate model. However, it is usually em ployed in a bivariate context at the empirical level. W hat is tested is the incremental forecasting power o f the past (or past and present) values o f one variable on another. Thus, in the bivariate context all available informa-tion refers to current and past values o f x and y, whereas infor mation excluding x means past and present values o f y only.
In order to test the existence of Granger's unidirectional caus-ality in a bivariate context, Sims(1972) establishes two pairs of regression equations where independent and dependent variables are twisted. The first regression equation within each pair is a reduced or restricted one that excludes the future values o f the independent variable. The second regression equation is the expanded or unrestricted one includ ing the future values of the independent variable.
Sims' four regression equations based on the pre-whitened series o f y (t) and X (t) are as follows: (1) y (t) = aj + b X (t) + q X (t-1) + e (t) (2) y (t) = a 2 + b 2 X (t) + c 2 X (t-1) + d 2 X (t+1) + e (t) (3) X (t) = a 3 + b 3 y (t) + c 3 y? (t-1} + e (t) (4) X (t} = a4 + b4 y (t) + c4 y (t-1) + d 4 y (t+1)+ e> (t)
Sims applies F-Test to the coefficients of the future values o f X and y in equations (2) and (4) with respect to equations (1) and (3) to see whether they are significantly different from zero. Direction o f the causality, then, is determined as follows:
The Result of F-Test Direction of Causality 1. d2=0 , d4=0 x and y are independent
2. d2^0 , d4=0 y causes x
3. d2=0 , d4^0 x causes y
4. d2^0 , d4 ^0 Feedback between x and y
Sims suggests that absolute values o f d2 and d4 can also be used in judging the direction of causality, if F-Test does not produce conclusive results.
One o f the com prehensive studies using Sims approach was conducted by Gupta(1984) He gathered quarterly data covering 50 to 60 quarters for financial and real variables o f fourteen countries. His financial variables are M1, M2, total domes tic credit,total private credit, and total finance (M 1+quasi money + postal savings + bonds + capital accounts). His real variables, on the other hand, are industrial production and GNP. For the empirical applications of Sims' second and fourth equations, he used four future and eight past values of the independent varia-ble. He found strong evidence of causality from financial to real variables. There was however some evidence o f an opposite relationship as well, with much lesser evidence for two-way causality. G upta also carried out an analysis to see whether the observed causality relationships have anything to do with the levels o f economic development of the countries included in the sample. No systematic and consistent pattern could be identified.
H TESTING THE CAUSAL RELATIONSHIP BETW EEN FINANCIAL AND ECONOM IC DEVELOPM ENT IN SAUDI ARABIA,KUW AIT AND BAHRAIN
2.1. M ethodology
Sims approach is adopted in this article to test the causality relationship between the financial and economic variables o f S.Arabia, Kuwait and Bahrain. The tests are applied first to the whole analysis period of 1973-88, and then are repeated for the subperiods of 1973-81, and 1982-88 in order to investigate Patrick's causal patterns
at different stages o f economic development. For all G ulf countries, 1973-81 was a period o f rem arkable economic growth emanating from huge petro-dollar surpluses, whereas the 1982-88 period witnessed a transition from surpluses to deficits in both balance-of-payments and government budgets. G ulf econo-mies, however, became more diversified in the eighties.
Quarterly values of M1, M 2,and total bank credits(CR) gathered from various issues of International Financial Statistics, and the statistical bulletins published by the governmental agencies of the three countries are employed as the indicators of finan-cial development. Since GDP figures for G ulf countries are avail-able only on annual basis, total exports (EXP) which constitute 75-85% o f GDP are chosen as the proxy for GDP. Another proxy used only for Kuwaiti GNP is government expenditures (PDN) which are released quarterly in this country
To prepare the data for the Sim's four regression equations following procedures were implemented:
a) Each time series were transformed into logarithmic series by taking natural logarithms o f the levels.
b) First differences were calculated in each logarithmic series obtained in step a. c) First differences obtained in the previous step were regressed on time and three
dummy variables in order to adjust data for seasonality.
d) Residuals obtained in step c were subjected to certain diagnostic tests such as plotting the autocorrelation function, t-value test, Chi-squared test, in order to make sure that each series achieved stationarity (*). The first test was also used to check whether the data is adjusted for seasonality.
e) Hildreth-Lu maximum likelihood procedure(GuJarati 1977) was em ployed to rem ove the serial correlation from the residuals.
Sims test was applied based on these residuals. In the empirical application of the Sims' four regression equations eight past and four future values of independent variables were used. These numbers were reduced to four and two respectively when Patrick phenomena were investigated for the two subperiods.
F-Tests were applied to the equations 2 and 4 relative to the equations o f 1 and 3 respectively, and the direction of causality was determined according to the significance o f F-Values of equation 2 and 4 at 5% alfa level.
(*) Stationarity in three variables, Kuwaiti M1, Saudi bank credits, and Saudi M2, could not be secured by first differencing. Second differencing eliminated non-stationarity only in Saudi bank credits suggesting a possible sampling error in the remaining two variables. In addition, sum squared errors (SSE) of the equations (2) and (4) were compared with those of equations (1) and (3). According to Sims' definition of causality, introducing future values in equations (2) and (4) should not improve explanatory power of these equations.
Direction of causality, then, was judged as follows:
Does at least one o f the equations 2 and 4 reduce SSE by 10% or more Yes
I
Is the difference between % reductions in SSEs caused by equations 2 and 4 less than 5 points NoI
Does Equation 2 reduces SSE more than Equation 4 No
I
No X and Y are independent Yes Feedback Yes Y causes X X causes Y2.2. Presentation and Analysis of Research Findings
The results of F, and SSE tests for the whole analysis period as well as the two subperiods in three countries are given in Table-1 and Table-2 respectively. Table-3 summarizes the results of the two tests.
Research findings presented in Tables 1 through 3 can be comment-ed upon as follows:
i) In Bahrain F test results for the entire analysis period Indicate a causality running from exports to M2, but no conclusive relationship between exports and the remaining two variables(M1 and bank credits). SSE test, on the other hand, invariably indicates a demand-following relationship.
For the 1973~81 period, however, both F test and S5E test imply causality from M1 to exports. The relationship between bank credits and exports is a feedback case according to F test9 but a supply leading one according to SSE test(from bank
credits to exports). M2 and exports seem to be independent under both test. The dominant causality pattern9 then, appears to be supply leading in this sub-period. In the second sub-period (1982-88), causality relationship revealed by both tests is from M2 to exports, but from exports to M1. Bank credits and exports are independent according to F test, but exports cause to bank credits according to SSE test. Test results give slightly more support to a demand following phenomenon in this period.
ii) In Kuwait, F test and SSE test results o f the entire analysis period are indicative o f a supply-leading phenomenon in general. There is no single case where causation runs from economic to financial variables. Two-way causality (feedback) is observed between M1 and
government expenditures by both tests. F test revealed independence in two cases only (between exports and both bank credits and M2)
For the 1973-81 period F test reveals one demand following (from exports to bank credits, one supply leading (from M1 to governm ent expenditures), three independence, and one feedback cases, whereas SSE test indicates two demand- following (from exports to bank credits; and from government expenditures to bank credits), two supply-leading (from M1 to exports; and from M1 to government expenditures) and two independence phenomena. No gener-alization, therefore, seems to be possible for the first
sub-period.-The l982-88 period, on the other hand. exhibits one supply lead-ing (from bank credits to exports), two demand following (from government expenditures to bank credits, and from government expenditures to M2), and one feedback case with F test; three demand following (from exports to M 2),from government expenditures to bank credits; and from government expenditures to M2), two supply leading (from bank credits to exports; and from M2 to exports) and one feedback case with SSE test. These findings give relatively more support to a demand following relationship. iii) In Saudi Arabia the F test indicates causation running from M2 to exports for the entire analysis period but from exports to both M1 and M2 for the 1982-88 period. Financial and economic aggregates are independent in the 1973-81 period according to the F test. The SSE test, on the other hand, reveals one dem and following (from exports to bank credits), one supply leading (from M2 to exports) relationship for the entire period. Causation is from bank credits to exports and from M2 to exports in 1973- 81 period. For the 1982-88 period SSE test indicates one supply leading (from bank credits to exports), but two demand following (from M1 to exports, and from M2 to exports) relationships. These results indicate a supply leading phenomenon for the first sub-period, but a demand following one in the second. For the entire period no generalization is possible.
Table 1: F Statistics and Causality Directions Country Regression Equations 1973-88 1973-81 1982-88 Bahrain CR on EXP 1.68 5.62 + 0.67 EXP on CR 2.38 I 3.44 + F 1.16 I M l on EXP 0.19 8.76 + 1.06 EXP on M l 1.02 I 0.97 SL 3.83 ** DF M 2 on EXP 2.28 1.95 3.48 ** EXP on M2 3.08 * DF 2.00 I 2.02 SL Kuwait CR on EXP 2.25 1.05 3.38 ** EXP on CR 1.53 I 2.81 + DF 1.88 SL M l on EXP 8.72 + 1.68 EXP on M l 3.56 + F 2.27 I M l(2 )o n EXP 5.4 6 * EXP onM l(2) 2.32 SL M 2 on EXP 1.99 1.17 10.70 ** EXP on M2 1.14 I 0.93 I 3.27 ** F CR on PND 3.42* 0.58 0.78 PND on CR 1.43 SL 2.50 I 10.48 ** DF M l on PND 10.15 + 2.17 PND on M l 1.72 SL 2.06 I M l(2 )o n PND 3.59* PND onM l(2) 3.30* F M 2 on PND 3.61 * 0.92 1.31 PND on M2 1.07 SL 1.11 I 11.09 ** DF S.Arabia CR on EXP 1.64 6.10 ** EXP on CR 1.08 I 4.91 ** F CR(2)on EXP 5.73 * EXP onCR(2) 6.15 * F M l on EXP 0.99 0.26 1.65 EXP on M l 0.92 I 0.25 I 3.36 ** DF M2 on EXP 1.02 1.56 EXP on M2 0.31 I 4.26 ** DF M 2(2)on EXP 4.10* EXP onM2(2) 1.98 SL (2) Second difference
(*) Significant at 5 % level for 36 degrees of freedom SL- Supply leading
+ ” ” ” 20 ” ” ” DF- Demand following
(**) ” ” ” 12 ” ” ”
I - Independent F - Feedback
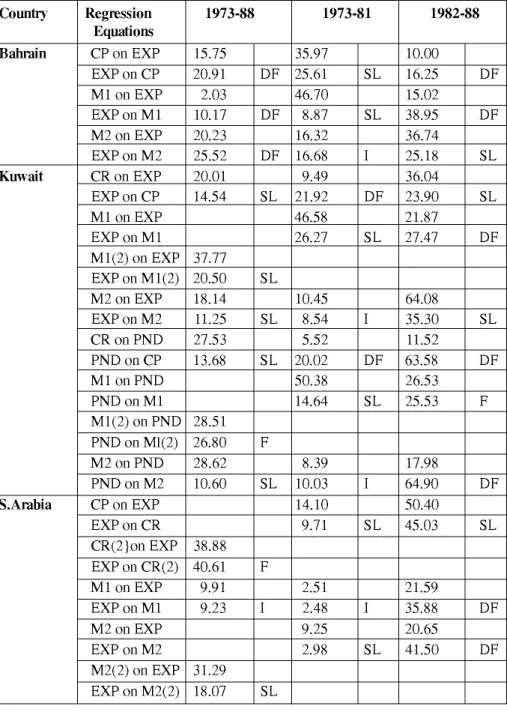
Table 2: SSE-Test Results: % Decreases Caused by Future Values of Independent Variables, and the Implied Causality Directions
Country Regression Equations 1973-88 1973-81 1982-88 Bahrain CP on EXP 15.75 35.97 10.00 EXP on CP 20.91 DF 25.61 SL 16.25 DF M l on EXP 2.03 46.70 15.02 EXP on M l 10.17 DF 8.87 SL 38.95 DF M2 on EXP 20.23 16.32 36.74 EXP on M2 25.52 DF 16.68 I 25.18 SL Kuwait CR on EXP 20.01 9.49 36.04 EXP on CP 14.54 SL 21.92 DF 23.90 SL M l on EXP 46.58 21.87 EXP on M l 26.27 SL 27.47 DF M l (2) on EXP 37.77 EXP on M l (2) 20.50 SL M 2 on EXP 18.14 10.45 64.08 EXP on M2 11.25 SL 8.54 I 35.30 SL CR on PND 27.53 5.52 11.52 PND on CP 13.68 SL 20.02 DF 63.58 DF M l on PND 50.38 26.53 PND on M l 14.64 SL 25.53 F M l (2) on PND 28.51 PND on Ml(2) 26.80 F M 2 on PND 28.62 8.39 17.98 PND on M2 10.60 SL 10.03 I 64.90 DF S.Arabia CP on EXP 14.10 50.40 EXP on CR 9.71 SL 45.03 SL CR(2}on EXP 38.88 EXP on CR(2) 40.61 F M l on EXP 9.91 2.51 21.59 EXP on M l 9.23 I 2.48 I 35.88 DF M 2 on EXP 9.25 20.65 EXP on M2 2.98 SL 41.50 DF M2(2) on EXP 31.29 EXP on M2(2) 18.07 SL
Table-3: Summary of Causality Test Results Country Regression Equations
1973-88
1973-81
1982-88
(F-Test) SSE Test F-Test) SSE- < Test F-Test) SSE Test Bahrain CR, EXP I DF F SL I DF M l , EXP I DF SL SL DF DF M2, EXP DF DF I I SL SL Kuwait CR, EXP I SL DF DF SL SL M l. EXP _ _ F SL I DF M l (2),EXP SL SL _ _ _ _ M2, EXP I SL I I F SL CR, PND SL SL I DF DF DF M l, PND - - SL SL I F M l (2),PND F F - - -M2, PND SL SL I I DF DF S Arabia CR, EXP - - I SL F SL CR(2),EXP F F - - -M l, EXP I I I I DF DF M2, EXP - - I SL DF DF M 2(2),EXP SL SL - --Frequencies of Test Results:
Bahrain I 2 - 1 1 1 -F - - 1 - - -SL - - 1 2 1 1 DF 1 3 - 1 2 Kuwait I 2 - 2 2 -F 1 1 1 - 1 1 SL 3 5 1 2 1 2 DF - - 1 2 2 3 S Arabia I 1 1 3 1 - -F 1 1
_
_
1_
SL 1 1 _ 2 _ 1 DF - - _ _ 2 2m . SUM M AR Y A N D CONCLUSIONS
Sims' approach was applied to available financial and economic data in Bahrain, Kuwait, and Saudi Arabia to detect the causal relationships between financial and economic development over the last two decades.
For the entire analysis period (1973-88) test results have indicated a supply leading relationship in Kuwait, but a demand following one in Bahrain. M ixed results were obtained for Saudi Arabia. The unidirectional causality from financial to economic aggregates in Kuwait can be interpreted as the result o f the huge expansion of financial assets in this country, even before the seventies due to the limited absorptive capacity of the economy and the preference for speculative financial investments by the private sector in general. B ahrain’s demand following pattern on the other hand is in conformity with the early attempts in this country to diversify the economy using oil revenues. The mixed results o f Saudi Arabia could be attributed to the repressive policies toward banking and the financial sector in general until late seventies.
Patrick’s concept of changing patterns in causal relationships at different stages of economic development has found some ground in this study. In Bahrain and Saudi Arabia the dominant pattern was supply leading in the 1973-81 period. In the following period (1982-83), however, the relationship was reversed to a demand following one in all three countries, mostly because of the level o f diversification already accomplished over the seven-ties, and the decrease in oil revenues with the resulting balance of payments and budgetary deficits.
In summary, research findings seem to be justifiable given the economic history of Gulf countries over the last two decades. Nevertheless, the results should be considered indicative and interpreted with caution due to the technical problems inher-ent in all causality tests.
REFERENCES
BHATIA, R. J. and Khatkhate D. R. (1975), "Financial Intermediation, Savings M obilization, and Entrepreneurial Development: The African Experience", IMF staff Papers, March.
DRAKE, P. H. (1980), Money, Finance and Developm ent , M artin Robertson, Oxford.
GALBIS, V. (1977), "Financial Intermediation ad Economic Growth in Less Developed Countries: A Theoretical Approach", Journal o f Development S tu d ies, 13 (2), January, 58-71.
GOLDSM ITH, R. W. (1969), Financial Structure and D evelopm ent, Yale University Press, New Haven.
GRANGER, C. W. J. (1969), "Investigating Causal Relations By Econometric M odels and Cross Spectral M ethods", Econom etrica , 32, 424-438.
GUJARATI, Damodar (1984), Basic Econometrics , M cGraw-Hill International Book Company, Singapore.
GUPTA, K. L. (1984), Financial and Economic G row th in Developing Countries , Croom Helm, London.
HOOLEY, R. W. (1963), Savings in the Philippines , Institute of Economics and Research, University of Philippines.
KHATHHATE, D. R. (1982), "National and International Aspects of Finan-cial Policies in LDCs: A Prologue", W orld D ev elo p m en t, 10(9), 689-694. KHATKHATE, D. R. (1972), Analytical Basis of the Working of Monetary Policy in
Less Developed Countries", IM F Staff paper , 19(3), 533-538.
M CKINNON, R. I. (1973), Money and Capital in Economic Developm ent , Brookings Institution, W ashington, DC.
ODEKOKUN, M. O. (1989), "Causalities Between Financial Aggregates and Economic Activities in N igeria : The Results From Granger Test" Savings and Developm ent , 13 (1), 101-110.
PATRICK, H. T. (1966), "Financial Development and Economic Growth in U nderdeveloped C ountries", Econom ic D evelopm ent and Cultural Change , XIV (2). January, 174-189.
SHAW, E. S. (1973), Financial Deepening in Economic Developm ent , Oxford University Press, New York/London.
SIMS, C. A. (1972), "Money, Income and Causality", Am erican Economic Review , 62, 540-552.