QUANTUM DOT FUNCTIONALIZED TITANIA SYSTEMS FOR
PHOTOCATALYTIC OXIDATIVE NO
xSTORAGE
A THESIS
SUBMITTED TO THE DEPARTMENT OF CHEMISTRY
AND THE GRADUATE SCHOOL OF ENGINEERING AND SCIENCE
OF BILKENT UNIVERSITY
IN PARTIAL FULFILLMENT OF THE REQUIREMENTS FOR
THE DEGREE OF
MASTER OF SCIENCE
IN
CHEMISTRY
By
Merve Balcı
March 2018
QUANTUM
DOT
FUNCTIONALIZED
TITANIA
SYSTEMS
FOR
PHOTOCATALYTIC OXIDATIVE NO
xSTORAGE
By Merve Balcı
March 2018
We certify that we have read this thesis and that in our opinion it is fully
adequate,
in scope and in quality, as a thesis for the degree of Master of Science.
Assoc. Prof. Emrah Özensoy (Advisor)
Prof. Dr. Ömer Dağ
Assoc. Prof. H. Emrah Ünalan
Approved for the Graduate School of Engineering and Science
:ABSTRACT
Quantum Dot Functionalized Titania Systems for Photocatalytic
Oxidative NO
xStorage
MERVE BALCI M.Sc. in Chemistry Advisor: Emrah Özensoy
March 2018
Increasing activities of industrial combustion systems, volcanic eruptions, agriculture activities and utilization of stationary and mobile fossil and biomass combustion systems are known to be the major causes of toxic nitrogen oxides (NOx) pollution. These pollutants are
not only highly hazardous for the ecosystem but also can trigger the formation of secondary pollutants such as acid rain and tropospheric ozone. Abatement of toxic NOx gases can be achieved by thermal catalytic processes or physical/chemical adsorption systems. However, environmentally friendly, cost-efficient and sustainable alternative photocatalytic systems can also be designed which can exploit readily abundant solar radiation.
One of the most well-known benchmarks for environmental photocatalysts is titanium dioxide with a wide band gap typically varying within 3.0-3.2 eV that can be activated via UV photons. This wide band gap prevents efficient absorption of visible light, which corresponds to around 5 times higher intensity compared to UV light. In order to increase the photocatalytic efficiency of the titanium dioxide, its visible-light exploitation capability should be enhanced. Although, this can be done by doping of TiO2 with nonmetal main group
elements, recently the research focus has shifted towards utilization of semiconductor quantum dots (QDs) for this purpose. Visible response of the QDs can be modified by tuning their particle size. Furthermore, QDs provide additional advantages such as the generation of hot electrons or multiple charge carriers with a single high-energy photon.
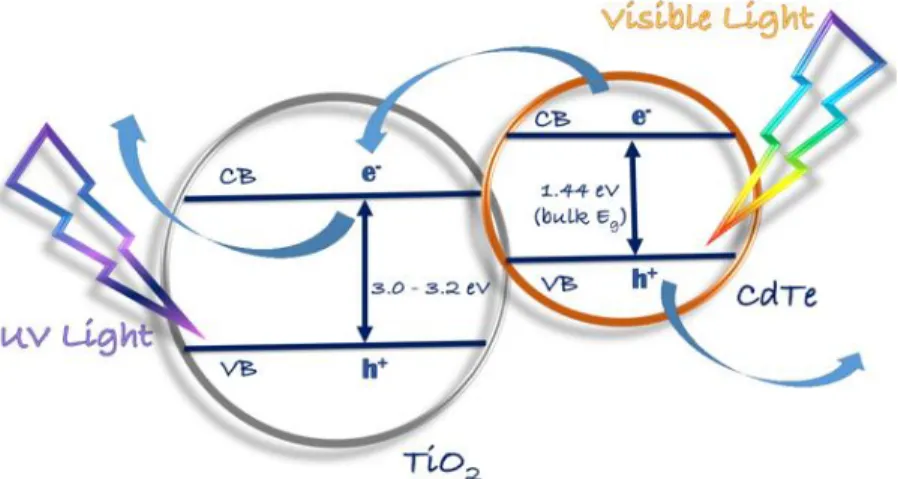
In the present work, CdTe QDs were employed as a direct band gap semiconductor (1.44 eV) compatible with the visible window of the solar spectrum to promote titania based photocatalysts. Due to its higher conduction band, CdTe can transfer its conduction band
electrons to the conduction band of TiO2 and the hole that is created on the valence band of
TiO2 can be transferred to the valence band of CdTe; leading to efficient electron-hole
separation. Thus, visible light exploitation capacity of TiO2 can be enhanced along with its
photocatalytic activity.
Current photocatalytic activity results on QD functionalized titania systems exhibited much higher NOx storage in solid state and an enhancement of NO conversion values as
compared to that of P25 titania benchmark photocatalyst. In addition, various reference materials were prepared and photocatalytically tested in order to shed light on the mechanism of this photocatalytic enhancement. These results provided insight regarding the functionality of the different structural components of the photocatalytic architecture in the photocatalytic NOx oxidative storage process.
The influence of each structural component in this catalytic architecture was studied. Control experiments were conducted with the dispersant water and the capping agent thioglycolic acid. The results revealed that NO conversion and selectivity can be enhanced by the adsorbed water on titania surface. By adding thioglycolic acid on titania, the NO conversion is suppressed but the selectivity of the system increased. Finally, by replacing titania with a photocatalytically inactive material alumina, it was shown that only in the presence of CdTe quantum dots, there can be NO oxidation/conversion.
In overall, utilizing CdTe quantum dots are advantageous for exploiting more of the solar irradiation; however, they suffer from low stability and short catalytic life time.
ÖZET
Kuantum Noktalar ile İyileştirilmiş Titanya Sistemleri ile
Fotokatalitik Yükseltgemeli NO
xDepolama
MERVE BALCI Kimya, Yüksek Lisans Tez Danışmanı: Emrah Özensoy
Mart 2018
Endüstriyel yanma sistemlerindeki artış, volkanik patlamalar, tarım faaliyetleri, durağan ya da mobil fosil ve biyoyakıt tüketimi, oldukça toksik olan NOx gazlarının
oluşumunun temel nedenleri olarak bilinmektedir. Bu gazların ekosistem üzerinde doğrudan neden olduğu zararlarının yanı sıra, asit yağmurları ve troposferik ozon gibi ikincil hava kirliliği kaynaklarının oluşumuna da neden oldukları bilinmektedir. Bu gazların atmosferdeki yoğunluklarının azaltılması için termal katalitik sistemler ya da fiziksel/kimyasal adsorpsiyon sistemler halihazırda kullanılmaktadır. Bunların yanı sıra, çevreye dost, düşük maliyetli ve sürdürülebilir alternatif fotokatalitik sistemler tasarlanarak, halihazırda kolaylıkla ulaşılabilen güneş enerjisinden faydalanılabilir.
Bahsedilen fotokatalitik sistemlerde, en yaygın olarak kullanılan malzeme, titanya olup, 3.0-3.2 eV aralığında oldukça geniş bir enerji bant aralığına sahiptir. Bu geniş bant aralığı nedeniyle, titanya çoğunlukla UV ışıması altında aktifleştirilebilir. Güneş enerjisinin dağılımı göz önünde bulundurulduğunda, ultraviyole ışınları görünür ışığın sadece beşte birine karşılık gelmektedir. Titanyanın güneş enerjisinden daha fazla faydalanabilmesini sağlamak için, görünür dalga boylarını da soğurmasını sağlamak gerekmektedir. Titanyanın ametal elementlerle dopingi bu artışa yardımcı olsa da, son zamanlarda nano boyutlu yarı iletken malzemelerin (kuantum noktacıklar) kullanımı da oldukça önem kazanmıştır. Kuantum noktacıkların soğurduğu dalga boyları, parçacıkların boyutlarıyla oynanarak değiştirilebilmektedir. Ayrıca, kuantum noktacıklar soğurdukları fotonlar sayesinde elektron-boşluk ayrımı yaparak, fotokatalitik süreçte rol oynayabilirler.
Bu çalışmada, direkt-bant aralığına sahip CdTe kuantum noktacıkları kullanılmıştır. CdTe kuantum noktacıklarının iletim bandı titanyanınkinden yukarıda olduğu için, CdTe iletim bandında oluşturulan elektronlar, titanyanın iletim bandına rahatlıkla akabilir.
Böylelikle, oluşturulan elektron-boşluk çiftinin ayrımının daha uzun süreli ve efektif olması sağlanabilmektedir. Kullanılan kuantum noktacıklarının bant aralığı görünür ışıkla uyumlu olduğu için, titanyanın görünür ışık altındaki fotokatalitik aktivitesi de artırılabilir.
QD ile işlevselleştirilen titanya sistemleri, üzerinde yürütülen fotokatalitik aktivite çalışmaları, oldukça yüksek NOx depolama özellikleri göstermiş olup, P25 referans titanya
katalizörüne göre, NO gazının katalitik dönüşümünü de artırmıştır. Ayrıca, sunulan fotokatalizör sisteminin mekanizmasını aydınlatabilmek için farklı referans malzemeler de hazırlanmıştır. Ölçümlerde elde edilen bulgular, ilgi çekici fotokatalitik aktivite ve seçicilik sonuçları göstermiştir.
Katalitik mimarideki her yapı taşının etkisi incelenmiştir. Kuantum noktaların içinde bulunduğu suyun ve etrafını saran ligand merkapto asetik asidin etkileri incelendiğinde, titanya yüzeyine tutundurulan suyun hem fotokatalitik aktiviteyi hem de seçiciliği artırdığı görülmüştür. Merkapto asetik asit ise titanya aktivitesinde düşüşe neden olurken, seçiciliği artırmıştır. Son kontrol deneyinde, bu sistemde fotokatalitik aktivite göstermeyen alümina, titanya yerine kullanılmıştır. Bu deneyler sonucunda, CdTe kuantum noktalarının bulunmadığı hiçbir sistemde katalitik ya da katalitik olmayan bir aktivite gözlemlenememiştir.
Bu çalışma, CdTe kuantum noktalarının, titanyanın fotokatalitik aktivitesini ve seçiciliğini artırdığını göstermiştir. Fakat, oluşturulan sistemin katalitik ömrü kısadır.
Anahtar Kelimeler: Hava temizliği, Fotokatalitik NOx bozunması, Kuantum noktacıklar,
Acknowledgement
First of all, I would like to express my gratitude to my advisor Assoc. Prof. Emrah Özensoy for giving me the chance to conduct my research in his photocatalysis laboratory. Since my senior year as an undergraduate student, I had the opportunity to work in many different projects and learned many techniques which helped me enhance my scientific knowledge. I would also like to indicate my appreciation to Bilkent University and UNAM Facility for offering variety of sources, equipment and access to all the literature I needed during my studies. Many thanks to all our valuable faculty members, especially Prof. Ulrike Salzner for showing me how to improve myself as a teaching assistant. It was a great opportunity to work with her.
I am sincerely thankful to our collaborator Prof. Hilmi Volkan Demir. Since October 2017, I had the chance of working with his research group which ended up to be the main topic of my M.Sc. Thesis. It was a pleasure for me to collaborate with people having reliable and honest scientific approach. Special thanks to Didem Dede for her friendly accompany.
If I am finishing my studies with good memories, it is mostly because of my dear friends. I’d like to thank Tutku Bedük Ashirova, Deniz Yıldız, Abdurrahman Türksoy, Menekşe Liman, Muammer Yaman, Timur Ashirov, Rebekka Toder and Sophie Poteau for sharing great moments and their support. I would like to acknowledge my colleagues in Özensoy Research Group, Dr. Mustafa Karatok, Dr. Zafer Say, Dr. Muhammad Irfan, Damla Sürmeli, Elnaz Ebrahimi, Merve Kurt, Kerem Emre Ercan, Ali Vala Koç and Bartu Karakurt. Special thanks to Sean William McWhorter, who always looked out for me and helped me with any problems in the lab. There are no words to indicate his support and motivation. I’d like to thank our technician Ethem Anber for his great support and help, I learned a lot from him. I am grateful to my parents Dilek and Mustafa and my brother Emre for their endless support throughout my whole life. Knowing that they are always there whenever I need kept me going further. They offered great comfort and courage when things got rough. I also would like to indicate my thankfulness to the Leinen Family; Lisa, Klaus, Rebecca and Philipp for their lovely motivation and support.
Last but not the least, I would like to express my deepest gratitude to Alexander Leinen. Without his encouragement and endless support, I would not make it. I cannot thank enough for always being there and helping me overcome all the problems. The biggest motivation, the best prize at the end of any challenging road, my heartfelt thanks.
TABLE OF CONTENTS
1. INTRODUCTİON... 1
1.1.AIRPOLLUTION ... 1
1.1.1. NITROGEN OXIDES (NOx) POLLUTION ... 4
1.1.2. NOx REMOVAL TECHNIQUES ... 5
1.2. TITANIUMDIOXIDE ... 7
1.1.1. APPLICATIONS OF TITANIUM DIOXIDE ... 7
1.2.2. PHYSICAL PROPERTIES OF TITANIUM DIOXIDE ... 8
1.2.3. PHOTOCATALYSIS WITH TITANIUM DIOXIDE ... 11
1.3. QUANTUMDOTS(QDS)... 17
1.4. SCOPEOFTHESTUDY ... 21
2. EXPERIMENTAL ... 23
2.1. SAMPLEPREPARATION ... 23
2.1.1. PREPARATION OF CdTe QUANTUM DOTS ... 23
2.1.2. PREPARATION OF CdTe/TiO2 COMPOSITE MATERIALS ... 25
2.2. PHONOS(PHOTOCATALYTICNOXOXIDATIONANDSTORAGE) SYSTEM ... 27
2.2.1. EXPERIMENTAL SETUP OF THE PHONOS SYSTEM ... 27
2.2.2. DATA ANALYSIS METHODS... 31
2.3. CATALYSTCHARACTERIZATION ... 37
2.3.1. XRD MEASUREMENTS ... 37
2.3.2. TEM/EDX ANALYSIS ... 38
2.3.3. UV/VIS & UV/VIS-DR MEASUREMENTS ... 39
2.3.4. PL, PL-QY & TRF MEASUREMENTS ... 40
3. RESULTS & DISCUSSION ... 41
3.1. CATALYSTCHARACTERIZATION ... 41
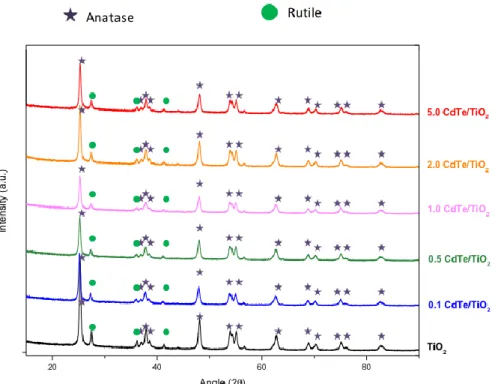
3.1.1. XRD ANALYSIS RESULTS ... 41
3.1.2. TEM/EDX RESULTS ... 42
3.1.3. UV/VIS & UV/VIS DR RESULTS ... 44
3.2.1. PHOTOCATALYTIC PERFORMANCE OF TITANIUM DIOXIDE (P25)
... 50
3.2.2. EFFECT OF CdTe QUANTUM DOTS ON THE PHOTOCATALYTIC ACTIVITY OF TITANIUM DIOXIDE (P25) ... 54
3.2.3. EFFECT OF ADSORBED-WATER ON TiO2 PHOTOCATALYSIS ... 60
3.2.4. EFFECT OF THIOGLYCOLIC ACID ON TiO2 PHOTOCATALYSIS 66 3.2.5. CONTROL EXPERIMENTS WITH ALUMINA ... 71
3.2.6. RE-USE MEASUREMENTS ... 74
3.2.7. PROPOSED MECHANISM ... 79
4. CONCLUSIONS ... 83
APPENDİX ... 84
LIST OF FIGURES
Figure 1. Estimated outdoor (left) and indoor (right) air pollution-caused deaths breakdown
by disease adapted from Reference [1]. ... 1
Figure 2. Primary and secondary air pollutants (Copyright notice © Scotland’s Environment, 2018 [4])... 2
Figure 3. The ozone layer(Copyright notice © 7 Continents, 2018 [8]). ... 3
Figure 4. Main scheme of semiconductor photocatalysis. ... 7
Figure 5. End-use of titanium dioxide in 2005, data adapted from Reference [24]. ... 8
Figure 6. Bulk structures of a) rutile, b) anatase, c) brookite phases of titania. Reprinted from Ref. 23 Copyright 2018 with permission from Elsevier [23]. ... 9
Figure 7. Equilibrium crystal shape of anatase TiO 2 through the Wulff construction and the evolved other shapes. Reprinted from Ref. 25 Copyright 2018 with permission from ACS [25]. ... 10
Figure 8. Equilibrium crystal shape of rutile TiO 2 through the Wulff construction and the evolved other shapes. Reprinted from Ref. 25 Copyright 2018 with permission from ACS [25]. ... 10
Figure 9. Solar energy distribution. (Copyright notice © Green Builder, 2018 [36]) ... 11
Figure 10. Recombination processes of photo-generated electrons and holes for a) indirect gap anatase and b) direct gap rutile. Reprinted from Ref. 39 Copyright 2018 with permission from Royal Society of Chemistry [39]. ... 14
Figure 11. Effect of NO inlet concentration on photocatalytic NOx abatement rate. Reprinted from Ref. 44 Copyright 2018 with permission from Elsevier [44]. ... 15
Figure 12. Effect of % relative humidity on %NO conversion (inlet NO concentration:40 ppm). Reprinted from Ref. 41 Copyright 2018 with permission from Elsevier [41]. ... 15
Figure 13. Effect of volumetric flow rate of polluted air on %NOx conversion. Reprinted from Ref. 42 Copyright 2018 with permission from Elsevier [42]. ... 16
Figure 14. Effect of light intensity on % NOx conversion. Reprinted from Ref. 42 Copyright 2018 with permission from Elsevier [42]. ... 16
Figure 15. Effect of the mass of a catalyst on pollutant conversion rate. Reprinted from Ref. 45 Copyright 2018 with permission from Elsevier [45]. ... 17
Figure 17. An illustration of the quantum dot size effect on the optical properties of the material (a red shift in emission wavelengths with increasing size). ... 19 Figure 18. The effect of anatase content to rate constant K where a peak shaped offset (40%<[A]<80%) indicates the synergism between anatase and rutile phases. Reprinted from Ref. 59 Copyright 2018 with permission from American Chemical Society [59]. . 21 Figure 19. A possible scheme of electron and hole transport in CdTe/TiO2 photocatalysis. . 22
Figure 20. A representation of thioglycolic acid capped CdTe quantum dots. ... 22 Figure 21. A scheme for the reaction system of thioglycolic acid-capped CdTe QDs [66]. . 25 Figure 22. Stepwise preparation of a) H2O/TiO2 control material and b) CdTe/TiO2
composite materials...26 Figure 23. A block diagram of the currently used custom-made photocatalytic flow reactor system setup. ... 29 Figure 24. Operando diagram of photocatalytic NOx oxidation and storage flow reactor for
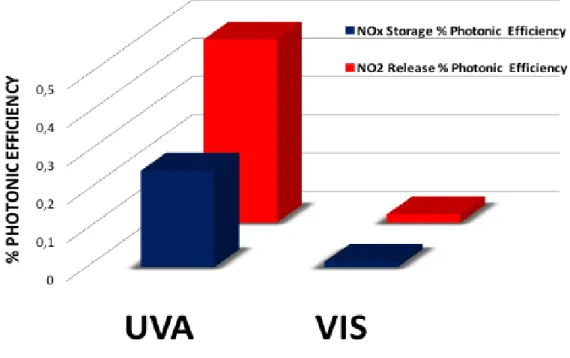
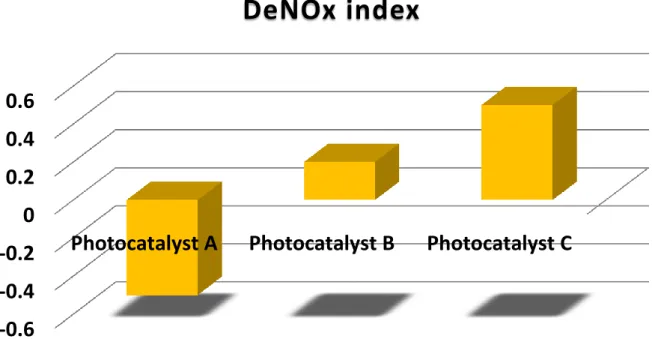
titanium dioxide. ... 30 Figure 25. A sketch of PMMA sample holder manufactured for photocatalysis performance tests. ... 30 Figure 26. Comparison of three hypothetical photocatalysts in terms of % photonic efficiency method... 32 Figure 27. Comparison of % photonic efficiency results of titanium dioxide for two different light sources. ... 33 Figure 28. Comparison of three hypothetical photocatalysts in terms of % NO conversion and % selectivity method. ... 34 Figure 29. Comparison of % NO conversion and % selectivity results of titanium dioxide for two different light sources. ... 35 Figure 30. Comparison of three hypothetical photocatalysts in terms of their DeNOx index
values. ... 37 Figure 31. Powder sample loading for XRD-MPD measurements on a silicon single crystal.
... 38 Figure 32. Optical design of internal diffuse reflectance accessory [75]... 39 Figure 33. a) Powder sample cell b) powder cell inserted into sample holder c) Cary 2500 internal DR accessory d) liquid cell holder [75]. ... 40 Figure 34. XRD pattern of TGA-capped CdTe quantum dots. ... 41 Figure 35. XRD patterns of TiO2 (Degussa P25), 0.1 CdTe/TiO2, 0.5 CdTe/TiO2, 1.0
Figure 36. TEM image of CdTe quantum dots. ... 42
Figure 37. EDX analysis results of CdTe quantum dots. ... 43
Figure 38. TEM images of 5.0 CdTe/P25 composite materials. ... 43
Figure 39. TEM images of 5.0 CdTe/P25 composite materials in bright (left) and dark (right) field. ... 44
Figure 40. EDX analysis results of 5.0 CdTe/P25 composite materials. ... 44
Figure 41. UV-Visible spectrum of CdTe quantum dots. ... 45
Figure 42. UV-Visible spectrum of CdTe QDs in terms of % Reflectance and band gap calculations. ... 46
Figure 43. UV-Visible spectrum of 5.0 CdTe/P25 composite material. ... 47
Figure 44. Photoluminescence results of CdTe quantum dots. ... 48
Figure 45. Time resolved fluorescence results of CdTe quantum dots. ... 49
Figure 46. %Photonic efficiency results for titanium dioxide (P25) under UV-A light. ... 51
Figure 47. % NO Conversion & % Selectivity results for titanium dioxide (P25) under UV-A light. ... 51
Figure 48. DeNOx index results for titanium dioxide (P25) under UV-A light. ... 51
Figure 49. %Photonic efficiency results for titanium dioxide (P25) under visible light. ... 52
Figure 50. % NO Conversion & % Selectivity results for titanium dioxide (P25) under visible light... 52
Figure 51. DeNOx index results for titanium dioxide (P25) under visible light. ... 52
Figure 52. Comparison of %Photonic efficiency results for titanium dioxide (P25) under UV-A and visible light irradiation. ... 53
Figure 53. Comparison of % NO Conversion & % Selectivity results for titanium dioxide (P25) under UV-A and visible light irradiation. ... 53
Figure 54. Comparison of DeNOx index results for titanium dioxide (P25) under UV-A and visible light irradiation. ... 53
Figure 55. %Photonic efficiency results for CdTe/P25 composites under UV-A light. ... 55
Figure 56. % NO Conversion & % Selectivity results for CdTe/P25 composites under UV-A light. ... 55
Figure 57. DeNOx index results for CdTe/P25 composites under UV-A light. ... 55 Figure 58. %Photonic efficiency results for fresh and aged CdTe/P25 composites under
UV-Figure 60. DeNOx index results for for fresh and aged CdTe/P25 composites under UV-A light. ... 56 Figure 61. %Photonic efficiency results for CdTe/P25 composites under visible light. ... 58 Figure 62. % NO Conversion & % Selectivity results for CdTe/P25 composites under visible light. ... 58 Figure 63. DeNOx index results for for CdTe/P25 composites under visible light. ... 58 Figure 64. %Photonic efficiency results for fresh and aged CdTe/P25 composites under visible light... 59 Figure 65. X20. NO Conversion & % Selectivity results for fresh and aged CdTe/P25 composites under visible light. ... 59 Figure 66. DeNOx index results for for fresh and aged CdTe/P25 composites under visible light. ... 59 Figure 67. Mechanism of photo-induced hydrophilicity of titanium dioxide surfaces. Reprinted from Ref. 26 Copyright 2018 with permission from Elsevier [26]. ... 60 Figure 68. %Photonic efficiency results for H2O/P25 samples under UV-A light. ... 61
Figure 69. % NO Conversion & % Selectivity results for H2O/P25 samples under UV-A
light. ... 61 Figure 70. DeNOx index results for H2O/P25 samples under UV-A light. ... 61
Figure 71. %Photonic efficiency results for fresh and aged H2O/P25 samples under UV-A
light. ... 62 Figure 72. NO Conversion & % Selectivity results for fresh and aged H2O/P25 samples
under UV-A light. ... 62 Figure 73. DeNOx index results for fresh and aged H2O/P25 samples under UV-A light. .... 62
Figure 74. %Photonic efficiency results for H2O/P25 samples under visible light. ... 64
Figure 75. % NO Conversion & % Selectivity results for H2O/P25 samples under visible
light. ... 64 Figure 76. DeNOx index results for H2O/P25 samples under visible light. ... 64
Figure 77. %Photonic efficiency results for fresh and aged H2O/P25 samples under visible
light. ... 65 Figure 78. % NO Conversion & % Selectivity results for fresh and aged H2O/P25 samples
under visible light. ... 65 Figure 79. DeNOx index results for fresh and aged H2O/P25 samples under visible light. ... 65
Figure 81. % NO Conversion & % Selectivity results for TGA(pure)/P25 samples under visible light... 67 Figure 82. DeNOx index results for TGA(pure)/P25 samples under visible light. ... 67 Figure 83. %Photonic efficiency results for TGA(pure)/P25 samples under UV-A light. ... 68 Figure 84. % NO Conversion & % Selectivity results for TGA(pure)/P25 samples under
UV-A light. ... 68 Figure 85. DeNOx index results for TGA(pure)/P25 samples under UV-A light. ... 68 Figure 86. %Photonic efficiency results for fresh and aged TGA(aq)/P25 samples under
UV-A light. ... 69 Figure 87. % NO Conversion & % Selectivity results for fresh and aged TGA(aq)/P25 samples under UV-A light. ... 69 Figure 88. DeNOx index results for fresh and aged TGA(aq)/P25 samples under UV-A light.
... 69 Figure 89. %Photonic efficiency results for fresh and aged TGA(aq)/P25 samples under visible light... 70 Figure 90. % NO Conversion & % Selectivity results for fresh and aged TGA(aq)/P25 samples under UV-A light. ... 70 Figure 91. DeNOx index results for fresh and aged TGA(aq)/P25 samples under UV-A light.
... 70 Figure 92. %Photonic efficiency results for alumina control samples under visible light. .... 72 Figure 93. % NO Conversion & % Selectivity results for alumina control samples under visible light... 72 Figure 94. DeNOx index results for alumina control samples under visible light... 72 Figure 95. %Photonic efficiency results for alumina control samples under UV-A light. ... 73 Figure 96. % NO Conversion & % Selectivity results for alumina control samples under
UV-A light. ... 73 Figure 97. DeNOx index results for alumina control samples under UV-A light. ... 73 Figure 98. Re-use %photonic efficiency results for P25, CdTe/P25 and TGA/P25 samples under visible light. ... 75 Figure 99. Re-use %NO conversion and % selectivity results for P25, CdTe/P25 and TGA/P25 samples under visible light. ... 75
Figure 101. Re-use %photonic efficiency results for P25, CdTe/P25 and TGA/P25 samples under UV-A light. ... 76 Figure 102 Re-use %NO conversion and % selectivity results for P25, CdTe/P25 and TGA/P25 samples under UV-A light. ... 76 Figure 103. Re-use DeNOx index results for P25, CdTe/P25 and TGA/P25 samples under UV-A light. ... 76 Figure 104. Re-use %photonic efficiency results for CdTe/P25 under UV-A light. ... 77 Figure 105. Re-use %NO conversion and % selectivity results for CdTe/P25 under UV-A light. ... 77 Figure 106. Re-use DeNOx index results for CdTe/P25 under UV-A light. ... 77 Figure 107. Re-use %photonic efficiency results for CdTe/P25 under visible light. ... 78 Figure 108. Re-use %NO conversion and % selectivity results for CdTe/P25 under visible light. ... 78 Figure 109. Re-use DeNOx index results for CdTe/P25 under visible light. ... 78 Figure 110. A possible mechanism for CdTe/P25 composites for NOx oxidation and storage.
... 79 Figure 111. Color change of bare P25 titania (left) after dropcasting CdTe on titania (2.0 CdTe/P25, middle) and after calcination of the prepared slurry at 70°C for 18 h (right). ... 80 Figure 112. Color change of CdTe/P25 calcined at 70°C for 18 h (left) and after visible light exposure for 5 h (right). ... 80 Figure 113. Color differences between CdTe/Alumina after UV-A exposure (left), fresh CdTe/Alumina (middle) and CdTe/Alumina after visible exposure (right). ... 80 Figure 114. A possible scheme for CdTe/P25 composites for NOx oxidation and storage. ... 81
Figure 115. FTIR spectra of bare titania, capping agent TGA, CdTe/CdS core/shell QDs prepared at 160 °C, and QD-sensitized electrodes prepared at different temperature. Reprinted from Ref. 79 Copyright 2018 with permission from Royal Society of Chemistry [79]. ... 82 Figure 116. % Photonic efficiency results showing the effect of photon flux on 2.0CdTe/P25 and P25... 85 Figure 117. % NO Conversion and % Selectivity results showing the effect of photon flux on 2.0CdTe/P25 and P25. ... 85 Figure 118. DeNOx index results showing the effect of photon flux on 2.0CdTe/P25 and P25. ... 85
List of Tables
Table 1. Current National Ambient Air Quality Standards for criteria air pollutants [3] ... 3 Table 2. The required chemicals for the colloidal synthesis of thioglycolic acid capped CdTe quantum dots ... 23 Table 3. Required amounts of chemicals for the preparation of CdTe/TiO2, H2O/TiO2 and
TGA(aq)/TiO2 materials ... 27
1. Introduction
1.1. AIR POLLUTION
Air pollution is one of the major problems brought by the age of modernization and is accounted for the increasing death rates globally. In 2012 World Health Organization (WHO) reported indoor and outdoor air pollution to be responsible for one eights of a total 7 million human mortality [1]. Also, air pollution related annual health cost of US is estimated to be
£23 billion [2]. In Figure 1, the rates of estimated air pollution-originated fatal diseases were demonstrated.
Figure 1. Estimated outdoor (left) and indoor (right) air pollution-caused deaths breakdown by disease adapted from Reference [1].
Air pollutants can be classified into two types based on their formations. Primary pollutants are released directly into the air whereas secondary pollutants are formed on consequent reactions of the primary pollutants with air. In Figure 2, primary and secondary pollutants are demonstrated together. Although natural causes such as agricultural activities, volcanic eruptions, forest fires, soil erosion may lead to air pollution; the main source of air pollution has anthropogenic origins such as vehicle exhaust gases, fuel combustions and so on [2].
Figure 2. Primary and secondary air pollutants (Copyright notice © Scotland’s Environment, 2018 [4]).
United States Environmental Protection Agency (EPA) has set ambient air quality standards for six common air pollutants (known as ‘criteria air pollutants’) which incorporate sulfur dioxide, carbon monoxide, lead, ground level ozone, particulate matter and nitrogen dioxide [3]. The standard levels for all criteria air pollutants are tabulated as Table 1. The major cause of the formation of criteria air pollutants is the fossil fuel combustions by power plants, vehicles and industry.
Sulfur dioxide has a distinct odor and its short term exposure can have a negative effect on the respiratory system for humans. It can also cause acid rains which is highly dangerous for the ecosystem [3]. As carbon monoxide has no color or smell, it is known as the ‘silent killer’ [5]. A carbon monoxide molecule has 210 times greater affinity to hemoglobin compared to an oxygen molecule, therefore hemoglobin begins to transfer carbon monoxide rather than oxygen in the blood stream [6]. Long exposures can be mortal. Lead can also decrease the capacity of the blood to carry oxygen. It is also accumulated in the bones and harms nervous system, kidneys and cardiovascular system [3]. Ozone is essential for the environment and all the living; however, its location is highly critical. As demonstrated in Figure 3, there is a naturally formed ozone layer in the stratosphere which plays a big role in preventing the
called as the ground level ozone and is very harmful. It can have an adverse effect on the respiratory system and can reduce the intake of certain nutrients [3].
Figure 3. The ozone layer(Copyright notice © 7 Continents, 2018 [8]).
Particulate matter consists of different solid particles in liquid droplets in the air. PM10
particles are 10 µm diameter whereas PM2.5 has 2.5 µm, and they both can be inhaled and
transported to the lungs. Some can even reach the bloodstream causing adverse effects on the body [3].
Table 1. Current National Ambient Air Quality Standards for criteria air pollutants [3]
Pollutant Primary/
Secondary Averaging Time Level Carbon Monoxide (CO) Primary 8 hours 9 ppm
1 hour 35 ppm Lead (Pb) Primary& Secondary Rolling 3 month average 0.15 µg/m 3
Nitrogen Dioxide (NO2) Primary 1 hour 100 ppb
Secondary 1 year 53 ppb Ozone (O3) Primary& Secondary 8 hours 0.070 ppm Particulate Matter (PM) PM2.5 Primary 1 year 12.0 µg/m3 Secondary 1 year 15.0 µg/m3 Primary& Secondary 24 hours 35.0 µg/m 3 PM10 Primary& Secondary 24 hours 150 µg/m 3
Sulfur Dioxide (SO2) Primary 1 hour 75 ppb
The effect of nitrogen dioxide is going to be mentioned in the following part, as this study will focus on nitrogen dioxide (NO2) and nitric oxide (NO) based air pollution.
1.1.1. NITROGEN OXIDES (NOx) POLLUTION
NOx is a term for nitrogen oxides such as NO, N2O and NO2. During the combustion of
nitrogen containing species, especially at higher temperatures, nitrogen gets oxidized in air and forms NO(g). With further oxidation of NO, NO2 is formed [9]. Nitrogen oxides (NOx)
are toxic and also highly reactive. Hence they can cause the formation of secondary air pollutants via reacting with air. Formation of acid rain (nitric acid) can be an example of such possibilities. The reactions that take place are written in Equations (1-4) [10-12].
2NO2 + H2O → HNO2 + HNO3 (1)
4NO + 3O2 + 2H2O → 4HNO3 (2)
4NO2 + 2H2O + O2 → 4HNO3 (3)
3NO2 + H2O → 2HNO3 + NO (4)
Another secondary air pollutant which can be generated by NOx species reacting in the
atmosphere can be the ground level ozone. The reactions leading to the ground level ozone formation are given in Equations (5-8) [13].
VOC + OH → HO2 + other products (5)
HO2 + NO → NO2 + OH (6)
NO2 + hv → NO + O (7)
1.1.2. NOx REMOVAL TECHNIQUES
1.1.2.1.SELECTIVE CATALYTIC REDUCTION (SCR)
Selective Catalytic Reduction is one of the most common types of tailpipe NOx removal
techniques. This technique requires ammonia, carbon monoxide, hydrogen or hydrocarbons for the reduction of nitrogen oxides to nitrogen on the catalyst surface. Ammonia is first chemisorbed on the catalyst surface and then reduces the NOx species. The SCR reactions
using ammonia in the presence and absence of oxygen are as given in Equations (9-12) [14].
4NO + 4NH3 + O2 → 4N2 + 6H2O (9)
6NO + 4NH3 → 5N2 + 6H2O (10)
6NO2 + 8NH3 → 7N2 + 12H2O (11)
2NO2 + 4NH3 + O2 → 3N2 + 6H2O (12)
For thermal catalytic DeNOx applications, SCR technology requires a temperature range of
573 – 673 K depending on the utilized catalyst [15].
1.1.2.2.SELECTIVE NON CATALYTIC REDUCTION (SNCR)
Selective Non Catalytic Reduction (SNCR) technology resembles SCR techniques; however, it does not require a catalyst. Cutting off the cost of catalysts, SNCR seems to be a more attractive technique economically. Similar to SCR, the reactions are also carried out introducing active compounds such as ammonia and urea. Similar reactions (Eqns. 9-12) also take place for SNCR DeNOx techniques; however, this time the processes require much
higher temperatures (1073 – 1273 K for ammonia). When urea is used as the active compound, the temperature range increases even further and the following reaction takes place [16].
The high temperature dependence of these two techniques (SCR and SNCR) does not allow them to be environmentally friendly, sustainable and cost-efficient. Also further increase of the temperature (>1273 K) may cause ammonia to convert into NOx as well [17].
Hence, there is a great demand for a sustainable, cost-efficient and more environmentally friendly DeNOx technique.
1.1.2.3.PHOTOCATALYTIC NO OXIDATION & STORAGE (PHONOS)
Photocatalytic oxidative NOx storage is another DeNOx technique that is environmentally
friendly and sustainable; and can exploit readily abundant solar radiation under ambient conditions.
Photocatalysis commences with the activation of a semiconductor via solar or artificial light sources. When the absorbed photon has sufficient energy to promote electrons from the valence band (VB) to conduction band (CB) of the semiconductor; electron-hole pairs are generated. As demonstrated in Figure 4, the generated electrons can reduce the oxygen in the air to form superoxide whereas the generated holes can lead the formation of hydroxyl radicals (blue dashed arrows) [19]. Consequent reactions of these generated radicals and ions can lead to oxidation of the air pollutants such as nitric oxide. Further reactions can be listed as in Equations (14-19) [18]. NO + HOads → HNO2 (14) HNO2 + HOads → NO2 + H2O (15) NO2 + HOads → HNO3 (16) NO + O2-ads → NO3- (17) 2NO + O2- + 3e- → 2NO2 (18)
Figure 4. Main scheme of semiconductor photocatalysis.
Photocatalysis is a photoelectrochemical process and therefore requires an electrolyte support for the redox reaction promoted by the photo-generated electron-hole pairs. For DeNOx
purposed photocatalysis, the electrolyte is the surface adsorbed water molecules [19]. Hence it is crucial to employ surface adsorbed water for the photocatalytic processes.
1.2. TITANIUM DIOXIDE
For the photocatalytic decomposition of pollutants, the most widely used semiconductor is titanium dioxide [20,21]. It is chemically and thermally stable, superhydrophilic, nontoxic, strong oxidizing and cost-efficient [20-23].
1.1.1. APPLICATIONS OF TITANIUM DIOXIDE
Titanium dioxide is the most widely used titanium product and it is processed using about 95% of overall titanium ore [24]. It does not efficiently absorb the incident light in the visible region of the solar spectrum and has a high refractive index (2.49-2.54 for anatase and 2.79-2.903 for rutile phases) [24]. According to Figure 5. the most commonly end-use of titanium dioxide in 2005 corresponds to coatings which include coatings of wood products, metal furniture, coil, appliances and so on [24]. The other uses may incorporate printing inks, pharmaceutical and cosmetic purposed pigments, textile pigments, food coloring,
photocatalytic water splitting, photocatalytic air and water purification and dye-sensitized solar cells [24,25].
Figure 5. End-use of titanium dioxide in 2005, data adapted from Reference [24].
Titanium dioxide is also thermally stable, nontoxic and resistant to ultraviolet light degradation. Moreover, with the utilization of ultraviolet light, titanium dioxide can oxidize the organic materials that may cause fouling. When exposed to UV light, it becomes very hydrophilic and can be used for antifogging devices [26,27].
1.2.2. PHYSICAL PROPERTIES OF TITANIUM DIOXIDE
The photocatalytic activity of titanium dioxide has a great dependence on its physical properties such as its phase structure, specific surface area, and crystallite size [28].
In nature, titania is reported to exist in three different polymorphs which are rutile (tetragonal), anatase (tetragonal) and brookite (orthorombic) [29,30]. The bulk structures of these three polymorphs are as demonstrated in Figure 6.
Figure 6. Bulk structures of a) rutile, b) anatase, c) brookite phases of titania. Reprinted from Ref. 23 Copyright 2018 with permission from Elsevier [23].
The anatase and brookite phases of titanium dioxide are metastable while the most stable form of titanium dioxide is the rutile phase in acidic medium. In a basic medium, anatase is more stable than rutile and brookite phases [31]. Anatase and brookite forms can be transformed into rutile when heated to higher temperatures. The product of a sol gel titanium dioxide synthesis in an acidic medium results mostly in the formation of anatase phase and brookite form can be observed as a side product. That is why it is a challenge to produce pure brookite titanium dioxide with the basic synthesis protocols and there is a numerous on-going research for its synthesis [30].
Gibbs thermodynamic principle states when a fluid is in contact with its medium, equilibrium can be achieved by minimizing the free energy of the surfaces in contact. For a crystal, the orientation of each element in such a surface is important for their contribution to the total free energy. For a constant volume, the minimum total surface energy determines the equilibrium shapes of crystals [32,33]. Wulff construction for crystal growth utilizes this theory as well [32]. The Wulff structures of anatase and rutile phases of titanium dioxide are given in Figures 7 and 8.
For the anatase phase of titanium dioxide, the {101} facet comprises the majority (94%) of the structure; however, the most reactive facet is the {001} facet (6%) [25,31, 34]. The {101} facet has the lowest surface energy of 0.44 J/m2, whereas the {001} and {010} facets have higher surface energies which are 0.90 J/m2 and 0.53 J/m2 respectively [34].Although these
numbers would suggest the dominancy of {010} facet to {001}, {010} facets do not appear in the predicted Wulff geometry in vacuum and can be observed as a ‘belt around the center’ if the surface is hydrogen poor (especially basic conditions) [25,31,35].
Figure 7. Equilibrium crystal shape of anatase TiO
2 through the Wulff construction and the
evolved other shapes. Reprinted from Ref. 25 Copyright 2018 with permission from ACS [25].
For the rutile phase of titanium dioxide, with the lowest surface energy of 15.6 meV/au2, {110} facets dominate the surface. With the highest surface energy of 28.9 meV/au2, {001}
facets exist but they are nearly invisible. {100} and {011} facets are also present in this polymorph with the surface energies of 19.6 and 24.4 meV/au2 respectively [25].
Titanium dioxide has a band gap energy of 3.2 eV for anatase and 3.0 eV for rutile phases [39]. This wide band gap of titanium dioxide prevents efficient utility of the solar spectrum outside the ultraviolet region.
As indicated in Figure 9, on the surface of the earth, the visible region of the solar spectrum corresponds to about 45% of the solar energy whereas the ultraviolet region builds up only 5 % of it. Therefore, a great part of the solar spectrum cannot be utilized efficiently by titanium dioxide.
Figure 9. Solar energy distribution. (Copyright notice © Green Builder, 2018 [36])
1.2.3. PHOTOCATALYSIS WITH TITANIUM DIOXIDE
A general information of photocatalytic NOx abatement was provided in previous parts. In
this part, the utilization of titanium dioxide for photocatalytic NOx abatement will be
discussed with predicted mechanisms. The mechanism of photo-abatement of NOx on titania
surface can be issued under 3 main stages; adsorption of gas reactants to the surface of titanium dioxide, photogeneration of electron-hole pairs and oxidation of NO and water reduction [19].
In a photocatalytic NOx abatement system, O2 and H2O are crucial elements. As
photocatalysis is fundamentally a photoelectrochemical process, titanium dioxide is used as the semiconductor and the water in humidity is used as the electrolyte [19].
TiO2 + O2(g) → O2(ads) (21)
TiO2 + NO(g) → NO(ads) (22)
When water vapor is adsorbed on the photocatalyst surface, the photo-generated holes can generate OH• radicals; whereas the electrons can react with oxygen to generate superoxide anion O2- [19].
TiO2 + hv → e-CB + h+VB (23)
TiO2 (e-CB + h+VB) → TiO2 (24)
h+ + H2O(ads) → HO• + H+ (25)
e- + O2(ads) → O2-(ads) (26)
The efficiency of the photocatalyst depends strongly on the electron-hole recombination (See Equation 24) rate of the semiconductor. If the semiconductor has a low recombination rate, the photo-generated electron-hole pairs can react easier in abovementioned processes. Using the generated HO• radicals and O2- anions, NO can be oxidized.
NO(ads) + HO• → HNO2(ads) (27)
HNO2(ads) + HO• → NO2 +H2O (28)
NO(ads) + O2-(ads) → NO3- (29)
NO2(ads) + HO• → NO3- + H+ (30)
For the oxidation steps of nitrogen oxides, the superoxide anions are proven to be less efficient when compared to hydroxyl radicals [37].
𝜃𝐴 = 𝐾𝐴𝑋𝐴
1+ 𝐾𝐴𝑋𝐴 (32)
𝜃𝐵 = 𝐾𝐵𝑋𝐵
1+ 𝐾𝐵𝑋𝐵 (33)
KA and KB represent the adsorption equilibrium constants in the absence of a light source; XA
and XB represent the partial pressure in the gas phase and k is the reaction rate constant.
According to the Arrhenius and van’t Hoff’s laws k, KA and KB are dependent on temperature
[19]. 𝑘 = 𝑘0exp (−𝐸𝑎 𝑅𝑇) (34) 𝐾𝑖 = 𝐾𝑖0exp (− ∆𝐻𝑖 𝑅𝑇) (35)
In Arrhenius equation (34), Ea is the activation energy, T is the absolute temperature and R is
the universal gas constant. Using L-H model, one can the the rate equation as follows [19].
−𝑟𝑁𝑂=
𝑘′𝐴𝐶𝑁𝑂𝐶𝐻2𝑂−𝑘′𝐵𝐶𝑁𝑂2
(1+𝐾′
𝐻2𝑂𝐶𝐻2𝑂+ 𝐾′𝑁𝑂𝐶𝑁𝑂−𝐾′𝑁𝑂2𝐶𝑁𝑂2)2 (36)
In Equation (36), reaction rate of NO (-rNO) is given where k’A and k’B are the reaction rate
constants; K’H2O, K’NO and K’NO2 are the adsorption equilibrium constants of H2O, NO and
NO2 respectively; CH2O, CNO and CNO2 are gas phase concentrations of H2O, NO and NO2
respectively [19].
The product of this process are HNO3 and nitrates; however, HNO2 and NO2 can also be
generated as side products. If the process yields NO3- and HNO3 on the surface of the
catalyst, it will begin to saturate the surface and cover the active sites. Therefore, a regeneration of the photocatalyst should be done by cleaning the surface with water which can dissolve the nitrates on the surface. For outdoor coating usages, this can be done by rain. There are many factors affecting the efficiency of a photocatalyst. As mentioned earlier, one is the recombination rate of the semiconductor. A drawback of titanium dioxide is that it has a high recombination rate, hence it cannot efficiently employ the photo-generated electron-hole pairs in further steps [38]. When the photo-generated electron-hole pairs recombine,
they will release their extra energy as photons as long as they obey the transition rule of momentum conversation (See Equations 37-38) [39].
𝐸𝑔 = ℏ𝜔𝑝ℎ𝑜𝑡𝑜𝑛 (37)
ℏ𝑘𝑒′− ℏ𝑘𝑒 = ±ℏ𝑞𝑝ℎ𝑜𝑡𝑜𝑛 (38)
In above equations, ℏ represents the reduced Planck constant, ke’ and ke represent the
electron wave factors at the valence and conduction band respectively, qphoton represent the
wave vector of the assisted phonon and 𝜔𝑝ℎ𝑜𝑡𝑜𝑛 represent the angular frequency of the emissive photon [39]. As rutile and brookite phases have direct band gaps, an electron emits a photon only for the recombination and ke’ = ke. However, as the anatase phase is an indirect
band gap semiconductor, ke’ ≠ ke. Hence, the excited electrons cannot directly recombine
with the holes, which would increase the lifetime of the photo-generated excitons and decrease the recombination rate [39]. As a result, it can be claimed that anatase is a better photocatalyst compared to rutile.
Figure 10. Recombination processes of photo-generated electrons and holes for a) indirect gap anatase and b) direct gap rutile. Reprinted from Ref. 39 Copyright 2018 with permission from Royal Society of Chemistry [39].
Figure 11. Effect of NO inlet concentration on photocatalytic NOx abatement rate. Reprinted
from Ref. 44 Copyright 2018 with permission from Elsevier [44].
The concentration of the water vapor (relative humidity) is also an important factor. Since water is crucial for photocatalysis, enhanced photocatalytic efficiency would be expected with increasing % relative humidity. In literature, it is experimentally shown that as the humidity rises, the % NO conversion increases. However, after 50% of relative humidity, system reaches a steady state as shown in Figure 12 [41].
Figure 12. Effect of % relative humidity on %NO conversion (inlet NO concentration:40 ppm). Reprinted from Ref. 41 Copyright 2018 with permission from Elsevier [41].
Flow rate/residence time of the polluted air is also as important as the concentration of it. The higher the flow rate of the polluted air, the smaller the residence time will be, therefore it will have shorter contact with the photocatalyst.10 In Figure 13, it can be observed that as the flow
rate increases, the %NOx conversion decreases due to less contact of photocatalyst with
polluted air [42].
Figure 13. Effect of volumetric flow rate of polluted air on %NOx conversion. Reprinted
from Ref. 42 Copyright 2018 with permission from Elsevier [42].
Light intensity can also influence the photocatalytic activity of a photocatalyst. As indicated in Figure 14, Yu and Brouwers demonstrated the relation between light intensity and % NOx
conversion. By using two different inlet values (0.5 ppm and 1.0 ppm), they showed the effect of light intensity, varying from 1.0 to 13.0 W/m2, on % NOx conversion. It can be
clearly observed that by increasing the light intensity, % NOx conversion can be
logarithmically increased [42].
Figure 14. Effect of light intensity on % NOx conversion. Reprinted from Ref. 42 Copyright
light for the degradation of the pollutants. However, keeping the irradiated catalyst surface constant, after the maximum thickness of the photocatalyst is reached, light cannot reach lower layers. Hence there is an optimal mass value (mopt) [43,44].
Figure 15. Effect of the mass of a catalyst on pollutant conversion rate. Reprinted from Ref. 45 Copyright 2018 with permission from Elsevier [45].
There have been many successful attempts to enhance the photocatalytic efficiency of titanium dioxide with nonmetal doping [40,46], metal doping [41], surface modifications with polymers [47] etc. In this study, an additional semiconductor with a more negative conduction band level than titanium dioxide was introduced to the catalyst composition so that the photo-generated electron from the quantum dot can be injected to the conduction band of titania whereas the photo-generated hole in the valence band of titania can be injected to the valence band of the quantum dot [38]. Also if the quantum dot has a photon absorption in the visible region of the solar spectrum, it would be possible to harvest more visible light which cannot be sufficiently achieved by titanium dioxide. Hence an enhancement of the photocatalytic efficiency is expected.
1.3. QUANTUM DOTS (QDs)
Quantum dots are semiconductor fragments that are only few nanometers in size. They keep their bulk bonding geometry; however, the optical and electronic properties can be altered by tuning their sizes [48].
QDs were first discovered by Alexei Ekimov in 1981 when he was working at the Vavilov State Optical Institute on semiconductor doped glasses. Working with CdS, CdSe, CuCl and CuBr; he noticed that there were nano-sized crystals in the glass matrix which can absorb light at much lower wavelengths than expected. He collaborated with the theoretician
dominated by their size [49,50]. In 1985, Louis E. Brus from Bell Labs could successfully conduct the colloidal synthesis of CdS quantum dots. The synthesized colloids exhibited a blue-shift compared with bulk CdS, which is suggested by the quantum confinement effect as well [50]. However, the term of ‘quantum dots’ was first used in a published paper of Mark Reed in 1988 [51].
Since then, there has been a great number of research on the synthesis, characterization and applications of the QDs. They are most commonly used as light emitting devices (LED) and lasers [52]. They are recently applied to computers to enhance them in terms of speed and increased storage [53]. With the development of quantum bits (qubits), quantum computation field gained popularity. QDs are also widely utilized for bio-imaging and bio-labeling purposes [54]. Some of the major challenges for bio applications are the limited aqueous solubility of the quantum dots and immune response limitations. Both for in vivo and in vitro experiments, aqueous solubility is an important criterion. Since many quantum dots are prepared in organic dispersants and are not dispersable in water, there is a limitation [55]. Recently, the focus has shifted to the synthesis of aqueous soluble quantum dots. In this study, TGA-capped CdTe QDs are employed which are also an example of water soluble QDs.
In order for size to play a role in tuning the electronic and optical properties, the size of the semiconductor should be below the bulk semiconductor Bohr radius which can be defined by Equation (39), where represents the dielectric constant of the material, m* represents the mass of the particle whereas m is the rest mass of the electron and finally ao is the Bohr
radius of the hydrogen atom [56].
𝑎𝐵 = 𝜀 𝑚
𝑚∗ 𝑎𝑜 (39)
When the semiconductor crystal size gets so small, the quantum confinement effect causes an increase in the excitonic transition energy and a blue shift in the absorption and luminescence band gap energies [56].
Figure 16. An illustration of the band gap difference for bulk and quantum dot.
Besides, as illustrated in Figure 16, quantum confinement creates discrete energy levels whereas for bulk materials, there are almost continuous valence and conduction bands [57]. Playing with only the size of these quantum dots, one can tune the electronic and optical properties (Figure 17).
Figure 17. An illustration of the quantum dot size effect on the optical properties of the material (a red shift in emission wavelengths with increasing size).
(40) where ħ is the reduced Planck constant, E is the Eigen energy value and is the wavefunction of the particle. ‘Particle in a sphere’ model, can be employed to model QD. In this model, while the interior of the sphere has a zero potential energy, outside the walls are assigned with an infinitely large potential energy. The potential energy is therefore given as in Equation (41).
𝑉(𝑥) = {0, 0 < 𝑥 < 𝑟,
∞, 𝑜𝑡ℎ𝑒𝑟𝑤𝑖𝑠𝑒,, (41)
where x is the position within the sphere and r is the radius. It implies that the particle in the sphere has no force acting on it and it can freely move within that region. When it touches the wall, there is an infinite force on the particle to prevent it from escaping [58].
Hence, setting the potential to zero in Schrödinger equation, allowed electron and hole energy levels can be determined as in Equations (42-43).
𝐸𝑛𝑒𝑙𝑒 = ℏ 2𝜌2 𝑛𝑒𝑙𝑒 2𝑚𝑒𝑅2 (42) 𝐸𝑛ℎ𝑙ℎ = ℏ2𝜌2𝑛ℎ𝑙ℎ 2𝑚ℎ𝑅2 (43)
In above equations, ne, nh, le, lh represent the principal and orbital quantum numbers of the
electrons and holes whilst 𝜌𝑛ℎ𝑙ℎ and 𝜌𝑛𝑒𝑙𝑒 represent the sets of numbers specified by the roots of Bassel spherical functions which are 10= 3.142, 11= 4.493 and 12= 5.763 for 1s, 1p and
1d quantum states [48]. The final equation for ∆E estimation can be written as follows.
∆𝐸 ≈ 𝐸𝑒10+ 𝐸ℎ10− 𝐸𝑔 = ℏ2𝜋2(𝑚𝑒+𝑚ℎ) 2𝑅2𝑚 𝑒𝑚ℎ − 1.8𝑒2 𝜀𝑅 (44)
1.4. SCOPE OF THE STUDY
In this study, aqueous suspension of thioglycolic acid capped CdTe quantum dots were employed in an attempt to enhance the photocatalytic activity of the titanium dioxide.
As titanium dioxide source, commercially available benchmark catalyst Degussa P25 (Evonik) was provided from Sigma Aldrich. Degussa P25 is a mixture of anatase and rutile phases of titanium dioxide with a tiny fraction of amorphous titania as well. In the literature, the composition of Degussa P25 is given as ~80% anatase, ~15% rutile and ~5% amorphous titania [59]. Due to the presence of two different titania polymorphs, Degussa P25 can create a synergetic effect between these crystalline phases [60]. It has been also claimed that photo-generated electrons of the rutile phase can migrate to the conduction band of the anatase phase, which would increase the lifetime of photo-generated excitons and decrease the recombination rate efficiently [61-63]. Nonetheless, most of the times, it was not possible to observe this synergetic effect when the separate phases were mixed together [64]. The reason could be the difficulty of getting the phases to contact. As demonstrated in Figure 18, Su et al. observed a distinct synergetic effect when the mixture has 40%-80% of the anatase phase and the optimum ratio of 60% anatase to 40% rutile mixture outperformed the pure anatase phase by ~50% [59].
Figure 1. The effect of anatase content to rate constant K where a peak shaped offset (40%<[A]<80%) indicates the synergism between anatase and rutile phases. Reprinted from Ref. 59 Copyright 2018 with permission from American Chemical Society [59].
Hence, owing to the synergetic effect, Degussa P25 is preferred as the basis of our photocatalyst. However, due to the aforementioned drawbacks of titanium dioxide such as having a large band gap that makes it a UV active photocatalyst and high recombination rate; it needed to be enhanced. In this study, the enhancement was achieved by incorporating CdTe
QDs. The main purpose of the introduction of CdTe quantum dots to the titania system can be explained with Figure 19. By the addition of CdTe QDs, visible light can also be harvested by the QDs and due to the electron migration from the conduction band of CdTe to the conduction band of titania, charge separation can be achieved which would decrease the recombination rate.
Figure 2. A possible scheme of electron and hole transport in CdTe/TiO2 photocatalysis.
Thioglycolic acid-capped CdTe quantum dots (demonstrated in Figure 20) were preferred due to their narrow band gaps which can absorb both visible and UV light. Another important factor is that these quantum dots can be suspended in an aqueous medium rather than an organic dispersant. With the organic dispersants, especially with the highly volatile ones, it was not easy to sustain the stability of the suspension. As the dispersant can be evaporated, the quantum dots tend to agglomerate. Moreover, it is highly possible that these organic dispersants can alone functionalize the titania surface and affect the photocatalytic activity of the catalyst.
2. EXPERIMENTAL
2.1. SAMPLE PREPARATION
Sample preparation of CdTe/TiO2 composite materials commences with the colloidal
synthesis of CdTe quantum dots and is followed by the incorporation of these quantum dots to the base photocatalyst titanium dioxide.
2.1.1. PREPARATION OF CdTe QUANTUM DOTS
The protocol for colloidal synthesis of water soluble TGA-capped CdTe quantum dots was adapted from Andrey Rogach’s paper [65]. The chemicals used for this synthesis are listed on Table 2.
Table 2. The required chemicals for the colloidal synthesis of thioglycolic acid capped CdTe quantum dots.
Chemical Name Specification
Cadmium perchlorate hexahydrate Alfa Aesar
Aluminum Tellurite CERAC Inc., pure 99.5% Thioglycolic acid (TGA) Fluka, purum 98%
Milli-Q Water Milli-Q Academic
Sodium hydroxide Riedel-de Haen
Sulfuric Acid Fluka, 95-97%
Iso-propanol TEKKIM
Silica gel TEKKIM
First, 4.59 g of the Cd precursor cadmium perchlorate hexahydrate (Cd(ClO4)2.6H2O) was
dissolved in 250 ml Milli-Q water in a 1 L 3-neck flask. The reaction system was constantly stirred with a magnetic stirrer throughout the synthesis protocol. 250 ml Milli-Q water and 1 ml (1.33 g) of thioglycolic acid were injected simultaneously into the reaction flask. Thioglycolic acid (TGA) was used as the ligand for the functionalization of the quantum dots (capping agent). While the flask was stirred, 1 M sodium hydroxide (NaOH) solution was prepared aside. This NaOH solution was used to adjust the pH of the reaction system to
11.8-12.0 on dropwise addition. Next, 0.8 g of the Te precursor aluminum telluride (Al2Te3) was
placed into a 25 ml 3-neck flask as shown in Figure 21.
Since aluminum telluride is extremely sensitive to oxygen, argon gas was used to sweep off the oxygen from the reaction system. Since a harmful hydrogen telluride (H2Te) gas was
released from the system on the next steps, an absorption flask containing the 10% NaOH solution was connected to the system to capture this gas before escaping into the air. Then, 0.5 M sulfuric acid (H2SO4) was injected using a syringe into the 3-neck flask containing the
aluminum tellurite dropwisely. Due to the chemical reaction in Equation (45), hydrogen telluride gas was released.
Al2Te3 + 3H2SO4 → 3H2Te + Al2(SO4)3 (45)
This gas was passed through the reaction flask with argon flow for half an hour where finally the color of the solution turned pinkish. Then, the 25 ml 3-neck flask was detached from the system and the reaction flask was heated while keeping the chiller on to condense the evaporated water. Quantum dot growth commenced with the boiling of the reaction suspension. By altering the time, the size of the quantum dots, hence the optical properties of the dots, were tuned. In the first minute, the emission spectrum of the dots appeared to be blue; for 5-10 minutes this shiftd to green and eventually to red. After deciding on the emission wavelength, therefore the time, the reaction was stopped by cooling the reaction medium. After the system was cooled down, the quantum dots were filtered and cleaned by centrifuging with Milli-Q water at 4500 rpm for 5 min. The quantum dots were stored in aqueous medium in dark. For this particular work, the molar concentration of the quantum dot suspension was increased 3 times. For 15 ml quantum dot aqueous suspension, 7.5 ml isopropanol was added to precipitate the dots. After centrifuging and drying, the precipitated dots were dissolved in 5 ml Milli-Q water and dispersed by sonication.
Figure 21. A scheme for the reaction system of thioglycolic acid-capped CdTe QDs [66].
2.1.2. PREPARATION OF CdTe/TiO2 COMPOSITE MATERIALS
Commercially available titanium dioxide benchmark Degussa P25 (also known as Evonik) is chosen as the base material for being a ‘gold standard’ for titanium dioxide photocatalysis [67].
As mentioned in the previous part, thioglycolic acid capped CdTe quantum dots were suspended in de-ionized water. Hence, in order to rule out any possible influence of water on photocatalytic activity measurements, pure water samples were also dosed on P25 with the same loadings in control experiments.
Since the capping agent thioglycolic acid can play a part in the PHONOS (photocatalytic NOx oxidation and storage) system, another control material was also prepared using aqueous
solutions of thioglycolic acid (TGA) on TiO2. The aqueous solution of TGA was prepared
according to the initial concentration of TGA in the colloidal synthesis of the quantum dots. For this reason, 1 ml (1.33 g) of TGA was dispersed into 250 ml of de-ionized water. The solution was sonicated for 30 min.
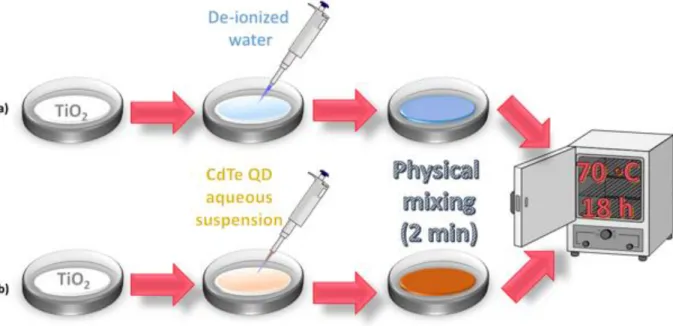
As shown in Figure 22, for the preparation of CdTe/TiO2 composite materials, different
volumes of CdTe aqueous suspension were drop-casted on 250 mg of TiO2 powder in a 6 cm
diameter petri dish. After physically mixing for 2 min, the slurry was placed into oven and dried at 70 C for 18 h (Figure 22.a). Same steps were followed for the blank material (Figure 22.b) and the TGA(aq)/TiO2 samples as well.
Figure 22. Stepwise preparation of a) H2O/TiO2 control material and b) CdTe/TiO2
composite materials.
For the synthesis of the composite material CdTe/TiO2, H2O/TiO2 blank (control) material
and TGA(aq)/TiO2 samples, different loadings were prepared. In Table 3, the abbreviated
names of the samples were given with the required chemical amounts for their synthesis. Since the amount of powder TiO2 was kept constant for each sample, the names of the
samples were abbreviated with the volume of the additives (CdTe, H2O and TGA(aq)).
It was observed that addition of 0.5 ml of aqueous TGA solution on P25 led to poisoning of the active sites of TiO2. Thus the preparation with further additive increase was not required
Table 3. Required amounts of chemicals for the preparation of CdTe/TiO2, H2O/TiO2 and TGA(aq)/TiO2 materials. Sample Name TiO2 powder (Degussa P25) amount (mg) Aqueous CdTe suspension amount (ml) De-ionized H2O amount (ml) Aqueous TGA solution (ml) 0.1 H2O/TiO2 250 0 0.1 0 0.5 H2O/TiO2 250 0 0.5 0 1.0 H2O/TiO2 250 0 1.0 0 2.0 H2O/TiO2 250 0 2.0 0 0.1 CdTe/TiO2 250 0.1 0 0 0.5 CdTe/TiO2 250 0.5 0 0 1.0 CdTe/TiO2 250 1.0 0 0 2.0 CdTe/TiO2 250 2.0 0 0
0.1 TGA(aq)/TiO2 250 0 0 0.1
0.5 TGA(aq)/TiO2 250 0 0 0.5
2.2. PHONOS (PHOTOCATALYTIC NOX OXIDATION AND STORAGE) SYSTEM
2.2.1. EXPERIMENTAL SETUP OF THE PHONOS SYSTEM
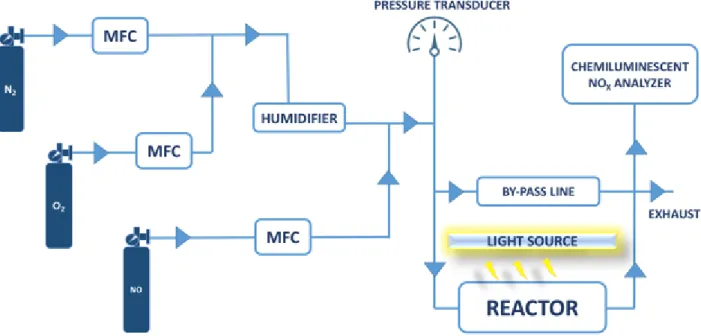
For all photocatalysts, photocatalytic NOx oxidation and storage performance measurements
were conducted using the custom designed flow reactor system demonstrated in Figure 23. The flow of high purity gases (Linde 99.99 % pure N2, 99.00% pure O2 and NO diluted in
100 ppm N2) were controlled with control valves (Swagelok, SS Belows-Sealed Valve,
SS-4H) and mass flow controllers (abbreviated as MFC). The volumetric flow rates were set to be 0.750 SLM (standard liters per minute), 0.250 SLM and 0.010 SLM for N2, O2 and NO
respectively. Before connecting with NO gas line, N2 and O2 gases were passed through a
PermSelect silicone fiber membrane. On the periphery of the membrane, water is circulated using a pump chiller system. By tuning the temperature, the humidity of the gas mixture is adjusted. This artificially created polluted air of 1.010-liter volume carrying 1 ppm NO (g) was introduced to the reaction chamber. The changes in the gas concentrations (NO, NO2,
NOx) inside the reaction chamber were monitored using a chemiluminescent NOx analyzer,
during a typical PHONOS catalytic activity measurements. It demonstrates the decrease in NO inlet gas concentration and the production of NO2 gas in the outlet.
The working principle of the chemiluminescent NOx analyzer depends on the NO gas in the
reactor. Inside the analyzer, there is an ozonizer unit which oxidizes the oxygen filtered from the atmospheric air into ozone (O3) by using a UV light source inside the unit. This produced
ozone gas is introduced to the reaction chamber where it reacts with the NO gas to form excited state NO2* by Equation (46).
NO + O3 → NO2* + O2 (46)
NO2* species luminesce broadband photons as they go back to lower energy states. This
phenomenon can be shown in Equation (47) and it is called as chemiluminescence.
NO2* →NO2 + hv (47)
In an alternating second line of the analyzer, NO2 in the NOx mixture is reduced to NO by a
catalytic NOx converter and then re-oxidized to excited NO2 by ozone to measure the NO2
concentration in the NOx mixture. By adding the measured NO and NO2 concentrations, the
total NOx concentration in the reactor is determined [68]. Note that the utilized NOx
analyzer does not detect NOx species other than NO and NO2 (e.g. N2O). However former
studies indicate that formation of N2O by the photocatalyst only occurs in the absence of H2O
in the gas inlet, while presence of water leads to negligible amounts of N2O [80]. Thus, NO
and NO2 are the only predominantly existing NOx species in the current photocatalytic
Figure 23. A block diagram of the currently used custom-made photocatalytic flow reactor system setup.
For the photocatalytic activity measurements, depending on the photocatalyst, two different light sources were used. For UVA light experiments, two 8W UVA lamps (F8W/T5/BL350, Sylvania/Germany) were used, whereas for visible light experiments, a 35 W metal halide lamp with ceramic burner (HCI-TC 35 W/942 NDL PB 400–700 nm range, Osram) was utilized. Since a small amount of UV light was emitted from the metal halide lamp, a commercial VIS-transparent UV-blocker/filtering film (LLumar window film UV CL SR PS (clear)) was placed on top of the reactor for visible light experiments. The incoming light flux was measured before and after each measurement with a photo-radiometer (HD2302.0, DeltaOhm/Italy) using a UVA probe (315-400 nm) and PAR probe (400-700 nm) for UVA and visible light measurements, respectively. The % relative humidity and temperature values in the reaction chamber were controlled before and after each measurement using a Hanna HI 9565 humidity analyzer. Typical values for % relative humidity and temperature were 50±3 % and 23±2 ºC, respectively. However, when using a visible lamp, the temperature values increased by up to 20 ºC, depending on its distance from the reactor. Therefore the influence of the thermal heating was also briefly studied (see Appendix).
![Table 1. Current National Ambient Air Quality Standards for criteria air pollutants [3]](https://thumb-eu.123doks.com/thumbv2/9libnet/5980815.125343/19.892.218.676.204.518/table-current-national-ambient-quality-standards-criteria-pollutants.webp)
![Figure 5. End-use of titanium dioxide in 2005, data adapted from Reference [24].](https://thumb-eu.123doks.com/thumbv2/9libnet/5980815.125343/24.892.145.756.161.548/figure-end-use-titanium-dioxide-data-adapted-reference.webp)
![Figure 33. a) Powder sample cell b) powder cell inserted into sample holder c) Cary 2500 internal DR accessory d) liquid cell holder [75]](https://thumb-eu.123doks.com/thumbv2/9libnet/5980815.125343/56.892.203.681.107.452/figure-powder-sample-powder-inserted-sample-internal-accessory.webp)