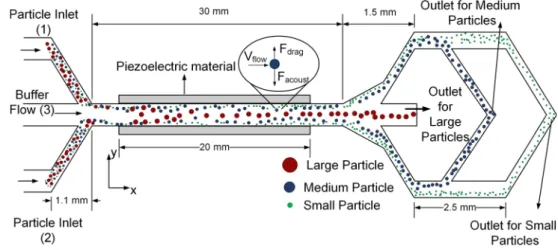
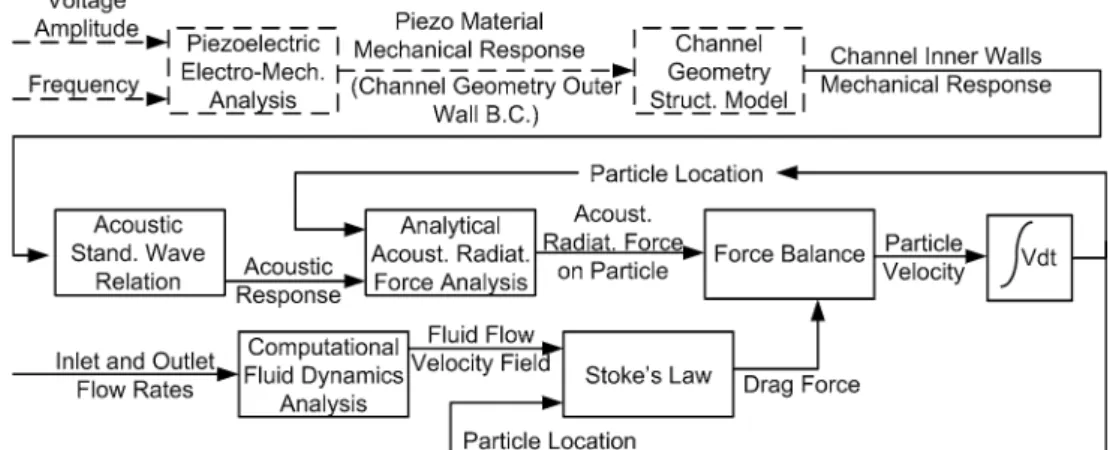
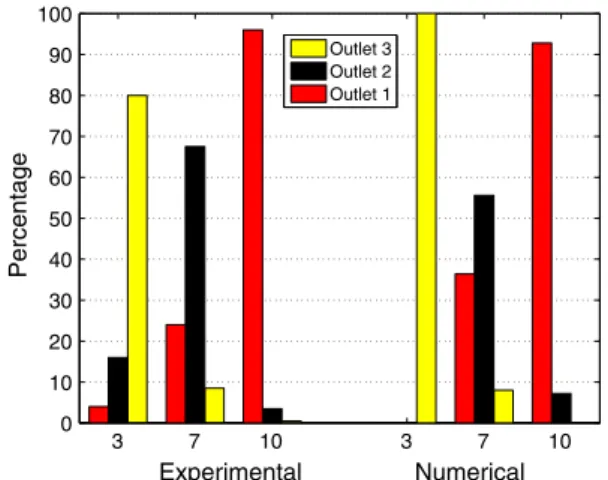
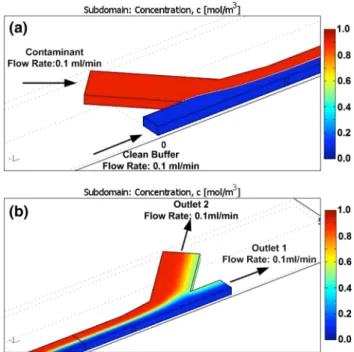
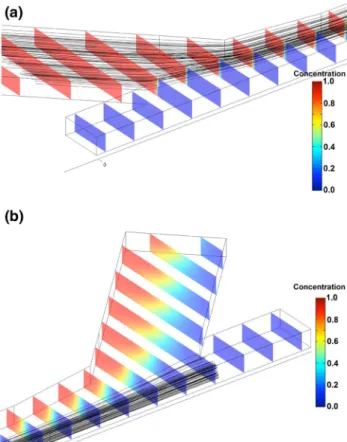
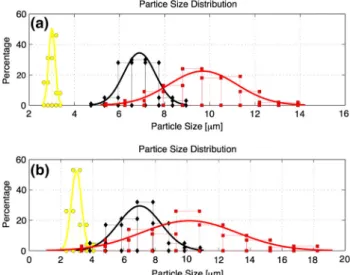
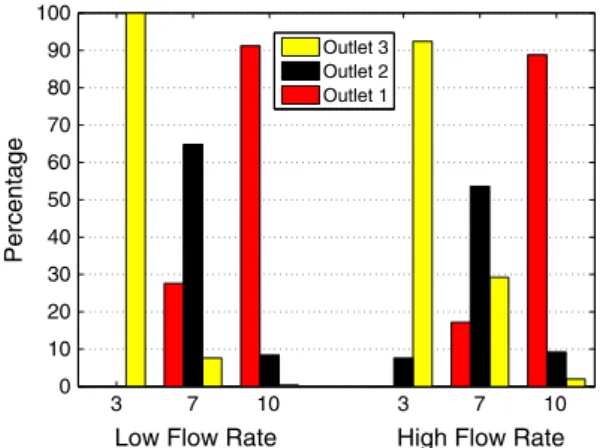
Numerical modeling of ultrasonic particle manipulation for microfluidic applications
Tam metin
Şekil

Benzer Belgeler
Bu nedenle, fiziksel yöntemlerin etkin olmadığı durumlarda ve/veya yüksek saflıkta kuvars üretmek için liç gibi çeşitli asit çözeltilerinin kullanıldığı kimyasal
Analyzing Big Data requires a vast amount of storage and computing resources. We need to untangle the big, puzzling information we have
We introduce the single allocation incomplete p-hub median, hub location with fixed costs, hub covering, and p-hub center network design problems to the literature.. Lastly,
Here we review first the studies on the uncapacitated multiple allocation p-hub median problem (UMApHMP) and the capacitated multiple allocation hub location problem with fixed
In the present paper, we use the ideas of Gould (1989) to give a new algorithm with rate of convergence results for the smooth Huber approximation.. Results of computational tests
“Otel İşletmelerinde Müşteri Sadakati Oluşturma: İstanbul’daki Beş Yıldızlı Otel İşletmelerinde Bir Uygulama”, Yayımlanmamış Yüksek Lisans Tezi, Abant İzzet
This paper presents a new approach to enhance the clustering problems with the bio-inspired Cuttlefish Algorithm (CFA) by searching the best cluster centers that can minimize
A New Risk Score to Predict In-Hospital Mortality in Elderly Patients With Acute Heart Failure: On Behalf of the Journey HF-TR Study Investigators.. Gu¨lay Go¨k, MD 1 , Mehmet
