Article History Received: 03.01.2020
Received in revised form: 12.10.2020 Accepted: 16.12.2020
Available online: 31.12.2020 Article Type: Research Article
https://dergipark.org.tr/tr/pub/adyuebd
The Adaptation of Math and Science
Engagement Scales in the Context of
Science Course: A Validation and
Reliability Study
Gizem Turan Gürbüz1
, Esra Açıkgül Fırat2, Murat AYDIN3
1
Ministry of National Education 2
Adıyaman University, Faculty of Education, Adıyaman 3Adıyaman University, Faculty of Education, Adıyaman
ADIYAMAN UNIVERSITY
Journal of Educational Sciences
(AUJES)
To cite this article:
Turan Gürbüz,G., Açıkgül Fırat,E. & Aydın, M. (2020). The Adaptation of Math
and Science Engagement Scales in the Context of Science Course: A Validation and
Reliability Study. Adiyaman Univesity Journal of Educational Sciences, 10(2),
122-131.
Volume 10, Number 2, 12.2020, Page 122-131 ISSN: 2149-2727
DOI: http://dx.doi.org/10.17984/adyuebd. 670173
The Adaptation of Math and Science Engagement Scales in the Context of
Science Course: A Validation and Reliability Study
*Gizem Turan Gürbüz, Esra Açıkgül Fırat2**
, Murat AYDIN3
1
Ministry of National Education
2Adıyaman University, Faculty of Education, Adıyaman 3Adıyaman University, Faculty of Education, Adıyaman
Abstract
In this study, The Math and Science Engagement Scales developed by Wang et al. (2016) was adapted to Turkish in the context of science course and, the validity and reliability studies were conducted. The original version of the scale consists of 4 dimensions and 33 items. These dimensions are; cognitive engagement, behavioral engagement, emotional engagement, and social engagement. During the adaptation phase, the items were translated into Turkish by three experts. The Turkish forms were examined and the draft form of the scale was obtained by the researchers. Then, the two experts of the two languages were examined through the language equivalence expert form for word usage and cultural suitability. The participants of the study consisted of 519 students in 6., 7., and 8. grades studied at two secondary schools in a small scale city in the south east of Turkey during the 2019–2020 academic year. The convenience sampling method was used to determine the participants. Confirmatory factor analysis (CFA) was applied to the data obtained after the implementation. The fit index values obtained as a result of CFA (χ2 / df = 1.75; RMSEA = 0.038; SRMR = 0.049; RMR = 0.072; CFI = 0.98; NFI = 0.96) show that the 4-factor structure of the scale is acceptable. As a result of the reliability analysis, the Cronbach alpha reliability coefficient of the Turkish form of the scale was 0.90 and the Guttman Split-half coefficient was 0.81. Finally, it can be said that the validity and reliability of the 33-item and 4-dimensional Turkish form of the scale adapted with this study can be used to determine student engagement in science classes. Add your abstract here.
Key words: Science education, Student engagement, Scale adaptation, Secondary school students
Introduction
Interdisciplinary approaches in education have recently become popular. Although disciplinary knowledge has been developed over the centuries and forms the basis for exploring field-specific knowledge, the integration of disciplines has also been discussed for over 100 years (Czerniak & Johnson, 2007). Nowadays, the term “interdisciplinary teaching” “is widely used in all fields of education due to the growing awareness of the intrinsic value and benefits of interdisciplinary teaching (You, 2017). The increasing importance of interdisciplinary approaches has led to the expansion of STEM (Science, Technology, Engineering, and Mathematics) integration in science education. Interdisciplinary science education has been identified as a factor in STEM that encourages students to be actively involved and ready for the workforce and, among other benefits, contributes to the development of holistic thinking (Kezar & Elrod, 2012). Therefore, STEM is seen as a holistic approach to curriculum and teaching (Yıldırım et al., 2018). Thus, STEM education started to take place in the science curriculum in many countries.
Turkey has also made various studies to adapt to this change and development. STEM integration has taken its place in the curriculum of science courses with the updated curriculum in 2018 (MoNe, 2018). In the majority of STEM-based education programs, including in Turkey (MoNe, 2018), with long-time involvement of students in authentic tasks that require problem solving and applications, to help them see the connections between disciplines are used in projects (Lesseig et al., 2017). These interdisciplinary projects; to solve problems based on mathematics /science concepts and procedures, combining teamwork with engineering design methodology, using appropriate technology (Shaughnessy, 2013). Student engagement is a strong predictor of academic performance and selection process (Hughes et al., 2008). Student engagement is generally defined as a function of factors such as human needs, emotion, intention, motivation, interests, identity (Azevedo et al., 2012). Therefore, student participation has an important role in the process of conducting STEM projects. Studies indicating that there is a positive relationship between student participation and student
*This study was presented as an oral presentation at VIth International Eurasian Educational Research Congress (EJERCongress 2019)
**
achievement, which is an indicator of academic performance (Baron & Corbin, 2012; Kahraman, 2014; Reeve & Tseng, 2011; Willms et al., 2009). In addition to student achievement, studies are indicating that there is a connection between student engagement and affective characteristics (Kahraman, 2014; Turner et al., 2014; Willms et al., 2009). Kahraman (2014), by addressing the multidimensional student engagement, using the TIMSS 2011 data in Turkey, students were aimed to investigate the relationship between the contributions and achievements in Grade 4 and Grade 8 science courses in his study. According to a result obtained from the study, it was observed that while affectionate science lessons had a positive effect on success in 4th-grade students, it was found that school did not have a significant effect on success. In the 8th grade, a positive effect was determined in both dimensions.
When the literature on student engagement is examined, it is seen that there is a broad consensus that it is a multidimensional structure that includes behavioral, emotional, and cognitive components (Fredricks et al., 2004; Wang et al., 2011). Active participation of students with its multidimensional structure also plays a key role in STEM careers (Wang & Degol, 2014). Therefore, to increase students' engagement in science classes and identify students at high risk of not participating in STEM practices, “student engagement” should be conceptualized and measured appropriately (Wang et al., 2016). When the literature is examined, the attitude towards STEM (Aydın et al., 2017; Ceylan et al., 2018; Damar et al., 2017) and self-efficacy (Özdemir et al., 2018; Yıldırım et al., 2018). When the literature on student participation is examined, general scales related to student participation are included (Eryılmaz, 2014; Yıldırım et al., 2017). Eryılmaz (2014), in a study aimed to develop a measurement tool to determine the engagement level of university students, examined student engagement in the dimensions of emotional engagement, cognitive engagement, and behavioral engagement. Lightning et al. (2017) adapted the Student Engagement Scale developed by Mazer (2012) into Turkish and conducted validity and reliability analyzes. This scale was developed to measure the level of participation of university students. The scale consists of 13 items and 4 dimensions (in-class silent behaviors, in-class verbal behaviors, thinking about course content and out-of-class behaviors). In Turkey, Yerdelen-Damar et al. (2020) conducted a Turkish adaptation study of “The Math and Science Engagement Scale” in the context of physics lesson. However, a scale for determining student engagement for the secondary school science course was not found. Therefore, there is a need to determine student engagement in the science class in a multidimensional way. From this point of view, The Math and Science Engagement Scales developed by Wang et al. (2016) was adapted to Turkish in the context of science course and the validity / reliability studies were conducted in this study.
Method
Research Design
This study includes adapting The Math and Science Engagement Scales was developed by Wang et al. (2016) to Turkish in the context of science course, and conducting the validity and reliability studies.
Participants
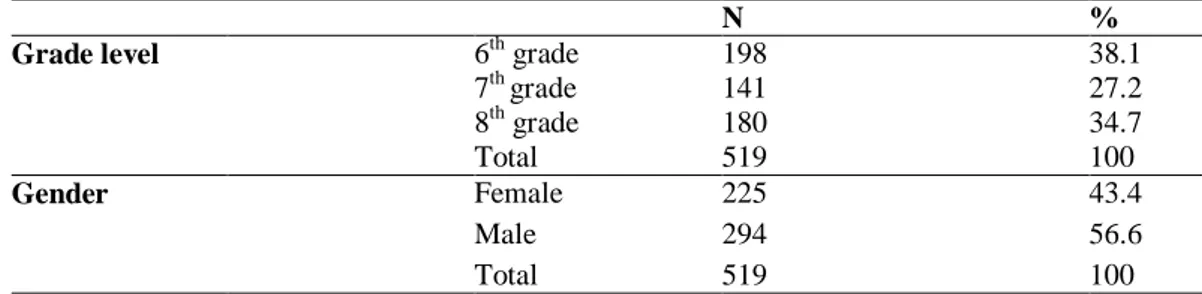
The participants of the study consisted of 519 students in 6th, 7th and 8th grade studied at two secondary school classrooms in a small-scale city in the south east of Turkey during the 2019–2020 school year. The convenience sampling method was used to determine the participants (Fraenkel et al., 2012). The distribution of the participants by gender and grade level is as Table 1.
Table 1. The distribution of the participants
N %
Grade level 6th grade 198 38.1
7th grade 141 27.2 8th grade 180 34.7 Total 519 100 Gender Female 225 43.4 Male 294 56.6 Total 519 100
Research Instrument and Procedure
Within the scope of the study, the science dimension of The Math and Science Engagement Scales was translated into Turkish, and validity and reliability studies were conducted. The original version of the scale consists of 4 dimensions and 33 items. These dimensions are; cognitive engagement (8 items), behavioral engagement (8 items), emotional engagement (10 items), and social engagement (7 items). During the adaptation phase, the items were translated into Turkish by three experts. The Turkish forms were examined and
the draft form of the scale was obtained by the researchers. The draft form was reviewed by the Turkish expert for clarity and necessary corrections were made. Then, the draft scale was examined by two experts who have mastered both languages in terms of word usage and culture suitability through the language equivalence expert form. In order to determine the consistency between experts, the formula suggested by Miles and Huberman (1994) was used (reliability = consensus/consensus + dissidence). In terms of word usage, experts differed in the 3,9, 20, and 27th items. For this reason, the consistency between experts is calculated as 29/33 = 0.87 in terms of Word usage. In terms of culture suitability, the consistency between experts was calculated as 31/33 = 0.93 due to dissidence in the 1 and 24th items. Also, corrections were made in the 3, 5, 9, 21, and 27th items, which were determined to be a problem in terms of the language used in line with the opinions of the experts, and the scale was finalized.
Data Analysis
The data obtained as a result of the implementation of the Turkish form of the scale was converted to z-scores and outliers were checked. Z values less than -3 and + 3 were accepted as outliers (Çokluk et al., 2010). Then, skewness, kurtosis, mode, median, mean of the values, and histogram / Q-Q plot graphs were examined to determine whether the item scores in the scale showed normal distribution. According to the findings, it was determined that the data showed normal distribution. Then Mahalanobis distances were calculated for multivariate normality analysis. Mahalanobis distances should be at p <.001 for the determination of multivariate outliers (Tabachnick & Fidell, 2007). For this reason, the analysis was continued by deleting the data of 40 multivariate outliers which were not at p <.001 from the Mahalanobis distance calculated.
The multicollinearity between the variables was checked in the next step to provide the assumptions of the CFA. First, the relationships between the variables were examined. In very high correlations such as .90 and above, statistical problems arise with singularity and multicollinearity (Tabachnick & Fidell, 2012). When the correlations between variables were examined, it was determined that the highest correlation was 0.538. For this reason, it was determined that there was no problem since the correlations were less than 0.90. However, since the correlation and collinearity are not the same, even if all correlations are low, multicollinearity may be in question (Alin, 2010). Singularity and multicollinearity can be determined through perfect or very high squared multiple correlations (SMC) or very low tolerances between variables (Tabachnick & Fidell, 2012). Therefore, Tolerance, VIF (Variance Inflation Factor) and, CI (Condition Index) need to be examined. If the tolerance is too low, the variable does not go into the analysis (Tabachnick & Fidell, 2012). Therefore, multicollinearity can be mentioned if the VIF is greater than 5 to 10 and the tolerance is less than 0.1 to 0.2 (Kim, 2019). Therefore, if there is a tolerance value close to zero and the VIF value exceeds 10, the highest degree of multicollinearity can be observed (Kumari, 2008). Adeboye et al. (2014) stated that starting from VIF values above 2.50, multicollinearity can be mentioned. The tolerance values calculated in the current study ranged between 0.441 and .867 and VIF is between 1.154 and 2.369. Therefore, there is no multicollinearity problem in terms of tolerance and VIF values. Besides, CI values were examined in the study. Condition index is a measure of the dependence of a variable on other variables (Tabachnick & Fidell, 2012). CI value greater than 30 indicates a very strong multiple linear connection problem (Gujarati, 1995; Kim, 2019; Kumari, 2008). In this study, it was determined that there were two CI values greater than 30 and the highest CI value was determined as 32.298. Adeboye et all. (2014) pointed out that if CN <100, multicollinearity is not a serious problem. Therefore, it was determined that there is no multicollinearity problem in terms of CI values. Finally, the Durbin-Watson (DW) value was examined. Durbin-Watson is a measure of the autocorrelation of errors and shows that errors are not independent (Tabachnick & Fidell, 2012). Positive autocorrelation causes Type I error because the error variance estimates are too small, and negative autocorrelation causes power loss (Tabachnick & Fidell, 2012). In this study, it was determined that there was no problem since the DW value was calculated as 1.169. Therefore, based on all this assumption analyzes, it has been determined that the data are suitable for CFA application. Furthermore, the Kaiser-Meyer-Olkin (KMO) test and Bartlett test were examined to determine the suitability of the data for factor analysis. According to the results, it was concluded that the sample size was sufficient, and the confirmatory factor analysis was started.
Then, confirmatory factor analysis (CFA) was applied to the data (Çokluk et al., 2010). Lisrel 8.80 program was used in the analysis process. To test the model examined in Turkish form, the fit index values were calculated (χ2 / sd, GFI, AGFI, RFI, NFI, NNFI, IFI, CFI, RMSEA, RMR and SRMR) and the model was tested in terms of the criteria for values (Schermelleh-Engel et al., 2003). Also, standardized loadings, t values and R2 values were calculated by drawing the Path diagram. In order to determine the reliability of the Turkish version of the scale, the Cronbach’s alpha internal consistency coefficient and Guttman split-half reliability were calculated.
According to the results of the confirmatory factor analysis conducted to determine the fit of the 4-factor model in the original form of the scale, the fit index values are as in Table 2.
Table 2. Fit indices of the Turkish version of the scale
Good Fit Values Acceptable Fit Values 4-dimensional model
x2/df 0 ≤ x2/df ≤ 2 2 ≤ x2/df ≤ 3
1.75
RMSEA 0 ≤ RMSEA ≤ .05 .05 ≤ RMSEA ≤ .08 0.038
RMR 0 ≤ RMR ≤ .05 .05 ≤ RMR ≤ .08 0.072
SRMR 0 ≤ SRMR ≤ .05 0.5 ≤ SRMR ≤ .10 0.049
NFI .95 ≤ NFI ≤ 1 .90 ≤ NFI ≤ .95 0.96
NNFI .97 ≤ NNFI ≤ 1 .95 ≤ NNFI ≤ .97 0.98
CFI .97 ≤ CFI ≤ 1 .95 ≤ CFI ≤ .97 0.98
GFI .95 ≤ GFI ≤ 1 .90 ≤ GFI ≤ .95 0.93
AGFI .95 ≤ AGFI ≤ 1 .90 ≤ AGFI ≤ .95 0.89
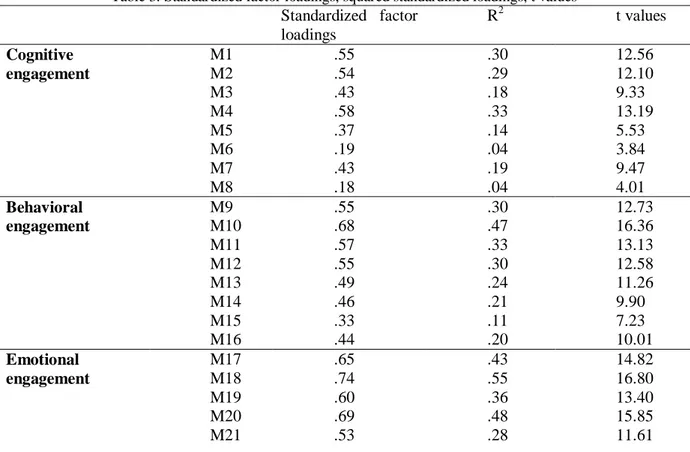
According to the confirmatory factor analysis results, the fit index values were as follows (χ2 / df = 1.75; RMSEA = 0.038; SRMR = 0.049; RMR = 0.072; CFI = 0.98; NFI = 0.96). It is seen that these values are within acceptable ranges (Schermelleh-Engel et al., 2003). The t values, standardized factor loadings and R2 values obtained from the path analysis are given in Table 3.
Table 3. Standardized factor loadings, squared standardized loadings, t values
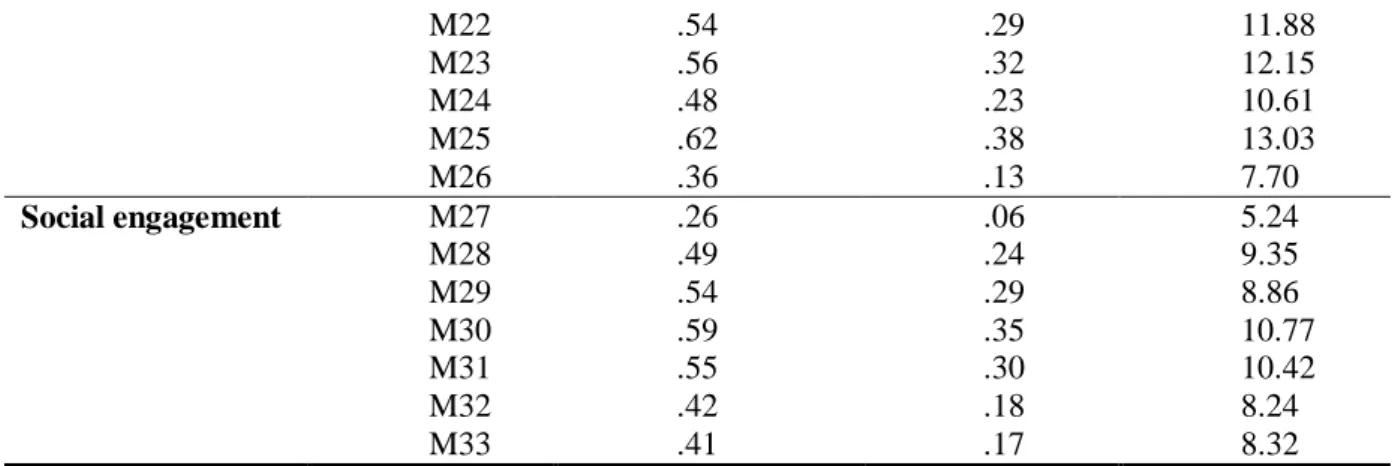
Standardized factor loadings R2 t values Cognitive engagement M1 .55 .30 12.56 M2 .54 .29 12.10 M3 .43 .18 9.33 M4 .58 .33 13.19 M5 .37 .14 5.53 M6 .19 .04 3.84 M7 .43 .19 9.47 M8 .18 .04 4.01 Behavioral engagement M9 .55 .30 12.73 M10 .68 .47 16.36 M11 .57 .33 13.13 M12 .55 .30 12.58 M13 .49 .24 11.26 M14 .46 .21 9.90 M15 .33 .11 7.23 M16 .44 .20 10.01 Emotional engagement M17 .65 .43 14.82 M18 .74 .55 16.80 M19 .60 .36 13.40 M20 .69 .48 15.85 M21 .53 .28 11.61
M22 .54 .29 11.88 M23 .56 .32 12.15 M24 .48 .23 10.61 M25 .62 .38 13.03 M26 .36 .13 7.70 Social engagement M27 .26 .06 5.24 M28 .49 .24 9.35 M29 .54 .29 8.86 M30 .59 .35 10.77 M31 .55 .30 10.42 M32 .42 .18 8.24 M33 .41 .17 8.32
When Table 3 is examined, it is seen that the standardized factor loadings of items 6, 8, 15, and 27 are low. It was decided that these items would remain in the test because they supported the theoretical model in the original scale and t values were significant. Besides, item-total correlations were calculated for each item in the final form of the scale and the significance of the difference between item scores of the upper 27% and lower 27% groups were determined by t-test. The values obtained are shown in Table 4.
Table 4. Item-total correlations and t-values for the difference between the upper 27% and lower 27% groups
Dimensions Items t values Item-total correlations
Dimensions Items t values Item-total correlations Cognitive engagement M1 5.82 .525** Emotional engagement M17 10.90 .621** M2 4.89 .515** M18 12.47 .677** M3 6.23 .430** M19 6.33 .569** M4 6.73 .540** M20 12.53 .633** M5 5.42 .423** M21 12.34 .531** M6 3.91 .110* M22 11.41 .531** M7 6.62 .442** M23 12.75 .570** M8 5.12 .153** M24 7.31 .466** Behavioral engagement M9 8.20 .524** M25 11.61 .585** M10 10.20 .616** M26 5.68 .387** M11 5.23 .533** Social engagement M28 3.69 .279** M12 5.45 .497** .507** M30 5.75 .425** M31 7.53 .446** M13 6.14 .481** M32 8.17 .509** M14 10.53 .380** M15 7.08 .459** M16 8.04 .525**
When Table 4 is examined, according to independent t-test results related to the significance of the difference between item scores of the upper 27% and lower 27% groups, t values vary between 3.69 and 12.75. Item-total correlations ranged from 0.110 to 0.676 and they were significant. The correlation values calculated between the factors of the scale are given in Table 5.
Table 5. Correlation values between factors of the scale
Reliability Sum Cognitive Beharovial Emotional Social Cognitive 0.636 .804** 1 .670** .551** .449**
Beharovial 0.720 .849** .670** 1 .636** .464**
Social 0.664 .719** .449** .467** .490** 1 Cronbach alpha: 0.90 Guttman split-half coefficient: 0.81
When the correlation values calculated between the factors are examined, it is seen that all values are significant. As a result of the reliability analysis, the internal consistency reliability coefficient of the Turkish form of the scale was 0.90, and the Guttman split-half reliability coefficient was 0.81. Furthermore, the dimensions of the scale were divided into positive and negative categories and tested with the hypothesized model with path analysis. The path diagram obtained as a result of testing the model with path analysis is as in Figure 1.
Figure 1. Path diagram of the model
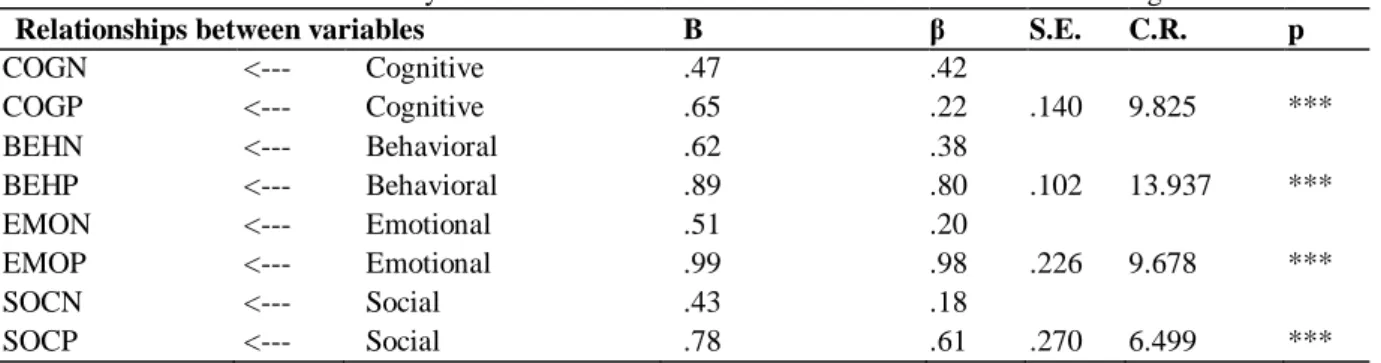
The values related to the standardized regression coefficients and the significance of the regression coefficients are given in Table 6.
Table 6. Reliability coefficients of the variables and standardized factor loadings
Relationships between variables B β S.E. C.R. p
COGN <--- Cognitive .47 .42 COGP <--- Cognitive .65 .22 .140 9.825 *** BEHN <--- Behavioral .62 .38 BEHP <--- Behavioral .89 .80 .102 13.937 *** EMON <--- Emotional .51 .20 EMOP <--- Emotional .99 .98 .226 9.678 *** SOCN <--- Social .43 .18 SOCP <--- Social .78 .61 .270 6.499 ***
The findings of the analysis showed that negative and positive engagement categories appeared to be positively associated with engagement in all factors. According to the results of the path analysis conducted to determine the fit of the hypothesized model in the original form of the scale, the fit index values are as in Table 7.
Good Fit Values Acceptable Fit Values Hypothesized model
x2/df 0 ≤ x2/df ≤ 2 2 ≤ x2/df ≤ 3 1.76
RMSEA 0 ≤ RMSEA ≤ .05 .05 ≤ RMSEA ≤ .08 0.038
RMR 0 ≤ RMR ≤ .05 .05 ≤ RMR ≤ .08 0.010
SRMR 0 ≤ SRMR ≤ .05 0.5 ≤ SRMR ≤ .10 0.049
NFI .95 ≤ NFI ≤ 1 .90 ≤ NFI ≤ .95 0.99
RFI .97 ≤ NNFI ≤ 1 .95 ≤ NNFI ≤ .97 0.97
CFI .97 ≤ CFI ≤ 1 .95 ≤ CFI ≤ .97 0.99
GFI .95 ≤ GFI ≤ 1 .90 ≤ GFI ≤ .95 0.99
AGFI .95 ≤ GFI ≤ 1 .90 ≤ GFI ≤ .95 0.97
When Table 7 is examined, the model is accepted as the fit indices of the model are within the range of "good fit values" (Schermelleh-Engel et al., 2003).
Discussion, Conclusions and Recommendations
Student engagement is important for the effective implementation of the STEM integration which is very popular today in science education. Therefore, the determination of student engagement is considered important. In this study, The Math and Science Engagement Scale developed by Wang et al. (2006) was adapted to Turkish in the context of science course, and validity and reliability studies were conducted for secondary school students. The original 4-dimensional structure of the scale was tested by confirmatory factor analysis. The goodness of fit index values obtained as a result of CFA (χ2 / df = 1.75; RMSEA = 0.038; SRMR = 0.049; RMR = 0.072; CFI = 0.98; NFI = 0.96) indicate that the 4-factor structure of the scale is acceptable (Hu & Bentler, 1999; Kline Schermelleh-Engel et al., 2003; Tabachnick & Fidell, 2012). But standardized factor loadings of items 6,8, 15 and 27 are low (Çokluk et al., 2010; Suhr, 2006)). It was decided that these items would remain in the test because they supported the theoretical model in the original scale and t values were significant. Kline (2010) stated that t values greater than 1.96 were significant at p = 0.05 level. He also stated that low correlation amounts should increase the likelihood of a meaningful increase as the sample increases (Kline, 2010). Therefore, it was decided not to discard these items.
According to the CFA results applied to the 4-factor structure of the model, χ2 / df = 1.75 was calculated. The Chi-square test shows the amount of difference between expected and observed covariance matrices (Suhr, 2006). The smaller the chi-square value, the better the model (Hinkin, 1995) and that there is little difference between the covariance matrices expected and observed to approach zero. Therefore, this ratio is an indicator that the model may be suitable for the data (Tabachnick & Fidell, 2012). In this study, χ2 / df value less than 2 is an indicator of the perfect fit of the model to the data (Çokluk et al., 2010; Schermelleh-Engel et al., 2003).
As a result of the analysis, the RMSEA value of the model was calculated as 0.038. Suhr (2006) stated that the RMSEA value between 0 and 1 showed better model fit; Arbuckle (2005) suggested that the RMSEA value of 0.05 or less fits well into the model concerning degrees of freedom. Therefore, it can be said that the RMSEA value obtained in this study shows good agreement (Arbuckle, 2005; Çokluk et al., 2010; Hu and Bentler, 1999; Schermelleh-Engel et al., 2003; Suhr, 2006; Tabachnick & Fidell, 2012). When the other values were examined, it was determined that the fit indices were RMR = 0.072, SRMR = 0.049 NFI = 0.96 NNFI = 0.98 CFI= 0.98 GFI= 0.93. According to these values, it is determined that the 4-dimensional structure of the model fits well (Çokluk et al., 2010; Hooper et al., 2008; Hu & Bentler, 1999; Kline, 2010; Schermelleh-Engel et al., 2003; Suhr, 2006; Tabachnick & Fidell, 2012). Hu and Bentler (1999), close to 0.95 CFI and SRMR value close to 0.08 showed a good agreement between the observed data and hypothesized model and reduced Type II error rate, he said. Kline (2010) stated that the combination thresholds to achieve “acceptable fit” are CFI ≥ .95 and SRMR ≤ .08. Therefore, the CFI and RMSEA values obtained in this study show a good fit. However, it is seen that the calculated GFI value is not among the acceptable values (Schermelleh-Engel et al.). Kline (2010) states that one limitation of the GFI value is that it varies with the sample size. Therefore, in the present study, the GFI value was within the acceptable range affected by the sample size (Hooper et al., 2008; Kline, 2010),
and the sample size (n = 519) was more than 300 participants recommended as the ideal sample size for DFA (Hair et al., 2006).
Also, item-total correlations were calculated for each item and the significance of the difference between item scores of the upper 27% and lower 27% groups were determined by t-test. As a result of the reliability analysis, the internal consistency reliability coefficient of the Turkish form of the scale was 0.90, while the Guttman split-half reliability coefficient was 0.81. Besides, as a result of the path analysis established with the paths drawn between the dimensions, it was found that the positive and negative sub-dimensions in the scale predicted the factors positively. When the fit index values of this model were examined, it was determined that the bifactor model showed a good fit. As a result, it can be said that the validity and reliability of the 33-item and 4-dimensional Turkish form of the scale adapted with this study can be used to determine students' science engagement. Thus, a multidimensional perspective on student participation and the results to be achieved in the studies to be conducted will provide richer information about how students behave, feel, think and socialize in science classes rather than considering each dimension separately (Wang et al., 2011). Therefore, it will be possible to measure multidimensional student engagement in science courses with the scale adopted in this study. Also, it may be suggested that the role of students' engagement in their STEM achievements can be determined by using the adapted scale in this study.
.
References
Adeboye, N. O., Fagoyinbo, I. S., & Olatayo, T. O. (2014). Estimation of the effect of multicollinearity on the standard error for regression coefficients. Journal of Mathematics, 10(4), 16-20. https://doi.org/10.9790/5728-10411620
Alin, A. (2010). Multicollinearity. Wiley Interdisciplinary Reviews. Computational Statistics, 2(3), 370-374. https://doi.org/10.1002/wics.84
Arbuckle, J. L. (2005). AmosTM 6.0 user’s guide. Amos Development Corporation.
Aydın, G., Saka, M., & Guzey, S. (2017). Science, technology, engineering, mathematic (STEM) attitude levels in grades 4th- 8th. Mersin University Journal of the Faculty of Education, 13(2), 787 – 802. https://doi.org/10.17860/mersinefd.290319
Baron, P., & Corbin, L. (2012). Student engagement: Rhetoric and reality. Higher Education Research & Development, 31(6), 759–772. https://doi.org/10.1080/07294360.2012.655711
Ceylan, Ö., Ermis, G. & Yıldız, G. (2018, November 2- November 4). Attitudes of special talented students towards science, technology, engineering, mathematics (STEM) education [Paper Presentation]. International Conference on Gifted and Talented Education, Malatya, Turkey.
Czerniak, C. M., & Johnson, C. C. (2007). Interdisciplinary science teaching. In Norman G. Lederman, & Sandra K. Abell (Ed.), Handbook of research on science education (2nd ed., p.537-559). Routledge. Çokluk, Ö., Şekercioğlu, G., & Büyüköztürk, S. (2012). Sosyal bilimler için çok değişkenli istatistik: SPSS ve
LISREL uygulamaları [Multivariate statistics for social sciences: SPSS and LISREL applications] (Vol. 2). Pegem.
Damar, A., Durmaz, C., & Önder, İ. (2017). Middle school students’ attitudes towards STEM applications and their opinions about these applications. Journal of Multidisciplinary Studies in Education, 1(1), 47-65. https://dergipark.org.tr/tr/pub/jmse/issue/35452/415256
Eryılmaz, A. (2014). Üniversite öğrencileri için derse katılım ölçeklerinin geliştirilmesi (The Development of the Scales of Classroom Engagement for University Students). Usak Üniversitesi Sosyal Bilimler Dergisi, 7(2), 203-214. https://dergipark.org.tr/en/pub/usaksosbil/issue/21638/232562
Fraenkel, J. R., Wallen, N. E., & Hyun, H. H. (2012). How to Design and Evaluate Research in Education. McGraw Hall.
Fredricks, J. A., Blumenfeld, P. C., & Paris, A. H. (2004). School engagement: Potential of the concept, state of
the evidence. Review of Educational Research, 74, 59-109.
https://doi.org/10.3102/00346543074001059
Gujarati, D. N. (1995). Basic Econometrics (3rd ed.), McGraw-Hill.
Hair, J. F., Black, W. C., Babin, B. J., Anderson, R. E., & Tatham, R. L. (2006). Multivariate data analysis (6th ed.). Pearson University Press.
Hinkin, T. R. (1995). A review of scale development practices in the study of organizations. Journal of Management, 21(5), 967-988. https://doi.org/10.1016/0149-2063(95)90050-0
Hooper, D., Coughlan, J., & Mullen, M. R. (2008). Structural equation modelling: Guidelines for determining model fit. Electronic Journal of Business Research Methods, 6(1), 53-60. https://doi.org/10.21427/D7CF7R
Hu, L. T., & Bentler, P. M. (1999). Cutoff criteria for fit indexes in covariance structure analysis: Conventional criteria versus new alternatives. Structural Equation Modeling: A Multidisciplinary Journal, 6(1), 1-55. https://doi.org/10.1080/10705519909540118
Hughes, J. N., Luo, W., Kwok, O., & Loyd, L. K. (2008). Teacher-student support, effortful engagement, and achievement: a three-year longitudinal study. Journal of Educational Psychology, 1, 1-14. https://doi.org/10.1037/0022-0663.100.1.1
Kahraman, N. (2014). Cross-grade comparison of relationship between students’ engagement and TIMSS 2011 science achievement. Education and Science (Large-ScaleAssessment Special Issue), 39 (172), 95-107. Kezar, A., & Elrod, S. (2012). Facilitating interdisciplinary learning: lessons from project kaleidoscope.
Change: The Magazine of Higher Learning, 44(1), 16-25.
https://doi.org/10.1080/00091383.2012.635999
Kim, J. H. (2019). Multicollinearity and misleading statistical results. Korean Journal of Anesthesiology, 72(6), 558. https://doi.org/10.4097/kja.19087
Kline, R. B. (2010). Principles and practice of structural equation modeling (3rd ed.). Guilford Press.
Lesseig, K., Slavit, D., & Nelson, T. H. (2017). Jumping on the STEM bandwagon: How middle grades students and teachers can benefit from STEM experiences. Middle School Journal, 48(3), 15-24. https://doi.org/10.1080/00940771.2017.1297663
Ministry of National Education [MoNE]. (2018). Millî Eğitim Bakanlığı Talim ve Terbiye Kurulu Başkanlığı Fen Bilimleri Dersi Öğretim Programı [Ministry of National Education Board of Education and Training Science Course Curriculum], Ankara.
Miles, M. B. & Huberman, A.M. (1994). Qualitative data analysis: an expanded sourcebook (2nd ed.). SAGE Publications.
Özdemir, A., Yaman, C., & Vural, R. A. (2018). Development of the teacher self-efficacy scale for STEM practices: A validity and reliability study. Adnan Menderes University Journal of Social Sciences Institute, 5(2), 93-104. https://doi.org/10.30803/adusobed.427718
Reeve, J., & Tseng, C. M. (2011). Agency as a fourth aspect of students’ engagement during learning
activities.Contemporary Educational Psychology, 36, 257–
267. https://doi.org/10.1016/j.cedpsych.2011.05.002
Shaughnessy, J. M. (2013). Mathematics in a STEM context. Mathematics Teaching in the Middle school, 18(6), 324-324. https://doi.org/10.5951/mathteacmiddscho.18.6.0324
Schermelleh-Engel, K., Moosbrugger, H., & Müller, H. (2003). Evaluating the fit of structural equation models: Tests of significance and descriptive goodness-of-fit measures. Methods of Psychological Research Online, 8(2), 23-74.
Suhr, D. (2006). Exploratory or confirmatory factor analysis. SAS Users Group International Conference (p 1-17). Cary: SAS Institute, Inc.
Tabachnick, B. G., & Fidell, L. S. (2012). Using multivariate statistics. Pearson.
Turner, J. C., Christensen, A., Kackar-Cam, H. Z., Fulmer, S. M., & Trucano, M. (2018). The development of professional learning communities and their teacher leaders: An activity systems analysis. Journal of the Learning Sciences, 27(1), 49-88. https://doi.org/10.1080/10508406.2017.1381962
Wang, M. T., & Degol, J. (2014). Staying engaged: Knowledge and research needs in student engagement. Child development perspectives, 8(3), 137-143. https://doi.org/10.1111/cdep.12073 Wang, M. T., Fredricks, J. A., Ye, F., Hofkens, T. L., & Linn, J. S. (2016). The math and science engagement
scales: Scale development, validation, and psychometric properties. Learning and Instruction, 43, 16-26. https://doi.org/10.1016/j.learninstruc.2016.01.008
Wang, M. T., Willett, J. B., & Eccles, J. S. (2011). The assessment of school engagement: Examining dimensionality and measurement invariance across gender and race/ ethnicity. Journal of School Psychology, 49, 465-480. https://doi.org/10.1016/j.jsp.2011.04.001
Willms, J. D., Friesen, S., & Milton, P. (2009). What did you do in school today? Transforming classrooms through social, academic and intellectual engagement. (First National Report). Canadian Education Association.
Yerdelen-Damar, S., Korur, F., & Sağlam, H. The Adaptation of the Math and Science Engagement Scale into Turkish in the Context of Physics Course Turkish Journal of Educational Studies, 7(2), 1-15. https://doi.org/10.33907/turkjes.661339
Yıldırım, İ., Başaran, M., Cücük, E., Yokuş, E. (2018). Development of inquiry-based teaching self-efficacy scale for STEM+S education: Validity and reliability study. International Online Journal of Educational Sciences, 10(3), 40-55. https://doi.org/10.15345/iojes.2018.03.003
Yıldırım, G., Sökmen, Y., Yasemin, T. A. Ş., & Dilekmen, M. (2017). The adaptation of student engagement scale to Turkish: The validity and reliability study. Trakya University Journal of Education Faculty, 8(1), 68-79. https://doi.org/10.24315/trkefd.364039
You, H. S. (2017). Why Teach Science with an Interdisciplinary Approach: History, Trends, and Conceptual Frameworks. Journal of Education and Learning, 6(4), 66-77. https://doi.org/10.5539/jel.v6n4p66
Attachment. Science Engagement Scale Bilişsel Katılım
1.
Fen dersi için çalışırım ve bunun doğru olduğundan eminim.2.
Bir problemi çözmek için farklı çözüm yolları düşünürüm.3.
Yeni öğrendiğim şeylerle daha önce öğrendiklerimi ilişkilendirmeye çalışırım.4.
Bir şeyi yanlış yaptığımda hatalarımı anlamaya çalışırım.5.
Bir problemi çözmek yerine direkt cevabın söylenmesini tercih ederim.6.
Ders çalışmanın zor olduğunu düşünmem.7.
Çalışacağım konu zor olduğunda konunun sadece kolay kısımlarına çalışırım.8.
Dersi geçecek kadar çalışırım.Davranışsal Katılım
9.
Fen dersine konsantre olurum.10. Fen dersini öğrenmek için çaba harcarım.
11. Bir şey zor olsa bile denemeye devam ederim.
12. Ödevlerimi zamanında tamamlarım.
13. Sınıf dışında da fen dersi hakkında konuşurum.
14. Fen dersine katılmam.
15. Dikkatimi toplamam gerektiğinde başka şeyler yaparım.
16. Anlamazsam hemen pes ederim.
Duyuşsal Katılım
17. Fen dersini dört gözle beklerim.
18. Fen hakkında yeni şeyler öğrenmekten zevk alırım.
19. Fen dersinde neyin öğretildiğini anlamak isterim.
20. Fen dersindeyken kendimi iyi hissederim.
21. Fen dersinde kendimi sık sık usanmış hissederim.
22. Fen dersinin sıkıcı olduğunu düşünürüm.
23. Fen dersinde olmak istemem.
24. Fen öğrenmeyi umursamam.
25. Fen dersindeyken kendimi sık sık keyifsiz hissederim.
26. Fen ile ilgili yeni şeyler öğrendiğimde endişelenirim.
Sosyal Katılım