TUESDAY AFTERNOON
/
lQEC'98
/
81
Y 1200$
800- C 400- -E
.f
500 11.63 11.68 11.731
Z
h
7 0 11 12 13 14 15 16Frequency (GHz)
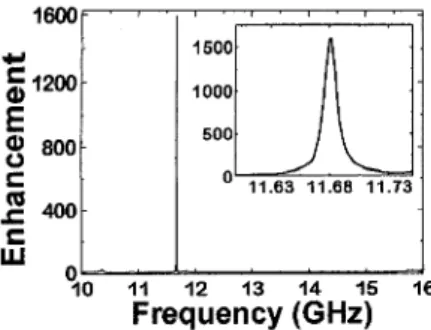
QTuJ2 Fig. 2. The measured power ofthe EMfield inside a one-dimensional defect structure.
QTuJ2 Fig. 3. The measured power of the EM field inside a localized defect structure.
crystal structure in the following manner. Part of the rods on the 8th and 9th layers were removed to obtain a rectangular prism like cavity. Figure 3 shows the power en- hancement characteristics of this structure. An enhancement factor of 290, and a Q-
factor of 540 were measured at a defect fre- quency of 12.32 GHz.
Our results suggest the possibility of us-
ing the embedded detector as an RCE detec- tor. By using a smaller size photonic crystal and a higher-frequency detector, the effect can also be shown at millimeter and far- infrared frequencies. Such RCE detectors will have increased sensitivity and efficiency when compared to conventional detectors, and can be used for various applications where sensitivity and efficiency are impor- tant parameters.
*Ames Laboratory and Microelectronics Re- search Center, Iowa State University, Ames, Iowa 5001 I
1. E. Yablonovitch et al., Phys. Rev. Lett. 63, 1950 (1989).
2. K.M. Ho etal., Solid State Comm. 89,413 (1994).
3. E. Ozbay et al., Phys. Rev. B 51, 13961 (1995).
4. E. Ozbay et al., Appl. Phys. Lett. 76, (1996).
5. M.S. Unluetal., J. Appl. Phys. 78, Rl-R33 (1995).
QTuJ3 3:OO pm
Modifications to blackbody radiation in a one-dimensional photonic bandgap structure
Jonathan P. Dowling, Mark J. Bloemer, Michael D. Tocci, Michael Scalora, Charles M. Bowden, U S . Army Aviation Q
Missile Command,
AMSAM-RD-
WS-ST,Redstone Arsenal, Alabama 35898-5000; E-mail: [email protected]. mil
The Planck blackbody law is usually derived in a large cavity limit in which the density of electromagnetic modes is treated in the free- space continuum limit. However, in a one- dimensional (1D) photonic bandgap (PBG) material, the normal mode structure is mani- festly different from in free space,1-4 and hence the form of the blackbody spectrum can be radically altered. We calculate the modified blackbody frequency and wave-number spec- trum in the simple example of 1D thin-film GaAdAlGaAs PBG structure. Specifically, we compute the cavity-modified blackbody distri- bution as a function of frequency and wave- vector and compare it to the experiment. (See Figs. 1 and 2.) As can be seen in the figures, the total power and the Lambertian angular distri- bution can be drastically modified depending on the location of the bulk blackbody spectral peak with respect to the photonic bandgap. In Sample A, Fig. 1, the spectral peak is aligned with the photonic band edge, leading to mis- sion enhancement. In Sample B, Fig. 2, the blackbody peak is centered at the bandgap leading to suppression of emission. In both cases the angular distribution differs from the Lambertian expected for a bulk thermal emit- ter.
1. J.M. Bendickson, J.P. Dowling, M. Scalora, Phys. Rev. 53,4107 (1996).
MeannedRadiatimPattem Sample A
Cosine Calculated
0 Measured
QTuJ3 Fig. 1. In Sample A, the spectral peak is aligned with the photonic band edge, leading to emission enhancement of the blackbody radia- tion and modification of the circular Lambertian emission profile.
QTuJ3 Fig. 2. In Sample B, the spectral peak is aligned with the photonic bandgap, leading to emission suppression of the blackbody radiation and modification of the circular Lambertian emission profile.
2. J.P. Dowling and C.M. Bowden, Phys. Rev. A 46,612 (1992).
3. M. Scalora, J.P. Dowling, M.D. Tocci, MJ. Bloemer, C. Bowden, J.W. Haus, Appl. Opt. 60, S57 (1995).
M.D. Tocci, M. Scalora, M.J. Bloemer, J.P. Dowling, C.M. Bowden, Phys. Rev. A 53, 2799 (1996).
4.
QTuJ4
3:15
pmReflection properties and defect formation in metallic photonic crystals
E. Ozbay, B. Temelkuran, M. %galas,* G. Tuttle,* C.M. Soukoulis,* K.M. Ho,*
Department of Physics, Bilkent University, Bilkent Ankara 06533 Turkey
Propagation of electromagnetic (EM) waves in periodic dielectric structures can be completely forbidden for a certain range of frequencies.' These three-dimensional arrays-photonic bandgap (PBG) crystals-can be used to engi- neer the properties of the radiation field within these structures. Although, the earlier work on photonic crystals concentrated on building structures using dielectric materials, there are certain advantages of introducing metals to pho- tonic crystals.* First, the metals offer a higher rejection rate per layer when compared to dielec- tric crystals3 Second, for microwave applications the dimensions of metallic crystals can be kept much smaller than the minimum dimensions needed for a typical dielectric cry~tal.~ In this paper, we investigate the reflection properties of layer-by-layer metallic photonic crystals, and use these properties to predict defect formation in layer-by-layer metallic photonic crystals.
In our investigations of reflection proper- ties, we used metallic photonic crystals with the simple-tetragonal (st) structure. The re- flection and transmission amplitude charac- teristics were measured by a network analyzer and standard gain horn antennas (Fig. 1). The properties of a 6-layer thick crystal along the stacking direction is shown in Fig. 2(a). Al- though the reflection-magnitude properties of the crystal were independent of the polariza- tion vector e of the incident EM wave, we found a strong polarization dependence for the phase of the reflected waves. Figure 2(b)
shows the phase of the reflected waves as a function of frequency for both polarizations. Figure 2(b) also shows the calculated
I I I I I
Transmitter li
Gap Crystal
Antenna
QTuJ4 Fig. 1. Experimental setup for mea- suring the reflection and transmission properties of the photonic crystals.
82
/
IQEC'98
/
TUESDAYAFTERNOON
0 -10--
- - Reflection (dB) -40 10 15 20 25Frequency
(GHz)E
g
5 -0 -1 e parallel g.100 -__.____..._.... -...-..- b - to rods 15?4 15 16 17 18 19 20Frequency
(GHz) QTuJ4 Fig. 2. (a) Reflection (thick solid line) and transmission (thin solid line) characteristics of the photonic crystal. (b) Comparison of the theoretical (dashed) and experimental (solid) reflection-phase properties of the photonic cry- tal for different polarizations.reflection-phase properties for the same struc- ture, which was in good agreement with the experiment. We have used transfer matrix method (TMM) in our theoretical simula- tions.5
This phase information can also be inter- preted as an effective distance (penetration depth) between the top surface and an ideal reflection plane inside the crystal.
' l o
account for the phase delay due to the reflection-phase, the EM waves can he considered to pmpagate a certain distance in the crystal and then reflect back from an ideal metallic plane with a phase shiftof
180".The penetration depth information ob- tained from the reflection-phase measure- ments can be used to understand defect forma- tion in Fabry-Perot type defect structures. A planar defect structure made of two photonic mirrors separated by a distance will have an effective cavity length. The length is equal to the sum of the penetration depths and the separation distance. This analogy then can be used to obtain penetration depths from the experimental defect frequencies. The values
? I
I
IQ 12 14 16 18 20
Frequency (GHz)
QTuJ4 Fig. 3. Comparison of the experimen- tal (circles) and predicted effective reflection plane distances (solid line) of the Fabry-Peiot cavity.
obtained from the defect frequency measure- ments (of cavities with different separation lengths) and the reflection phase measure- ments are compared in Fig. 3. As can be seen from the plot, there is a good agreement be- tween the predicted and experimental penetra- tion depths. The photonic mirrors have a typi- cal penetration depth around 5 mm within the band gap frequencies. This information can be readily used to design a defect structure at a specified frequency.
*Ames Laboratory and Microelectronics Re- search Center, Iowa State University, Ames, Iowa 5001 1
1. K.M. Ho et al., Phys. Rev. Lett. 65, 3152 (1990).
2. D.F. Sievenpiper et al., Phys. Rev. Lett. 76, 2480 (1996).
3. E. Ozbay et al., Appl. Phys. Lett. 69,3797 (1996).
4. J.S. McCalmont etal., Appl. Phys. Lett. 68, 2759 (1996).
5. M. Sigalas et al., Phys. Rev. B 52, 11744 (1995).
QTuJ5 (Invited) 3:30 pm
Experlmental observation of interaction between Bragg solitons
B.J. Eggleton, R.E. Slusher, N.M. Litchinitser,* G.P. Agrawal,* A. Aceves,** C.M. de Sterke,? Bell Laboratories, Lucent Technologies, Murray
Hill,
New
Jersey 07974Possibly the most appealing property of optical solitons is their partidehke behavior. Solitons tend to survive perturbations and collisions and interact nondestructively with each other. Indeed for optical solitons which obey the in- tegrable nonlinear Schrodinger equation the interaction can be either attractive or repul- sive, depending on the relative phase of the two solitons.' In both cases the dynamics is well understood; either a periodic evolution (in the attractive case) or for the repulsive case a two soliton solution which is well approximated by the sum oftwo separated one soliton solutions. Bragg solitons,2 on the other hand, are de-
scribed by nonintegrable eq~ations.~-4 This means that, while they are also robust, in that they posses a particlelike behavior, they show the distinct signature of nonintegrability in
that collisions are typically inelastic.4 In this paper we report on experimental studies of interactions of Bragg solitons in optical fibers. We investigated Bragg soliton interactions experimentally using the experimental setup shown in Fig. 1. We used a mode-locked Q-switched YLF laser, which generated 80-ps pulses at a repetition are of 500 Hz, having peak powers in excess of 10 kW. The pulses were first passed through a Mach-Zehnder in- terferometer to turn them into a pair of co- polarized pulses. A precision translation stage (resolution 0.1 pm) in one arm of the inter- ferometer allowed adjustment of the length of the arm allowing the pulse separation and rela- tive phase to be varied. The detuning of the pulses from the Bragg resonance was chosen such that the length of the grating (6 cm), corresponded to five soliton periods, allowing ample opportunity for soliton interaction. At low powers the pulses were dispersed and no interaction was observed. The input power was then increased to 10 GW/cm2, where the width of each pulse by itself rcached a minimum value of 30 ps (deconvolved) at the output. Figure 2 shows a sample of our experimental results. In Fig. 2(a) the output is shown if the
two
armsof
the interferometer are separately blocked in succession; it shows that initial separation between the pulses is approxi- mately 50 ps. When the output from both armsis coupled into the fiber grating, the solitons interact. The separation
of
the output solitons is observed to depend on the relative phase between the two input pulses. Figure 2(b) shows the output intensity when the initial pulses are in phase, indicating the collapse ofthe two Bragg solitons. Figure 2(c), on the other hand, shows the output intensity when the initial pulses are out of phase, indicating a repulsive force. The dependence of the output pulse separation on the initial relative phase difference is indicative of the particlelike be-
havior of Bragg solitons.
Numerical simulations of the nonlinear coupled mode equations reveal that in spite of