1. INTRODUCTION
Earthquake ground motions impart a significant amount of energy into the structural systems. Conventional seismic design practice permits designing structures for the forces lower than those expected from the elastic response, on the principle that the structural design guarantees significant structural ductility (Hanson et al. 1993). Commonly the dissipative zones are located near the beam-column joints and due to cyclic inelastic incursions during earthquakes; structural elements can suffer a great amount of damage (Barbat and Bozzo 1997). The modern structural design seeks to absorb some part of the energy resulting from the ground motion through
Lead Extrusion Damper
C. Soydan
1,*, E. Yuksel
2and E. Irtem
31Ph.D. Candidate, ITU Institute of Science and Technology, Istanbul, Turkey 2Faculty of Civil Engineering, Istanbul Technical University, Istanbul, Turkey
3Department of Civil Engineering, Balıkesir University, Balıkesir, Turkey
(Received: 10 July 2012; Received revised form: 7 May 2013; Accepted: 31 October 2013)
Abstract: The seismic behavior of the steel connection equipped with the lead extrusion damper (LED) is examined through the experimental and analytical studies. The LED implemented has spherical type bulge and does not consist any lubricant layer. The experimental study is performed in Structural and Earthquake Engineering Laboratory of Istanbul Technical University (STEELAB). In the experimental part, force-displacement relations of the connections with and without LED are achieved for the reversal displacement cycles. The measures of the dissipated energy, the equivalent damping ratio and the effective stiffness are obtained from the experimental study and compared for the connections. The total energy dissipated by the connection with the LED is approximately 175% greater than the total energy dissipated by the bare connection. In the analytical part of the study, nonlinear dynamic time history analyses are performed for the selected earthquakes and mass condition using the analytical models for the connections with and without LED. The maximum top displacement decreases approximately 50% for the connection equipped with the LED respect to the bare connection for the considered earthquakes. The maximum value of restoring force for the connection equipped with LED is approximately 25% greater than the bare connection for the accomplished analyses. Finally, the LED responses obtained in the nonlinear time history analyses are compared with the isolated LED test results.
Key words: energy dissipation systems, passive control systems, lead extrusion damper, steel connection.
the energy dissipaters that are located to special positions in the structure and to decrease the relative story drifts. Various types of seismic energy dissipater systems adopting from the different energy dissipating mechanisms has been developed in both the academic and the industrial areas.
A rigorous research activity on the development and application of LED is ongoing in STEELAB. In the first phase, the newly developed LEDs have been tested exclusively subjecting to various harmonic loading functions. In the second phase which is the subject of this paper, some steel connections with and without LED have been tested by using the cyclic displacement protocol defined in ATC-1992.
forcing a material through a hole or an orifice, thereby altering its shape (Sadek et al. 1996). The pressure applied to the ram forces the lead to flow through the orifice, producing a microstructure of elongated grains containing many crystal lattice defects. A proportion of the energy required to extrude the lead appears immediately as heat, but some is stored in the deformed lead and is the primary driving force for three interrelated processes namely recovery, recrystallization and grain growth, which tend to restore the lead to its original condition (Wulf et al. 1953; Birchenall 1959) (Figure 1).
The LED consists of a thick-walled tube and end-caps that contain a volume of lead. The LED has a constriction created by a bulge on the central shaft. Relative motion between the shaft and outer cylinder/end-caps extrudes the lead through the constriction. The space between the pistons is filled with lead, which is separated from the cylinder wall by a thin layer of lubricant kept in place by hydraulic seals around the pistons. The piston is active part of a connecting rod which extends beyond one end of cylinder and is fixed to the structure, while the opposite end of the cylinder is fixed to another part of the structure. When the two parts of the structure oscillate relative to each other the lead is extruded back and forth through the orifice. Since extrusion is a process of plastic deformation, work must be done as the pistons move relative to the cylinder. Thus in an earthquake protection application, such a device would limit the destructive oscillations in the structure (Robinson and Greenbank 1975).
According to Skinner et al. (1993), LEDs were first suggested by Robinson as a passive energy dissipation device for base isolated structures in New Zealand. Two devices introduced by Robinson are shown in Figures 1 and 2 (Robinson and Greenbank 1975, 1976). The first device consists of a thick-walled tube and The plastic (wen) type uniaxial element which is
accessible in SAP2000 is used for the representation of the LED in analytical models. This link type element is preferred for the adaptation of experimentally obtained axial force-displacement relation of the LED directly to the model. The parameters of plastic (wen) type link element namely yield force, stiffness and post yield stiffness can be attained from the axial force-displacement relations of the LED.
The objective of the paper is to verify the effectiveness of the LED to improve the in-plane behavior of the connections. In the scope of the study, the following two groups of works are accomplished: i. The experimental works conducted on the connections with and without LED, ii. The analytical works which consist of nonlinear static and nonlinear dynamic time history analyses of the connections with and without LED.
2. PASSIVE ENERGY DISSIPATION SYSTEMS AND LED
Passive energy dissipation devices absorb and dissipate a substantial portion of the energy imparted to a structure by earthquake shaking. Energy dissipation devices are typically distributed throughout a structure to absorb either kinetic or strain energy transmitted from the ground into the primary system (Aiken 1996). Damping in structures can significantly reduce the displacement and acceleration responses, and decrease the shear forces along the height of structures. Damage to the structure can be limited to the supplemental dampers which are easier to replace than structural components (Sadek et al. 1996).
Research and developments experienced in last decades have advanced both the concepts and the hardware of supplemental damping to the point where a number of different passive dissipation solutions with varying hysteretic characteristics are available. The suitability of a particular device for a given application depends on the requirements of the designer. Factors such as the allowed force to be transferred to the structural members adjacent to the device, the expected relative displacements across the device connection points, and the required amount of energy to be dissipated must be all considered (Aiken 1996).
Friction dampers, metallic dampers, viscoelastic dampers and viscous dampers are kinds of passive dissipation devices. LED is a metallic damper type passive energy dissipater which takes the advantage of the hysteretic behavior of lead when deformed into its post-elastic range. The process of extrusion consists of
OrificeLead Seals
Original grains Grain growth
Recrystallization Elongated grains
Figure 1. Longitudinal section of a constricted tube LED showing the changes in microstructure of the lead (Robinson and Greenbank 1975)
co-axial shaft with a piston [Figure 2(a)]. The second device is similar to the first device except that the extrusion orifice is formed by a bulge on the central shaft rather than by a constriction in the tube. The shaft is supported by bearings which also serve to hold the lead in place. As the shaft moves, the lead must extrude through the orifice formed by the bulge and tube [Figure 2(a)]. The hysteretic behavior of LED is essentially rectangular [Figure 2(b)] (Sadek et al. 1996).
The lead is separated from the tube by a thin layer of lubricant kept in place by hydraulic seals around the pistols. The central shaft is located by bearings which also serve to hold the lead in place (Robinson and Greenbank 1976). Cousins and Porritt (1993) stated that to have consistent and predictable performance the sliding lead-steel interfaces had to be well lubricated, and if the integrity of the lubricant film was to be maintained at the high pressures required for extrusion for many cycles of operation, then the finish on the steel surfaces had to be of high quality.
Although the device lubrication was identified as a key factor in the previous publications, it was not found to be essential by Rodgers et al. (2006a, b) and Rodgers (2009). In these studies, streamlined bulged shaft LED configurations were used and the lead was pre-stressed to minimize the void formation. The effect
of pre-stressing on the behavior of LED was investigated.
Steel beam-to-column moment resisting connections using high-force-to-volume (HF2V) dissipaters were investigated by Mander et al. (2009). It was presented the results of an experimental study on seismic performance of damage avoidance design (DAD) structural steel beam-to-column connections. The moment resisting beam-to-column connection was formed using a bolted top angle and a HF2V device. A gap was left between the column face and the bottom beam flange where HF2V device(s) was installed. Two alternative applications were achieved. The first application adopted a HF2V device mounted beneath the bottom flange and the second one adopted two HF2V devices mounted above the bottom flange. It was concluded that the conventional welded steel moment resisting connections and hinge zones could be avoided from damage by reconfiguring the beam-to-column connection to include HF2V devices. There was no damage observed to beam and column elements and repeatable energy dissipation on each cycle was observed with no strength deterioration, regardless of the magnitude of prior cycle. A greater energy efficiency of 86% was achieved without damage when it was compared to conventional steel design.
A rate-dependent modeling technique was developed for moment resisting steel connections that utilize non-linear viscous dampers by Rodgers et al. (2011). Primarily, a Maxwell type model was developed that considers the non-linear viscous damper and connection flexibility for translational motion. The generated model was compared with experimental results at several input motion frequencies. The model was then extended to represent an exterior steel beam-to-column connection using DAD and non-linear viscous dampers.
The LEDs which are designed and produced in STEELAB have no lubricant layer or film built up between lead and steel interfaces and accordingly there is no necessity to use hydraulic seals. The cap of the LED is designed to have two altered thicknesses. The pre-stressing on lead is realized with the assembly of the cap.
3. EXPERIMENTAL STUDY
An experimental setup is designed and used to determine the LED effect on the behavior of a steel connection. The adapter plates are placed to install the damper into the connection. The in-plane seismic behavior of the connections with and without LED is determined through the applied experimental program. Bearings Seals 150 100 150 100 50 50 0 0 −50 −50 −100 −100 −150 −150 Displacement (mm) Load (kn) Lead Orifice (a) (b)
Figure 2: LED: (a) longitudinal section of a bulged shaft LED (Robinson and Greenbank 1976); (b) hysteresis loops of LED
3.1. Steel Connection Configuration
The steel profiles used in the vertical and horizontal members of the connections are NPI 200 and NPI 240, respectively. The end plate of the vertical element which has a thickness of 20 mm is attached to the top flange of the horizontal element with 8 M22 bolts. Another plate of 590 mm in length and 115 mm in wide is welded to the top flange of NPI 240 (Figures 3, 4). Four NPI 240 profiles with a length of 197 mm are welded to both ends and sides of the horizontal element to realize the connection of the specimen to the existing loading frame in the laboratory. 8 M20 size bolts are used for the connection of the specimen to the loading frame. The bolts used in the connections have a grade of 8.8.
Stiffening plates with a thickness of 10 mm are used in some cross-sections such as hydraulic jack connection, damper connections and member connection. Four plates in trapezoidal shape having a thickness of 20 mm are welded to the flanges of the vertical and horizontal
profiles. A circular hole with a diameter of 36.5 mm is placed on the trapezoidal plates to install LED (Figures 3, 4). Two connectors are produced to adapt the LED into the connection (Figure 5).
3.2. LED
A bulged shaft type LED that is implemented in this study consists of three parts. These are shaft, tube and cap. There is a spherical bulge at the center of the shaft. The diameter of the shaft and the bulge are 32 mm and 44 mm, respectively. The internal diameter of the tube is 60 mm and the thickness of the tube is 12 mm. The gap between the shaft and the tube is 8 mm. The volume between the elements is filled with lead. A typical section of LED which has a displacement capacity of ±33 mm is presented in Figure 6.
3.3. Displacement Protocol
ATC-1992 displacement protocol which is one of the first formal protocols developed in U.S. for the seismic
(a) (b)
(d) (c)
Figure 3. Specimens: (a) bare connection; (b) connection equipped with the LED Specimens; (c) bare connection detail; (d) connection equipped with the LED detail (Soydan et al. 2011)
performance evaluation of components using a cyclic loading history for the steel joints is adopted in this study. It uses the yield displacement, δy, as the
reference for increasing the amplitude of cycles. The history contains at least 6 elastic cycles (amplitudes <δy) followed by three cycles each of amplitude δy,
2δy, and 3δy, followed by pairs of cycles whose
amplitude increases in increments of δy until severe
cyclic deterioration occurs (Krawinkler 2009). Moreover, the first and second displacement steps are
intended as 1/3 and 2/3 of the yield displacement, respectively (Figure 7). The displacement protocol designed for the bare connection is used for the connections equipped with the LED.
4. EXPERIMENTAL RESULTS
4.1. Force-Displacement Relations
The behavior of the connections with and without LED is obtained from the excitation of the specified displacement protocol. The maximum displacement of the actuator is 39.60 mm and totally 21 cycles is carried out. For the maximum displacement, the corresponding restoring forces are recorded as 175 kN and 100 kN for the connections with and without LED, respectively. The force vs. displacement relationships which are determined from the experimental studies are shown in Figure 8. It is observed improvements in the energy dissipation,
300 565 1300 1580 mm 10 10 20 20 435 475 618,72 240 5 5 ∅36,5 ∅36,5 10 48 50 100 10 36 471 475 NPI200 279 417 106 NPI240 1480 238 100 500 197 106 197 50 48 106 NPI240 NPI240 NPI240 NPI240 NPI240 NPI200 100 30 2020 115 500 197 106 197 106 382 125 189 14.80 338 ∅ 921 25 1480 559 36
Figure 4. Bare connection: (a) elevation: (b) Section A-A (Soydan et al. 2011)
Figure 5. LED (in blue) and connector members (in green) (Soydan et al. 2011) 100 mm 12 20 44 20 12 14 32 14 12
Figure 6. 3D demonstration and dimensions of LED
in-plane stiffness and strength of the connection subsequently the installation of the LED.
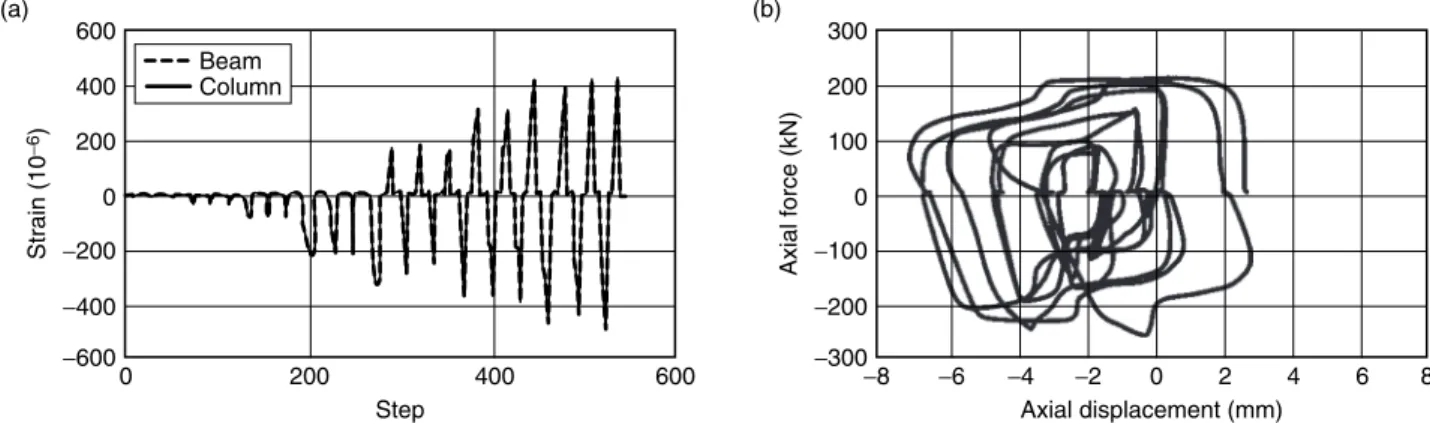
The axial displacement of the LED is monitored via displacement transducers which are installed on the LED [Figure 3(d)]. The axial force is calculated by using the strain gauge data which are installed on the LED and the steel connector members [Figure 3(d), Figure 5]. The average of strains reached for the connectors are comparable [Figure 9(a)]. The obtained
axial force-displacement relation is illustrated in Figure 9(b).
4.2. Dissipated Energy and Equivalent Damping Ratio
It is possible to determine damping with the energy relations in free vibration tests or the tests carried out with static or dynamic loads. A force-deformation loop that is obtained from the cyclic excitation with the
−50 −40 0 5 10 15 20 25 −30 −20 −10 0 10 20 30 40 50 (a) (b) Displacement (mm) Number of cycles Step Number of cycles Displacement (mm) 1 3 1/3 2.2 2 3 2/3 4.4 3 3 1 6.6 4 3 2 13.2 5 3 3 19.8 6 2 4 26.4 7 2 5 33.0 8 2 6 39.6 δ/δy
Figure 7. Displacement history: (a) displacement protocol; (b) number of cycles and displacement steps
200 (a) 150 100 50 0 Force (kN) −50 −100 −150 −200 −50 −40 −30 −20 −10 0 Displacement (mm) Pull Push 10 20 30 40 50 200 (b) 150 100 50 0 Force (kN) −50 −100 −150 −200 −50 −40 −30 −20 −10 0 Displacement (mm) Pull Push 10 20 30 40 50
Figure 8. Force-displacement relationships: (a) bare connection; (b) connection equipped with the LED
600 (a) 400 200 0 0 200 400 Step 600 −200 Strain (10 − 6) −400 −600 Beam Column 300 (b) 200 100 0 −8 −6 −4 −2 0 2 4 6 8 Axial displacement (mm) −100 Axial force (kN) −200 −300
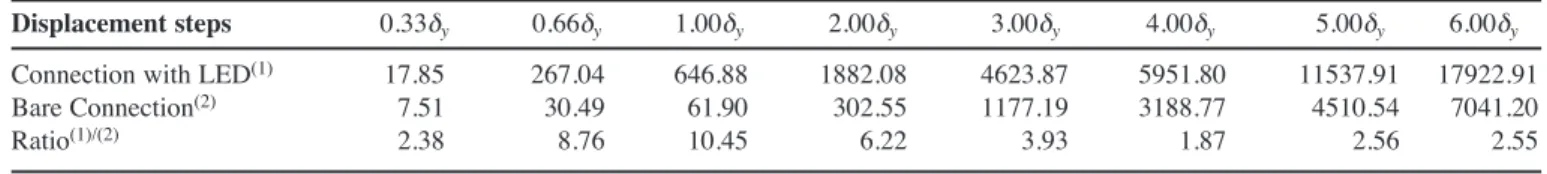
Table 1. Dissipated energy in each displacement step (kNmm)
Displacement steps 0.33δy 0.66δy 1.00δy 2.00δy 3.00δy 4.00δy 5.00δy 6.00δy Connection with LED(1) 17.85 267.04 646.88 1882.08 4623.87 5951.80 11537.91 17922.91
Bare Connection(2) 7.51 30.49 61.90 302.55 1177.19 3188.77 4510.54 7041.20
Ratio(1)/(2) 2.38 8.76 10.45 6.22 3.93 1.87 2.56 2.55
Table 2. Cumulative dissipated energy (kNmm)
Displacement steps 0.33δy 0.66δy 1.00δy 2.00δy 3.00δy 4.00δy 5.00δy 6.00δy Connection with LED(1) 17.85 284.89 931.77 2813.85 7437.72 13389.52 24927.43 42850.34
Bare Connection(2) 7.51 38.00 99.90 402.45 1579.64 4059.73 8570.27 15611.47
Ratio(1)/(2) 2.38 7.50 9.33 6.99 4.71 3.30 2.91 2.75
displacement amplitude uo is illustrated in Figure 10.
The area enclosed by hysteresis loop is the dissipated energy; ED, whereas ESois the maximum strain energy.
Equivalent damping ratio which is expressed with Eqn 1, can be obtained by equalizing the maximum strain energy with the energy dissipated by viscous damping (Chopra 2001). The dissipated energy and the maximum strain energy are determined for each cycle in order to examine the experimental results by means of the equivalent damping ratio.
(1)
4.2.1. Dissipated energy
The dissipated energy in each displacement step and the cumulative dissipated energy for the bare connection and the connection equipped with the LED are revealed in Table 1, Table 2 and Figure 11.The force-displacement loops are discretizated and the area enclosed by each hysteresis loop is calculated. The dissipated energy in each displacement step represents the total energy dissipation realized in displacement steps individually. There exists more energy dissipation for the connection with LED rather than the bare connection. Moreover the ratios of the dissipated energy are shown in Table 1. The dissipated energy and cumulative dissipated energy by the connection equipped with the LED is at least 1.87 and 2.38 times greater than the dissipated energy by the bare connection, respectively. ξ π eq D So E E = 1 4 Force Displacement u0 ED ES0
Figure 10. Energy rate method (Chopra 2001)
20000 15000 10000 5000 0 0.00 0.33 0.66 1.00 2.00 Displacement ( ) Dissipated energy (kNmm) 3.00 4.00 5.00 6.00 Bare connection
Connection with LED
50000 (b) (a) 40000 30000 10000 20000 0 0.00 0.33 0.66 1.00 2.00 3.00 4.00 5.00 6.00 Displacement ( )
Dissipated energy -cumulative (kNmm)
Bare connection Connection with LED
δy δy
4.2.2. Equivalent damping ratio
In any particular displacement step in which three cycles are applied, the average of the dissipated energy of the three cycles are considered as the dissipated energy (ED)
in the step. Similarly, in the steps that are carried out with two cycles (6th, 7thand 8thsteps), the average of the
dissipated energy in two cycles are considered as the dissipated energy (ED) in the step. The dissipated
energy, the strain energy, and the calculated equivalent damping ratio are presented in Table 3. The equivalent damping ratio for the connection with LED is
0.00 0.05 0.10 0.15 0.20 0.25 0 1 2 3 4 5 6 7 Eq
uivalent damping ratio (
eq ) ξ Displacement ( y)δ 0 1 2 3 4 5 6 7 Displacement ( y)δ 2 4 6 8 10 12 0 Stiffness (kN/mm) (a) (b) Bare Connection Connection with LED Bare Connection
Connection with LED
Table 3. Dissipated energy, maximum strain energy and equivalent damping ratio
Connection with LED Bare Connection Ratio
δ (mm) δ /δy ED(kNmm) ESo(kNmm) ξeq(2) ED(kNmm) ESo(kNmm) ξeq(1) (2)/(1) 2.20 0.33 5.95 24.69 0.0192 2.50 14.01 0.0142 1.349 4.40 0.66 89.01 83.14 0.0852 10.16 51.37 0.0157 5.412 6.60 1.00 215.63 180.10 0.0953 20.63 112.11 0.0146 6.505 13.20 2.00 627.36 603.51 0.0827 100.85 413.28 0.0194 4.260 19.80 3.00 1541.29 1244.78 0.0985 392.40 773.43 0.0404 2.441 26.40 4.00 2975.90 2025.51 0.1169 1594.39 1198.53 0.1059 1.104 33.00 5.00 5768.96 2850.82 0.1610 2255.27 1598.19 0.1123 1.434 39.60 6.00 8961.46 3470.08 0.2055 3520.60 1994.58 0.1405 1.463
Figure 12. Characteristics of the connections: (a) equivalent damping ratio; (b) stiffness
Figure 13. Force-displacement relationship
Force
Displacement ke
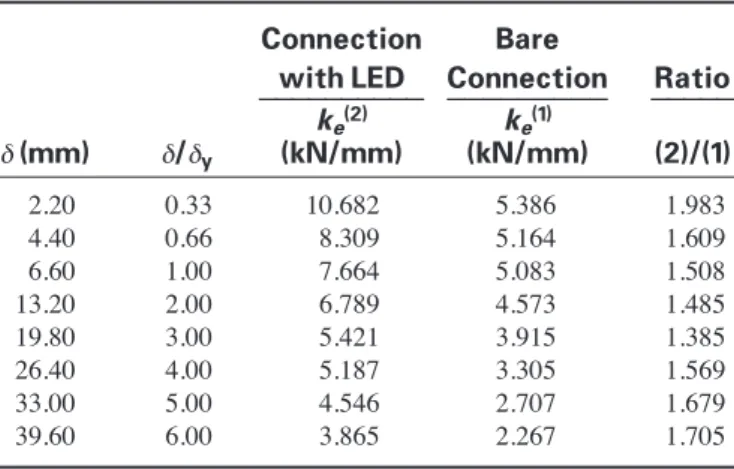
Table 4. The stiffness of the connections Connection Bare
with LED Connection Ratio __________ _________ _____ ke(2) ke(1) δ (mm) δ/δy (kN/mm) (kN/mm) (2)/(1) 2.20 0.33 10.682 5.386 1.983 4.40 0.66 8.309 5.164 1.609 6.60 1.00 7.664 5.083 1.508 13.20 2.00 6.789 4.573 1.485 19.80 3.00 5.421 3.915 1.385 26.40 4.00 5.187 3.305 1.569 33.00 5.00 4.546 2.707 1.679 39.60 6.00 3.865 2.267 1.705
comparatively greater than the bare connection for each displacement level [Figure 12(a)].
4.3. Effective Stiffness
The effective stiffness of the connections is determined from the force-displacement relations. The stiffness is defined as inclination of the line which connects two peak points of a cycle (Figure 13). The effective stiffness of the connection equipped with the LED is at least 38.5% times greater than the bare connection [Figure 12(b) and Table 4].
5. ANALYTICAL EVALUATION
The analytical models of the two types of connections are generated by using the well known structural analysis program of SAP2000. The steel members joining at the connection are defined as frame type elements. Two moderately rigid elements are defined for the intersection district of the horizontal and vertical members. The characteristics of the LED are taken from Soydan (2014). The following analyses are performed for the connections.
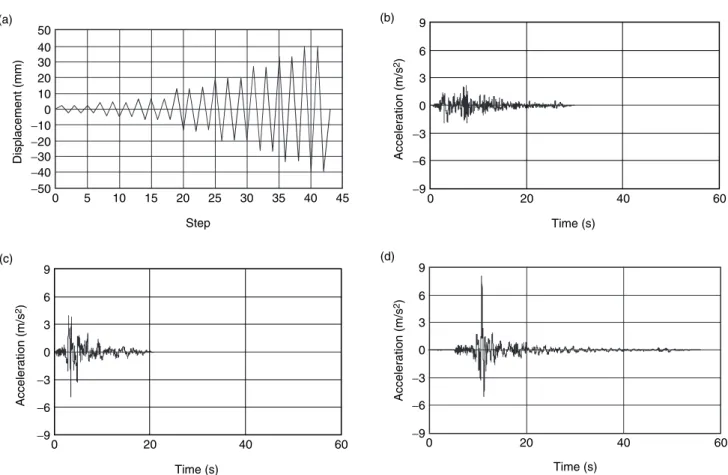
(1) Non-linear static analyses (NSA) are performed for the model calibration. The displacement protocol which is applied in the experimental study is used in the analytical work [Figure 14(a)]. The force-displacement relations obtained from analytical work are compared with the experimental results.
(2) Non-linear dynamic time history analyses (NDTHA) are performed to expose the efficiency of the LED in the steel connection. EC8 requires a minimum of 3 accelerograms if the most unfavorable seismic response is to be considered. So, NDTHA are carried out for the acceleration
records of Kocaeli-1999, Erzincan-1992, Düzce-1999 earthquakes [Figures 14(b), 14(c), 14(d)], (PEER NGA database). A lumped mass of 12 kNs2/m is assigned to the
level of hydraulic jack. A critical damping ratio of 2% is used for the steel members. The supplementary damping due to the LED is assigned convenient to the experimental result. The Newmark time integration method is used with the values of β = 0.25 and γ = 0.50. The integration time step is selected as equal to the time step of the related accelerogram.
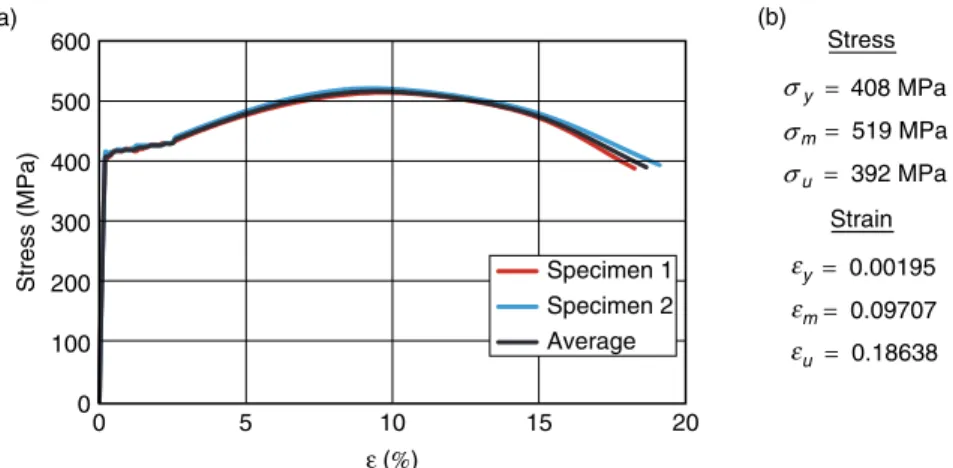
The exact material properties of steel are obtained from the performed standard tension tests. The results determined from the tests are exposed in Figure 15. The indices y, m and u stand for yielding, maximum and ultimate, respectively.
5.1. Analytical Model of the Bare Connection The steel members and the bolted connection are modeled by frame element and multi-linear plastic link element, respectively. The nonlinear behavior of the connection is undertaken by the multi-linear plastic link
−50 −40 −30 −20 −10 0 10 20 30 40 50 0 5 10 15 20 25 30 35 40 45 Displacement (mm) Step −9 −6 −3 0 3 6 9 0 20 40 60 Acceleration (m/s 2) Time (s) (c) (a) −9 −6 −3 0 3 6 9 0 20 40 60 Acceleration (m/s 2) Time (s) −9 −6 −3 0 3 6 9 0 20 40 60 Acceleration (m/s 2) Time (s) (d) (b)
Figure 14. Time history functions used in the analytical evaluation: (a) displacement pattern for NSA; (b) Kocaeli EQ; (c) Erzincan EQ; (d) DüzceEQ for NDTHA
−200 −150 −100 −50 0 50 100 150 200 −0.15 −0.10 −0.05 0.00 0.05 0.10 0.15 Moment (kNm) Rotation (rad) (−131.70, −0.100) (−82.16, −0.004) (82.16, 0.004) (131.70, 0.100) (c) (b) (a)
Figure 16. Bare connection: (a) system; (b) analytical model; (c) moment-rotation relationship of the multi-linear plastic link element
−200 −150 −100 −50 0 50 100 150 200 −0.15 −0.10 −0.05 0.00 0.05 0.10 0.15 Moment (kNm) Rotation (rad) (−131.70, −0.100) (−102.7, −0.004) (102.7, 0.004) (131.70, 0.100) (c) (b) (a)
Figure 17. Connection equipped with the LED: (a) system; (b) analytical model; (c) moment-rotation relationship of the
multi-linear plastic link element
ε ε 0 100 200 300 400 500 600 0 5 10 15 20 Stress (MPa) ε (%) Stress y = 408 MPa m = 519 MPa u = 392 MPa Strain y = 0.00195 m= 0.09707 u = 0.18638 (a) (b) Specimen 1 Specimen 2 Average σ σ σ ε
Figure 15. Properties of steel: (a) stress-strain relationship; (b) stress and strain at specific points
element whose yielding moment is represented as 80% of the yielding moment capacity of the vertical element (Figure 16). This reduction is mainly based on the observation that the yielding on the end-plate is realized before the vertical steel member. The parameters of the pivot hysteretic model used in the time history analysis are as follows: α1and α2are 4.0, β1and β2are 0.50 and
η is 0.0. The lumped mass is illustrated with a bulky dot in Figure 16(b).
5.2. Analytical Model of the Connection Equipped with the LED
In addition to the elements used in the bare connection, a plastic (wen) type uniaxial link element is adapted to the analytical model to represent LED (Figure 17). The stiffness, yield strength, post yield stiffness ratio and yielding exponent of the LED are adopted as 350000 kN/m, 75 kN, 0.0003 and 1.0,
respectively. The parameters of the link element were taken from the experimental study conducted by Soydan (2014). The installation of the plastic (wen) type uniaxial element provides the researchers the ability of using axial behavior of the LED directly through the analytical model of steel connection. Two moderately rigid frame elements are used to represent the connections of LED. Also, a multi-linear plastic link element which has a yielding capacity equals to the vertical element’s is positioned above the upper connection of LED.
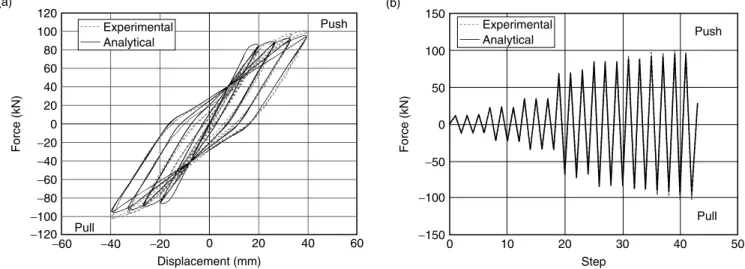
5.3. Comparison of Experimental and Analytical Results for the Bare Connection
There exists a good correlation between the analytical and experimental results as can be seen in Figure 18. The analytically obtained force-displacement relationship and the force history are rationally close to the experimental ones. The discrepancy taking place in the force-displacement cycles drawn for the displacement of 13.20 mm, 19.80 mm and 26.40 mm is
attributed to the yielding of the end plate of the vertical member.
5.4. Comparison of NDTHA Results of the Bare and LED Equipped Connections
The restoring force versus top displacement relations obtained for the three earthquakes are given in Figure 19. Although yielding of the bare connection is detected in different ranges, almost an elastic response is attained for the connection equipped with the LED. The histories of the top displacement and the restoring force are given in Figure 20. The maximum top displacement decreased by approximately 45-75% for the connection equipped with the LED respect to the bare connection for the considered earthquakes. Decrement of the top displacement yields the decrement in the rotations observed at connections. Although the maximum restoring force increments in Erzincan and Düzce Earthquakes are about 25% and 11%, respectively, there is 40% decrement for Kocaeli Earthquake (Table 5). −120 −100 −80 −60 −40 −20 0 20 40 60 80 100 120 −60 −40 −20 0 20 40 60 Force (kN) Displacement (mm) Push Push Pull Pull −150 −100 −50 0 50 100 150 0 10 20 30 40 50 Force (kN) Step (b) (a) Experimental Analytical Experimental Analytical
Figure 18. Bare connection: (a) force vs. displacement hysteresis; (b) force history
−100 −150 −50 50 100 150 Re s to ri ng f o rce ( k N ) Top displacement (mm) 10 0 20 30 40 −40 −30 −20 −10 0 Bare Connection Kocaeli −100 −150 −50 50 100 150 Re s to ri ng f o rce ( k N ) Top displacement (mm) 10 0 20 30 40 −40 −30 −20 −10 0
Connection Equipped with the LED Kocaeli
−100 −150 −50 50 100 150 Re s to ri ng f o rce ( k N ) Top displacement (mm) 10 0 20 30 40 −40 −30 −20 −10 0 Erzincan −100 −150 −50 50 100 150 Re s to ri ng f o rce ( k N ) Top displacement (mm) 10 0 20 30 40 −40 −30 −20 −10 0 Du¨zce −100 −150 −50 50 100 150 Re s to ri ng f o rce ( k N ) Top displacement (mm) 10 0 20 30 40 −40 −30 −20 −10 0 Erzincan −100 −150 −50 50 100 150 Re s to ri ng f o rce ( k N ) Top displacement (mm) 10 0 20 30 40 −40 −30 −20 −10 0 Du¨zce
Figure 19. Comparison of the restoring force-top displacement relationships: (a) Kocaeli EQ; (b) Erzincan EQ; (c) Düzce EQ
Restoring force Top displacement −40 −30 −20 −10 0 10 20 30 40 0 5 10 15 20 25 30 35 Top displacement (mm) Time (s) −150 −100 −50 0 50 100 150 0 5 10 15 20 25 30 35 Restoring force (kN) Time (s) −40 −30 −20 −10 0 10 20 30 40 0 5 10 15 20 25 Top displacement (mm) Time (s) −150 −100 −50 0 50 100 150 0 5 10 15 20 25 Restoring force (kN) Time (s) 0 Bare connection Connection with LED
Bare connection Connection with LED
Bare connection Connection with LED Bare connection Connection with LED
Kocaeli Kocaeli
Erzincan Erzincan
The LED displacement vs. force relations achieved from NDTHA is demonstrated together with the LED member test results in Figure 21. The member test result
of the LED which was obtained from the experimental study (Soydan 2014) is shown with a light grey continuous line. It is observed that the forms of the Table 5. The maximum values of restoring force and top displacement
Bare Connection Connection Equipped with the LED
______________________________________ ______________________________________ F (+) F (−) δ (+) δ (−) F (+) F (−) δ (+) δ (−) EQ (kN) (kN) (mm) (mm) (kN) (kN) (mm) (mm) Kocaeli 84.78 85.70 20.38 22.20 48.17 52.33 4.83 5.54 Erzincan 87.09 89.53 25.19 30.19 85.41 111.30 11.89 16.88 Duzce 86.90 93.28 24.79 37.87 72.58 103.83 9.44 15.42
F: Restoring Force; δ: Top Displacement
−40 −30 −20 −10 0 10 20 30 40 0 20 40 60 Top displacement (mm) Time (s) −150 −100 −50 0 50 100 150 0 20 40 60 Restoring force (kN) Time (s) Bare connection
Connection with LED
Bare connection Connection with LED
Düzce Düzce
Figure 20. Comparison of the top displacement and restoring force histories
−200 −100 100 200 Ax ia l f o rce ( k N ) −6 −4 −2 0 2 4 6 Axial displacement (mm) Experimental Analytical Kocaeli 0 −200 −100 100 200 Ax ia l f o rce ( k N ) −6 −4 −2 0 2 4 6 Axial displacement (mm) Experimental Analytical Erzincan 0 −200 −100 100 200 Ax ia l f o rce ( k N ) −6 −4 −2 0 2 4 6 Axial displacement (mm) Experimental Analytical Du¨zce 0
curves are close to each other. The initial stiffness, yield force and the slope of branch of the hysteresis are quite similar. It may be attributed to the success of the constitutive model used for the LED in the structural analysis program.
6. CONCLUSIONS
The seismic behavior of the steel connection equipped with the lead extrusion damper (LED) is examined through the experimental and analytical studies. By analyzing the experimental restoring force vs. displacement relations; it is attained to the dissipated energy, equivalent damping ratio and the effective stiffness.
For the connection equipped with the LED, the dissipated energy and the effective stiffness are 1.87 and 1.39 times bigger than those of the bare connection. Furthermore, equivalent damping ratio observed for the connection with LED is 1.10 to 6.50 times greater than the bare connection.
Nonlinear dynamic time history analyses are performed for the connections with and without LED. The top displacements are decreased between 45−75% and the restoring force is increased 25% at most among the considered acceleration records.
Consequently, the installation of LED to the steel connection increases in-plane stiffness, strength and damping properties as well as decreases the deformations.
ACKNOWLEDGEMENTS
The experimental part of this study was conducted at Structural and Earthquake Engineering Laboratory of ITU. The authors acknowledge to the various graduate students who contribute to this study as well as the laboratory staff. Funding for this research was provided by ITU Department of Scientific Research Projects of 34285, 34014, 34031, 35057 and 35065. Also the contribution of Irmak Cagdas Makina Industry to the development of LED is gratefully acknowledged.
REFERENCES
ATC-24 (1992). Guidelines for Cyclic Seismic Testing of Components of Steel Structures, Applied Technology Council, California, USA.
Aiken, I. (1996). “Passive energy dissipation-hardware and applications”, Proceedings of the Los Angeles County and SEAOSC Symposium on Passive Energy Dissipation Systems for New and Existing Buildings, Los Angeles, USA.
Birchenall, C.E. (1959). Physical Metallurgy, McGraw-Hill, London, UK.
Barbat, A.H. and Bozzo, L.M. (1997). “Seismic analysis of base isolated buildings”, Archives of Computational Methods in Engineering, Vol. 4, No. 2, pp. 153–192.
Chopra, A.K. (2001). Dynamics of Structures: Theory and Applications to Earthquake Engineering, Pearson Prentice Hall, NJ, USA. Cousins, W.J. and Porritt, T.E. (1993). “Improvements to
lead-extrusion damper technology”, Bulletin of the New Zealand Society for Earthquake Engineering, Vol. 26, No. 3, pp. 342–348. Eurocode 8 (2005). Design of Structures for Earthquake Resistance Part 1: General Rules, Seismic Actions and Rules for Buildings, European Committee for Standardization, Brussels, Belgium. Hanson, R.D., Aiken, I.D., Nims, D.K., Richter, P.J. and Batchman,
R.E. (1993). “State of the art and state of the practice in seismic engineering dissipation”, Proceedings of ATC-17-1 Seminar on Seismic Isolation, Passive Energy Dissipation and Active Control, Advanced Technology Council, San Francisco, California, pp. 449–471.
Krawinkler, H. (2009). “Loading histories for cyclic tests in support of performance assessment of structural components”, Proceedings of the 3rd International Conference on Advances in Experimental Structural Engineering, San Francisco, USA. Mander, T.J., Rodgers, G.W., Chase, J.G., Mander, J.B., MacRae,
G.A. and Dhakal, R.P. (2009). “Damage avoidance design steel beam-column moment connection using high-force-to-volume dissipators”, Journal of Structural Engineering, ASCE, Vol. 135, No. 11, pp. 1305–1433.
PEER NGA Database. Pacific Earthquake Engineering Research Center: NGA Database. (http://peer.berkeley.edu/peer_ground_ motion_database/)
Robinson, W.H. and Greenbank, L.R. (1975). “Properties of an extrusion energy absorber”, Bulletin of the New Zealand Society for Earthquake Engineering, Vol. 8, No. 3, pp. 187–191. Robinson, W.H. and Greenbank, L.R. (1976). “An extrusion energy
absorber suitable for the protection of structure during an earthquake”, Earthquake Engineering and Structural Dynamics, Vol. 4, pp. 251–259.
Robinson, W.H. and Cousins, W.J. (1987). “Recent developments in lead dampers for base isolation”, Pacific Conference on Earthquake Engineering, Vol. 2, New Zealand.
Rodgers, G.W., Chase, J.G., Mander, J.B., Leach, N.C., Denmead, C.S., Cleeve, D. and Heaton, D. (2006). “High force-to-volume extrusion dampers and shock absorbers for civil infrastructure”, Proceedings of the 19th Australasian Conference on Mechanics of Structures and Materials, Christchurch, New Zealand. Rodgers, G.W., Chase, J.G., Mander, J.B., Leach, N.C. and Denmead,
C.S. (2006). “Experimental development, tradeoff analysis and design implementation of high force-to-volume extrusion damper technology”, Bulletin of the New Zealand National Society for Earthquake Engineering, Vol. 40, No. 2, pp. 35–48.
Rodgers, G.W. (2009). Next Generation Structural Technologies: Implementing High Force-to-Volume Energy Absorbers, PhD Thesis, University of Canterbury, New Zealand.
rate-dependent modeling of damage avoidance steel connections using HF2V damping devices”, Earthquake Engineering and Structural Dynamics, Vol. 40, pp. 977–992.
Sadek, F., Mohraz, B., Taylor, A.W. and Chung, R.M. (1996). Passive Energy Dissipating Devices for Sesismic Applications, Report NISTIR 5923, Building and Fire Research Laboratory, National Institute of Standards and Technology, Gaithersburg, Maryland. SAP2000 (2009). Integrated Software For Structural Analysis and
Design, Computers and Structures Inc., California, USA. Skinner, R.I., Robinson, W.H. and McVerry, G.H. (1993). An
Introduction to Seismic Isolation, John Wiley and Sons, New York, USA.
Soydan, C., Koçak, M. Özkaynak, H., Yüksel, E. and I.rtem, E. (2011). “The effect of the lead extrusion damper on the behaviour of a joint”, Proceedings of the 7th National Conference on Earthquake Engineering, Maslak/I.stanbul, 30 May-03 June. Soydan, C. (2014). A New Beam-to-Column Connection for the
Precast Concrete Structures and Evaluation of Its Earthquake Performance, PhD Thesis, Graduate School of ITU, Istanbul, Turkey. (to be submitted)
Wulf, J., Taylor, J.F. and Shaler, A.J. (1956). Metallurgy for Engineers, John Wiley and Sons, New York, USA.
NOTATION
δy yield displacement
uo displacement amplitude
ED dissipated energy
ESo maximum strain energy
ξeq equivalent damping ratio
ke effective stiffness
β parameter of Newmark time integration
method
Vo parameter of Newmark time integration method
E modulus of elasticity σy yield stress σm maximum stress σu ultimate stress εy yield strain εm maximum strain εu ultimate strain
α1, α2 parameters of the pivot hysteretic model
β1, β2 parameters of the pivot hysteretic model
η parameter of the pivot hysteretic model F restoring force
![[Avlonyalı Mehmed Ferid Paşa hakkında kupür]](data:image/gif;base64,R0lGODlhAQABAIAAAP///wAAACH5BAEAAAAALAAAAAABAAEAAAICRAEAOw==)