H &
3256-5
lASÍtEVílF lURiUSa üMMESeiAJ.
ft S T A T IS T IC A I A P P K O A e H
A t íiI S I S
i
TÁi
O S lB O i^ T I SG110Ü1 §F
gtJS’ flIS S A0 1Í*1^ÍS TE# JíO i
ir ©SL?i-fe«'
f O E THE D E S P E E 6?
B A S T E S OF
TSAT10S
THE RELATIVE PROFITABILITY OF TURKISH COMMERCIAL BANKS; A STATISTICAL APPROACH
by
N. CEM BARTU
A Thesis
Submitted to the Department of Management And the Graduate School of Business Administration
in partial fulfillment of the requirements for the degree of Master of Business Administration
Bilkent University February,1992
KOr
Ъ ‘2 -5 (о .5
I certify that I have read this thesis, and in my opinion, it is fully adequate in scope and in quality as a thesis for the degree of M aster of Business Administration.
Asst. Prof. Can §imga Mugan
7
...
V)
I certify that I have read this thesis, and in my opinion, it is fully adequate in scope and in quality as a thesis for the degree of Master of Business Administration.
Assoc. Prof. Kiir§at Aydogan
I certify that I have read this thesis, and in my opinion, it is fully adequate in scope and in quality as a thesis for the degree of M aster of Business Administration.
Assist. Prof. Giilnur Muradoglu §engiil
ACKNOWLEDGEMENT
This study is conducted under supervision of Asst. Prof. Can §imga Mugan to whom I wish to express my deep gratitude for her invaluable guidance and productive criticisms throughout the completion of this m aster thesis.
I would like to express my sincere thanks to Assoc. Prof. Kur§at Aydogan and Asst. Prof. Giilnur §engul Muradoglu for serving on my thesis committee. 1 also owe a debt of gratitude to them for their suggessions and corrections.
Finally, I am sincerely grateful to my parents, my friends Zeynep Şahinler, Tunc Taşman , my managers and my friends at the Central Bank of Republic of Turkey for the continious patience and encouragement of this thesis.
ABSTRACT
TH E RELATIVE PROFITABILITY OF TURKISH COM M ERCIAL BANKS: A STATISTICAL APPROACH
N. Cem Bartu M.B.A
Supervisor : Asst. Prof. Can §imga M u |an February 1992, 82 Pages
Conceptually, every banking decision should be considered for its impact on the maximization of shareholder wealth. However, in a world of uncertainity, regulation, and limited action-reaction time and limited resources, it is not possible to follow the conceptually correct approach for the multitude of decisions bankers face. One practical approach to the complex, interactive nature of bank decisions is to disaggregate this system of interrelations into key operational variables.
This study analyzes the differential effects of the selected key variables - management, size, stewardship, time - on commercial bank profitability in Turkey and the operating relationships through which these effects are transmitted and relative profitability determined.
Overall, the study shows that all variables tested are significant. Each variable significantly affects relative profitability and the majority of operating relationships that determ ine profitability. Also notable, is the extreme influence of these effects on particular relationships.
TABLE OF CONTENTS ACKNOWLEDGMENT ABSTRACT OZET TABLE OF CONTENTS LIST OF TABLES Page i ii iii iv vi I .INTRODUCTION
1.1. Purpose of the Study
1
3
II. COMMERCIAL BANKING INDUSTRY 5
2.1. Description of Commercial Banking System 5
2.2. Turkish Commercial Banking Sector 7
2.2.1. Development through years 7
2.2.2. Structural Developments After 1980 8
2.2.3. Position of the Sector in 1989_1990 10
2.2.4. Bank management in Turkey 14
2.2.5. Developments in Branch Numbers 15
2.2.6. Developments in Deposits 16
III. BACKGROUND OF THE BANK MARKET STUDIES 3.1. Studies in General
3.2. Bank Market in Turkish Literature
19 19 24 IV. METHODOLOGY 28 4.1. Data Collection 28 4.1.1. Source of Data 28
4.1.2. Method of Data Compilation 30
4.3. Analysis and Results 41 V. DISCUSSION 5.1. Management Effects 5.2. Size Effects 5.3. Stewardship Effects 5.4. Time Effects 46 46 47 48 50
VI. CONCLUSION AND RECOMMENDATIONS 52
REFERENCES 54
APPENDICES 60
Appendix A 60
The Operating Ratios Used in the Study 61
The Banks Used in the Study 64
Appendix B 66
The Notation for the Fixed Effects Model 66
The Anova Analysis with Fixed Effects Model .71
Appendix C 75
Main Effects of Model_l 76
Steward and Manage Interac. Effects of Model_l 77
Steward and Size Interac. Effects of Model_l 78
Size and Manage Interaction Effects of Model_l 79
Main Effects of Model_2 80
Two-Factor Interactions of Model_2 81
LIST OF TABLES
TABLE.1 General Financial Developments
of the Turkish Banks
TABLE.2 Numbers of Banks Due to their Structure 12
TABLE.3 Number of Branches and Number
of Employees of the Turkish Banks 15
TABLE.4 Deposit Stuation of the Turkish
Banks between 1980 and 1990 17
TABLE.5 Distribution of Deposits by Type
and by Bank Group in 1990 18
TABLE.6 Categorization of Data for
Three-factor Analysis 33
TABLE.7 Categorization of Data for
Four-factor Analysis 34
TABLE.8 Hypotheses tested for
Three-factor Analysis 37
TABLE.9 Significant F Values Obtained
for Management Effects 42
TABLE.10 Significant F Values Obtained
for Stewardship Effects 43
TABLE.11 Significant F Values
Obtained for Size Effects 44
TABLE.12 Significant F Values
TABLE.13 ( App. C )Main Effects of Model_I 76
TABLE.14 ( App. C ) Steward and Management
Interactions of Model I 77
TABLE.15 ( App. C ) Steward and
Size Interactions of Model I 78
TABLE.16 { App. C ) Management and Size
Interactions of Model I 79
TABLE.17 ( App. C ) Main Effects of Model_II 80
TABLE.18 ( App. C ) Three-factor Interactions
of Model II 81
TABLE.19 ( App. C ) Four-factor Interactions
CHAPTER I INTRODUCTION
The rapid increase in recent years of economic and social
relationships with a number of foreign countries
possessing a significant volume of purchasing power, and the increase of Turkey's importance from the standpoint
of international transit trade improved Turkey's
positional advantages as a place for commercial banking
business. Turkish commercial banking system presently
reached a level where it can provide banking services in
a manner and variety which complies with the
international standards. However, the analysis of the nature of this performance and success of the banks is a very complex phenomenon.
Executives of the commercial banks have distinguished themselves, through the years, as managers most receptive to new banking technology and management tools. They have
initiated many studies in order to improve the
perfoirmance of the banks and provide high levels of service to their client.
Conceptually, every banking decision should be considered for its impact on the maximization of shareholder wealth.
However in a world of uncertainty, regulation, and
limited action-reaction time and limited resources, it is not possible to follow the conceptually correct approach for the multitude of decisions bankers face. One approach to the complex, interactive nature of bank decisions is to disaggregate this system of interrelationships into key operational variables.
The studies of structure-performance relationship investigate the variables which describe the structure of a bank market. Traditionally, concentration level is used
as a variable to examine this relationship. It is
possible to observe a financial system in which a few large banks dominate the markets for deposits and loans but non-bank institutions in related financial markets provide substitute instruments to borrowers and savers at
competitive rates. In such a case, consideration of
concentration levels among banks alone would lead to an understatement of degree of competition in the market. This has not been an important consideration in Turkey until recently because of the minor importance of the capital markets. [44]
However, there are many other variables that are
necessary to describe the structure of the Turkish
banking market. One should also consider the demand for financial services, the degree of actual and potential competition, the degree of specialization among banks, the nature of ownership, the control relations between
banks and other business enterprises, the degree of
government ownership and control, and the legal
environment surrounding the banking sector.
As it will be explained in the 'Background of Bank Market Studies in Turkey' part of this study there are important
studies analyzing the Turkish bank market. These
structure performance studies generally investigate the
concentration variable as an important factor
1.1. Purpose of The Study
The purpose of the study is to clarify the relationship between market structure and profitability in Turkey.
This study uses a different approach from those
structure-performance studies which investigate generally concentration as a variable, by bringing a new relative profitability evaluation approach into the banking sector
in Turkey.
This study analyzes the differential effects of some selected variables on commercial bank profitability in Turkey, and the operating relationships through which these effects are transmitted and relative profitability determined.
The variables tested for significance are chosen as:
i) Deposit size ( Size effects )
ii) Changes in the general environment ( Time effects )
iii) Stewardship effects iv) Management effects
Time effects are the results of differences in the general economic environment represented by changes over time. Total deposits of the banks represent the size effects that are due to the differences in the bank size. Stewardship effects represent the differences in the natural division of the Turkish banks where there exist a
heterogeneity in this sector . Management effects arise
from the differences in bank management strategies,
objectives, and the actions reflected in the differences
analyzes the nature of the commercial banking measures
and relates them to relative bank profitability, it
assumes that commercial bank management is the most important factor , in an absolute sense to profitability.
Statistically, the study tests hypotheses whether there
are significant differences in commercial bank
profitability arising from differences in specified
variables. If these hypotheses are accepted, the next set of hypotheses state that these variables significantly affect operating relationships which help to explain the
profitability differences. The variables and the
operating ratios used in the statistical analysis are chosen due to the nature of the Turkish Banking Industry.
In the next chapter a general description commercial banking and the developments in the banking sector in Turkey in the light of previous developments and the current situation of the Turkish financial and mainly banking systems are summarized. The following chapter gives the background of the bank market studies both in general and in Turkish literature and relates them to this study. In the fourth chapter the methodology and the statistical analysis followed in the study is given with the results. In the last two chapters the significant
results found in the analysis are discussed and
CHAPTER II DESCRIPTION OF COMMERCIAL BANKING INDUSTRY
2.1. The Commercial Banking Sector
2.1.1 Description
Commercial banks, holding the deposits as principal
liabilities are differentiated from other financial
institutions. They serve both as intermediaries between savers and borrowers and as lenders of newly created funds.
Through the years commercial banks have expanded
geographically to regional, national and international
scope. Today, they are offering more services to
customers beyond the traditional banking functions of receiving deposits and making loans.
The expanding multinational role of banking includes activities in almost all forms of loans and investments ranging from short term to long term in nature, and from local to international in scope. The core of the banking business, that of an intermediary taking in funds from savers and lending them to borrowers, remains constant even though the sources of funds and the manner of
handling deposits and making loans has changed
significantly.
Commercial banks influence not only the size of the money stock, but also the allocation of funds and thus the direction and use of resources within the system as a whole.
Commercial banks sell their services to individuals,
business and governmental units. Among the business
customers of many banks there are other commercial banks. Like non-bank businesses or individuals, commercial banks purchase the same general types of services as clearing,
depository, credit advice and supply. The flow of
services among banks has created a correspondent banking, integrating the banking system. An efficient system for the production and distribution of bank output has to be offered for such a system.
Important changes are occurring in the structure of commercial banking industry as witnessed by the rapid expansion of branch banking and the growth of bank
holding companies. In regulated industries, such as
banking, public interest considerations dictate that
these structural changes on some basic concepts -what we call them variables of the banking industry- tried to be guide to protect the viability of the banking system
while at the same time preserving competition and
promoting efficiency. [19]
Commercial banks have also pursued strategies towards the widening of the range of their activities in response to demand changes or promising business opportunities. Major trends in this regard have been: 1. The diversification of liability and savings instruments, 2. The expansion of
the range of international lending, 3. Borrowing and
service activities, 4. The development of term loan
facilities and 5. The entry into, or the expansion of, mortgage lending activities as well as the development of leasing and factoring business. However, in many cases the diversification into these new business areas has not
required special legal action by the authorities. To the extent that banking legislation has been amended to include these new activities in the list of authorized banking transactions, legislators have mostly confirmed market developments.[8]
2.2. The Turkish CoHunercial Banking Sector
2.2.1. Development Through Years
When we examine the banks engaged in activity today in terms of the dates of their establishment, it becomes clear that they are in possession of a considerable accumulation of experience going back 125 years. Together
with the State-owned banks twelve of the national
commercial banks presently in operation were founded before 1930, with one of them founded in 1863. The years following the establishment of the Republic in 1923 were the most important years for the founding of national banks, eight of which were opened between 1924 and 1928 alone. Of these banks, only one is a State Economic
Enterprise. Six of the national banks commenced
operations during the years between 1952 and 1959
following the transition in 1950 to true multi-party government. The number of national banks founded after 1980 on the other hand is eleven. [39]
Major developments of the deregulation and
diversification of financial service activities of
Turkish commercial banks happened during 1960s. In 1961 there existed the introduction of direct controls on bank
credits. After then, in 1964 an introduction of
have been developed during 1964-1980 period to widen the scope of preferential credits. Banks were allowed to accept foreign exchange deposits from non-residents in 1967. [8]
During the 1970s the developments continued : Commercial
banks began to grant medium-term credits in 1972. In 1974 authorized banks were allowed to hold foreign exchange position. [8]
2.2.1. Structural Developments After 1980
Taking into consideration the structure and underlying problems of the financial system which existed before 1980, the progress achieved in the banking system during
1980's can be summarized as the liberalization of
interest rates and foreign exchange operations, the
strengthening the banking system, as well as increasing the soundness and efficiency of the system. [43]
Accelerating with the regulatory changes during the 1980s
Turkish banking industry faced many developments
together with the whole Turkish financial system. One of the major developments of this duration is beginning of the application of positive real interest rates which not only importantly affect the source financing of the banks but increased the deposit acceleration as well. Besides
these, the foreign banks pioneering Turkish banks to
start the modern banking applications and strengthening the relations with abroad, became another impact in this duration.
When we glance at the financial development through the years 1980-1990 we can see the major changes in numbers
in Table 1 . The source is the Banks Association of
Turkey[40]: 1980 1990 TL TL Loans 813 81,023 Deposits 814 95,318 Profits 18 3,878 Equities 79 17,282 Total Assets 1,516 170,275
Table 1 General Financial Developments in Turkey (1980 - 1990 ) [40]
Major reforms in legal and institutional framework of the financial system which widen the scope of activities of the commercial banks started since early 1980s. [8]
Following the enactment of the Capital Market Law (1981)
banks have introduced or developed the following
activities and services: buying and selling securities for customers; advisory services ; management of mutual funds ; underwriting agreements.[8]
Major banking reform legislation, which begun in July 1983 was completed in April 1985. The new banking law contains provisions on capital requirements, contingency reserves, accounting and reporting standards and deposit
contribution for commercial banks, to be adjusted periodically for inflation.
From 1986 on, banks are required to conform to uniform accounting rules and prepare detailed periodic reports on their operations to the Central Bank. All deposit money banks are obliged to buy minimum insurance coverage for savings deposits from the Savings Deposit Insurance Fund,
established under Central Bank supervision. Other
regulations included in the banking law involve:
limitations on branch banking, rules governing foreign
banking, external audit requirements, minimum
professional qualifications for bank managers, treatment of nonperforming loans, and limitations on bank credits to any single borrower and to related entities.[42]
2.2.2 The Position of the Sector in 1989 and 1990
Since this study uses the data in 1989 and 1990 it will be meaningful to look at the current situation ;
As the term concerned ( 1980-1990 ) , the banking system
was strengthened by putting into force the prudential regulations in line with international practices and guidelines. The soundness of system was, also, enhanced
by improving the on and off-site supervision,
establishing an independent auditing mechanism and making the system uniform. The banking system has progressed by the introduction of new markets like foreign exchange and gold markets. The liberalization of the foreign exchange regime, on the one hand, created and opportunity for
banks to increase their profitability by mobilizing
allowing them to be involved in Treasury activities an efficient TL and foreign exchange fund management. At the beginning of 1990, the volume of preferential credits, which was another obstacle for the efficiency of banking activities, are reduced. Distortions in the efficiency of the banking system, caused by high taxation on financial intermediates, were reduced to some extent by decreasing the reserve requirement ratios, the withholding tax rates and the RUSF charges. Regardless of the originator of the
financial instruments, the share of banks in the
secondary markets of these instruments is about 90
percent. [43]
By 1990 the number of banks had grown from 49 to 67 compared to 1980. Currently, the Turkish banking sector, excluding the central bank, comprises 33 national banks, ten development and investment banks and 23 banks which are either partly owned by, or are branches of foreign banks.[40]
The documentation of banks due to their structure is given in Table 2. The figures are taken from Annual Banks Association of Turkey Report for the year 1990 [40]
Turkish banking continues to present several paradoxical features. Operating costs and levels of efficiency in the
mainstream Turkish banking are still very high, and
though there are a large number of participants in the
market, competition in retail banking and corporate
banking is still limited. Foreign investment has been welcomed for a decade, but foreign banks as yet have not been allowed into the mainstream retail banking. The bonds between industry and the banks have not been cut.
Banks operating in Turkey The Central Bank
National Coitimercial Banks
A. State-owned banks
B. Private banks
8
25
32
Other commercial banks
A. Banks established in Turkey
B. Banks having branch offices in Turkey
7 16
23
Development and investment banks
A. State-owned banks B. Private banks a. National banks b. Foreign banks 10 3 7 4 3 Total 66 Table 2 [40]
Above all, interest rate policy has not been irreversibly reformed: Turkey ended the 1980s as it has begun to them, with negative rates of interest on one year deposits.[2]
Banking, as a structural property, is a high risk
industry. The riskiness of the industry increases
especially in economies with high inflation and
uncertainty like Turkey. The profitability performance of the banks under these conditions become more important in order to protect themselves against possible losses as well as to protect the depositors of the banks. Only the
banks, who beat the high inflation with the profitability
level can provide a strong financial structure and
undertake high risks. However, the standstill of Turkish Banks seem to be the converse of this situation.
The most significant characteristic of the Turkish
banking sector in 1989 has been the overliquidity
position of the banks. The commercial banks limited the creation of new liquidity by lowering the interest rates on deposits while heavily investing in government bonds
and treasury bills or offering their funds in the
interbank money to dissolve the already existing
liquidity. [8]
The change in the foreign exchange rate policy
constituted another aspect of the restructuring in the funding strategies and the investment strategies as well.
Another major subject that has been frequently brought in 1989 was the introduction of the standard "risk-asset ratio" in evaluating capital adequacy.
Despite the banks' continuous attempts to develop new asset liability management strategies to overcome the deficiencies of the external environment, the increasing competition in the sector forced the fees and commissions income to deteriorate, to which the banks have reacted by diversifying their service portfolio and increasing their service supply.[3]
The high nominal interest rates on deposits increased the
cost pressure on banks and banks' credit customers.
income relative to their interest expenses showed a declining trend in 1989. [43]
By the beginning of 1990 the Central Bank, reregulated
the structure of discount facility as the maturity of
rediscount credits were unified from medium and short terms to the short term for up to 92 days. [43]
Starting in August 1989, foreign exchange operations and
international capital movements were liberalized
entirely. All of the necessary conditions were fulfilled
for the convertibility of Turkish Lira. Thus, Turkish
Lira was declared convertible in February 1990. [43]
In 1990, the increasing competition in the system forced
the majority of the banks to operate with fairly low
profit margins. 1990 differed from 1989 due to an upward trend in economic activities, which in turn stimulated
the demand for loans, and due to an increase in the
interbank rates, stopping the possibility of cheap
funding in interbank money market. The rise in lending activities is expected to reduce the over-liquidity of the banking system. [3]
2.2.2.Bank management in Turkey
Turkish banks have undergone a major change of approach towards bank management in the last decade. To achieve a competitive standing in the international markets, banks
started to use new banking techniques along with
introducing new financial services. Commercial banks
began offering advisory services such as investment
consultancy to clients. Today, the banks emphasize sound
fund management, rational credit analysis,
diversification of loan portfolios and realistic price policies.[38]
The significance of traditional deposit money banking is replaced by emphasis on 'servicing the client', which is becoming the dominant trend among bankers. Consequently, the fees and commissions gained through banking services have now become major contributors to total income of banks.[39]
2.2.3. Developments In Branch Numbers
In the Table 3 the number of branches and number of employees of Turkish banks in 1990 are given.
Banks Group s N . o f Branch N . o f Employe
Commercial Banks 6 ,5 2 3 1 5 1 , 9 8 2 . S t a t e - o w n e d Banks 2 , 9 6 7 8 0 ,8 2 5 . P r i v a t e Banks 3 , 4 4 3 6 8 , 1 4 5 . F o r e i g n Banks 1 1 3 3 , 1 0 2 . F o u n d e d i n T u r k e y 86 2 ,0 2 8 .B ra n c h e s o f F o r e i g n Banks 2 7 984
Deve lo pm ent and I n v e s t m . Banks 1 7 2 , 1 0 7
.S t a t e - o w n e d Banks 7 1 , 4 2 1
. P r i v a t e Banks 7 600
. F o r e i g n Banks 3 86
T o t a l 6 .5 4 0 1 5 4 .0 8 9
As cost control becomes a vital aspect in bank management, measures have been taken to deal with it effectively. Although the branch network of Turkish banks is still extensive, there is a tendency towards avoiding
the costs associated with establishing new branch
offices, the rate of which is slowing down. Currently, banks in Turkey employ more than 154,000 people in over
6,500 branches.[38]
2.2.4. Developments in Deposits
Deposits represent the most important item among banks' external resources. With the increase of banks deposit rates in 1980 and the transition to a policy of effective positive interest rates, deposits developed rapidly. The ratio of the deposits to the GNP (0.17 in 1980) increased to 0.25 in 1988. During the five years between 1983 and 1988, consolidated deposit increase approximately seven fold. However, the increase in total deposits remained below the increase in banks' assets, and thus the 55.3% ratio of deposits to assets in 1983 declined to 54.8% in 1988. [41]
When deposits are examined on the basis of term, it can be seen that at the end of 1988, 37.1% of all deposits were in demand accounts. Of fixed-term deposits, 11.9% were for one month, 23.1% were fore three months, 17.4% for six months, and 47.6% for one year. Savings deposits accounted for 36.4% of all deposits, and of these, 86.5% were in fixed-term accounts. [41]
During recent years foreign exchange holding accounts have shown a noteworthy increase in total deposits: in
1984 the share of such accounts in total deposits was only 8.8% ; by 1988, they had risen to 24.5%.
Although there is keen competition among all kinds of banks, it is still difficult to observe a comparable degree of competition in the market for deposits. In the case of deposits in Turkey, there has been a radical change in the form of competition but not in the degree of competition. The liberalization of the interest rates enabled banks to shift from non-price competition to price competition. This is an important step from a welfare standpoint because non-price competition induces real resource costs while price competition does not.
[44]
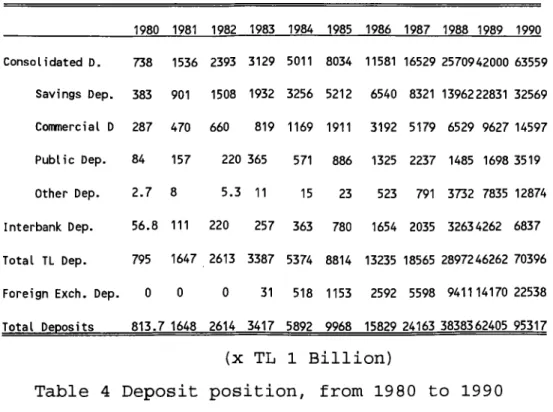
In Tables 4 and 5 , the bank deposit situation between
1983 to 1988, and the distribution of deposits by type
and bank group in 1988 are given respectively. The
figures are taken from Banks Association of Turkey. [41]
1980 1981 1982 1983 1984 1985 1986 1 9 8 7 1988 1989 1990 C o n s o l i d a t e d D . 738 1536 2393 312 9 5011 8034 11581 16529 2570942 000 63559 S a v i n g s D e p . 383 901 1508 1932 3256 52 12 6540 8321 1396222831 32569 Commercial D 2 8 7 4 70 660 81 9 11 6 9 19 11 3192 5 1 7 9 6529 962 7 14 5 9 7 P u b l i c D e p . 84 1 5 7 220 365 571 886 1325 22 37 1485 1698 3519 O t h e r D e p . 2 . 7 8 5 . 3 11 15 23 523 791 373 2 7835 12 8 74 I n t e r b a n k D e p . 5 6 .8 1 1 1 220 2 5 7 363 780 1654 2035 32634262 6837 T o t a l T L D e p . 795 1 6 4 7 2613 3 387 5374 8814 13235 18565 289 72 46262 70396 F o r e i g n E x c h . D e p . 0 0 0 31 518 1153 2592 5598 9 4 1 1 1 4 1 7 0 22538 T o t a l D e p o s i t s 8 1 3 . 7 1648 2614 3 4 1 7 5892 9968 15829 24163 3838362405 9 5 3 1 7 (x TL 1 Billion)
Share of Public Private Forei. Banks____Banks____ Banks Savings Deposits 36.4 38.6 59.3 2.1 Commercial Dep. 17.0 39.9 57.6 2.5 Public Dep. 3.9 98.4 1.6 -Other Dep. 9.7 84.1 15.5 0.4 Interbank Dep. 8.5 22.3 60.1 17.6
Foreign Exch. Dep. 24.5 35.6 59.9 4.5
Total Deposits 100 43.4 52.7 3.8
(As percentages)
Table 5 Distribution of deposits by type and bank group [38]
CHAPTER III. BACKGROUND OF BANK MARKET STUDIES
3.1. Studies in General
The empirical studies designed to provide on how market
structure influences the performance of depository
institutions, are divided into two groups. Those in one
group estimate the relation between measures of
commercial bank market structure and performance. Other
studies estimate the cost structure of the banking
industry where the cost studies are designed to determine whether the type of market structure that is conducive to
competitive pricing of banking services is also
consistent with efficient production of banking services. [16]
The bank market structure studies apply the structure- performance hypothesis to the banking industry. According to this hypothesis, the degree of competition among firms in a market is influenced by the degree of concentration of their output among a few relatively large firms, because a more highly concentrated market structure is assumed to be conducive to more effective collusion.· This hypothesis is tested by estimating measures of bank performance as functions of the concentration of deposits
among banks in local market areas. The measure of
performance, used as indicators of the degree of
competition among banks , include bank profit rates,
interest rates banks charge on loans, and interest rates
The bank market structure studies devote little space to
discussing the theoretical justification for the
equations that are estimated. They generally argue that :
economic theory indicates that market structure
influences the degree of competition among firms in a
market, the structure-performance hypothesis has been
used to analyze competitive performance of firms in other industries, and that framework is being applied to the banking industry. [16]
An important determinant of bank performance that is not discussed in most of these studies is, regulation. Since the theoretical foundation of the bank market structure literature does not incorporate explicitly the effects of regulations, it is not possible to determine from this literature whether changes in regulations strengthen or weaken the structure-performance relationship. There is reason to believe, however, that changes in regulations do affect the relationship. [16]
Within the past ten years, new perspectives on industrial
organization have been developed that challenge the
validity and usefulness of the structure-performance
framework for analyzing the determinants of competitive behavior. Only a few recent studies of bank competition incorporate these innovations. Thus, most of the studies
in the bank market structure literature have not
attempted to determine whether the new challenges to the
structure-performance framework are relevant for
analyzing competition in the banking industry.
One challenge to the structure-performance hypothesis has been raised by some authors, argues that a positive
relation between profit rates and concentration may
reflect differential efficiency of the largest and
smaller firms in various markets, rather than necessarily
reflecting more effective collusion in the more
concentrated markets.[16]
Several studies find some empirical support for the differential efficiency hypothesis. They find that the market share of a bank dominates the concentration ratio of its market area as a determinant of the bank's profit
rate. Some studies finds a positive, statistically
significant relationship between market concentration and the difference between profit rates of the relatively
large and smaller banks in the same market areas-
extended this analysis that support this differential efficiency hypothesis as an explanation for a strong
relationship between bank profit rates and
concentration.[16]
Several studies, indicate that variations in barriers to entry among market areas are significant in explaining bank performance like Hannan (1979b) who finds that the number of relatively large banks that could establish branches in a market area, but have not yet done so, helps explain the interest rates paid on savings deposits by commercial banks.[16]
Results of the bank market structure studies do not consistently support or reject the hypotheses that market
concentration influences bank performance. The
significance of the correlation between performance and concentration is hard to interpret that it reflects a causal influence of concentration on performance, as it
must if it is to be of policy relevance. However, some authors find significant results that concentration in European banking market lowers the cost of collusion between firms and results in higher than normal profits
for all market participants.[27]
The operating performance of a bank is usually measured by using accounting and financial ratios such as return on assets, and return on investments or similar ratios.
These ratios of course provide a great deal of
information about a bank's financial performance when
compared with prior periods and with other bank's
performance. There are however shortcomings of these
measures. One is that financial ratios fail to consider
the value of management's actions and investment
decisions that will affect future as opposed to current performance. In other words, financial ratios are short term measures and therefore may not be appropriate to reflect the real performance of a bank in the long run.
Some authors states that, a bank may be performing well
even if it is poorly managed on certain of these
dimension as long as it compensates by performing
particularly well on another dimension. A limitation is
that financial ratios aggregate many aspects of
performance such as operations, marketing and finance. Despite these facts, properly selected financial ratios still preserve their explanatory behavior and commonly used in bank market studies. [31]
In some studies, the authors pulled out the determinants of the commercial bank profitability. Management effects,
differences in bank management objectives, policies, decisions and actions reflected in differences in bank operating relationships, including profitability.
Some authors use practical approaches to the complex, interactive nature of bank performance studies in that
they disaggregate the commercial bank profitability,
which they define as a system of interrelationships, into key operational variables. There are studies showing the significant differences in profitability among member
banks of Federal Reserve Board and the variables
importantly affecting relative profitability. One of them concludes that management performance has significant influence on relative profitability, however, it is not solely responsible for differences in bank profitability.
[18]
The impact of management decision making on selected measures and relative bank profitability has been the subject in some studies. One of them deduces that the management of international banking is important in an
absolute sense to maximization of bank shareholders
wealth in these banks. It also shows the significant
association of selected ratios with relative
profitability. Again another one deduces the same result that any differences in levels of profitability should reflect differences in decision making affecting the relative proportion of international banking activities.
[19,20]
Another important factor influencing the bank
profitability is ownership, which is considered as a
bank's access to skilled personnel and other managerial
resources, access to favorable financial resources,
possession of widespread and efficient networks,
accumulated knowledge and experience in operations,
expertise in servicing the banking needs of particular
customer groups, and established credit-worthiness in
commercial banking circles are typical sources of
ownership-specific advantages of commercial banks. [9]
One important feature of ownership-specific advantages is a bank's ability to differentiate its banking products.
Product differentiation can result from superior
marketing techniques, research and development,
accumulated commercial information on particular markets and customer groups and a bank's prestige.
3.2. Bank Market Studies In Turkish Literature
Many studies have been realized in this area by Turkish authors in parallel with the world literature. In one of these studies, the relationship between market structure
and bank profitability in Turkey is analyzed. Their
results strongly support the predictions of the
structure-performance hypothesis, which argues that
market structure is one of the most important factors
that determine profitability and show the positive
relationship between bank profits and market
concentration in Turkey. On the other hand they have not been able to find any evidence on the validity of efficient structure paradigm, which suggests that market concentration might be due to superior efficiency, rather than some form of market power. [11]
Another author assesses important results about financial characteristics, efficiency and competitive structure of Turkish banking system. By the use of financial ratios and some risk variables he modelled bank profitability. He not only shows that traditional risk measures are
inversely related with profitability, but finds a
positive relation between foreign exchange risk and profitability as well. By developing a model of interest margin which explains spread through exogenous factors such as reserve and liquidity requirements, credit demand and inflation, he finds that inflation and credit demand positively affect the spread. Another interesting finding of this study is that new entry of foreign and Turkish
banks into the system does not improve competition
remarkably. [5]
On the other hand, there are studies investigating the
impact of interest rates on commercial bank
profitability. An author uses Flannery's (1981) model to
test the impact of rising interest rates on the
profitability of Turkish banks. However he cannot find evidence for higher profits in times of rising interest rates. Again on author investigates the interest, rate exposure of Turkish banks and examines their impact on bank profitability. He argues that income risk is the
relevant risk concept for Turkish commercial banks,
because asset and liability matures are rather short. [4]
A different approach to commercial bank profitability is measuring and evaluating the operating efficiency of bank branches. Some authors attempt to position the branches in terms of their efficiencies and also to gain insight
into the nature of operations so that managerial measures can be taken to improve their performance. [9]
The main points of the bank market studies are briefly emphasized in this section. The studies of structure- performance relationship investigates the variables that describe the structure of a market and the implications of these variables to performance. In Turkish literature these studies generally consider the concentration levels among banks. However, there are many other variables that are necessary to describe the structure of the Turkish banking market. One should also consider the demand for financial services, the degree of actual and potential competition, the degree of specialization among banks, the nature of ownership, the control relations between
banks and other business enterprises, the degree of
government ownership and control, and the legal
environment surrounding the banking sector.
This study takes, the nature of ownership, the changes in legal environment surrounding the banking sector, the managerial decisions of banks and the deposit sizes of
the commercial banks as variables of bank market
structure of Turkey and analyzes the differential effects of these variables on commercial bank profitability and the operating relationships through which these effects are transmitted and relative profitability determined.
In the next chapter a methodology of the statistical analysis is developed and the differential effects of these variables on the Turkish commercial banks are tested by ANOVA analysis. In the following chapter the results of this analysis - the effects of these variables
on each of the operating relationships tested apart - are discussed and in the last chapter the findings of this study is summarized as a conclusion.
CHAPTER IV. METHODOLOGY
The main points of the framework of Haslem (1968) is expanded in the methodology driven here. He used the same kind of approach to explain the differential effects of
some selected variables on the commercial bank
profitability and the operating relationships through
which these effects are transmitted and relative
profitability determined in the member banks of Federal Reserve Board in United States.[18]
However, due to the differences of nature of bank markets
between Turkey and United States, and the changing
emphasis on financial concepts the two studies have many different views.
4.1. Data Collection
4.1.1. Source of Data
For the statistical analysis the data collected are a
cross-sectional aggregation of 40 operating ratios
computed for each bank for 1989 and 1990. The ratios' used in this study can be divided into four groups. There are 17 overall profitability, 6 liquidity, 6 asset quality,
11 capital adequacy ratios chosen as the operating
relationships in the study. These ratios are given below;
i.CAPITAL ADEQUACY RATIOS
CAPITAL EQUITY / RISKY ASSETS CAPITAL EQUITY / TOTAL ASSETS TOTAL LIABILITIES / CAPITAL EQUITY
PAID-IN CAPITAL / CAPITAL EQUITY
OPERATING CAPITAL / TOTAL LIABILITIES NET TOTAL LOANS / CAPITAL EQUITY
NET FIXED ASSETS AND PARTICIPATIONS / CAPITAL EQUITY OPERATING CAPITAL / TOTAL ASSETS -PARTICIPATIONS
NET FOREIGN ASSETS / CAPITAL EQUITY
TOTAL FOREIGN EXCHANGE AGREEMENTS / CAPITAL EQUITY TOTAL LOANS AND COMMITMENTS / CAPITAL EQUITY
ii. ASSET QUALITY RATIOS
NET OVER-DUE LOANS / TOTAL LOANS RISKY ASSETS / TOTAL ASSETS
NET OVER-DUE LOANS / TOTAL ASSETS
NET FIXED ASSETS AND PARTICIPATIONS / TOTAL ASSETS
TOT. ASSETS WITH FOREIGN CURRE. INCOME / TOTAL ASSETS
TOTAL ASSETS WITH TL INCOME / TOTAL ASSETS iii. PROFITABILITY RATIOS
NET PROFIT / CAPITAL EQUITY NET PROFIT / NUMBER OF BRANCHES TOTAL INCOME / TOTAL ASSETS
NET INTEREST INCOME / TOTAL ASSETS INTEREST INCOME / TOTAL ASSETS
INTEREST INCOME OF TOTAL LOANS / TOTAL LOANS INTEREST INCOME / TOTAL INCOME GENERATING ASSETS TOTAL EXPENSE /TOTAL INCOME
TOTAL INTEREST EXPENSE / TOTAL INTEREST INCOME PERSONNEL EXPENSES / TOTAL EXPENSE
INTEREST INCOME / TOTAL INCOME
TOT. INCOME FROM FOR. EXC. TRANSACT. / TOTAL INCOME NON-INTEREST EXPENSE / TOTAL ASSETS
TOTAL INTEREST EXPENSE / TOTAL ASSETS
TOTAL NON-INTEREST EXPENSE / TOTAL EXPENSES PERSONNEL EXPENSE / NUMBER OF EMPLOYEES TOTAL EXPENSES / TOTAL ASSETS
X V .LIQUIDITY RATIOS
LIQUID ASSETS / SHORT-TERM FOREIGN FUNDS CASH ASSETS AND BANKS / DEMAND DEPOSITS
SHORT-TERM SOURCES OF FUNDS / TOTAL LIABILITIES LIQUID ASSETS / TOTAL ASSETS
LIQUID ASSETS / TOTAL LIABILITIES AND NON-CASH LOANS TOTAL LOANS / TOTAL LIABILITIES
The sources for the ratios are the individual year-end balance sheets and profit and loss statements obtained from the annual publication of Banks Association of Turkey. The data belong to all banks - 56 Banks - which are members of Banks Association of Turkey consisting Private and Government owned commercial banks and Foreign commercial banks. The development and investment banks are excluded from the study. The number of banks in the Turkish Banking Industry became a limitation to this kind of study. It was impossible to drew a sample from the sector so the sample covers all of the member banks.
4.1.2. Method of Data Compilation
Since K*L*M and K*L*M*N factorial analyses are used in the study the data is organized in this way. The data used in the analysis are categorized in order to identify the effects of the selected variables. According to this approach the brief definitions of the factors that are expected to have impact on relative profitability are given below ;
Manacrement effects arise from the differences in bank
management strategies, objectives and the actions
reflected in the differences in bank operating
relationships. Because this study analyzes the nature of the commercial banking measures and relates them to
relative bank profitability, it takes as given that
commercial bank management is the most important, is an absolute sense to profitability. Net Income over Total Assets criteria is chosen to reflect the management
effects.
Stewardship effects represent the differences in the natural division of the Turkish banks where there exist a heterogeneity in this sector .
Time effects are the results of differences in the general economic environment, represented by changes over time.
Total deposits of the banks represent the size effects that are the results of the differences in the bank size.
Statistically, the study tests hypotheses that there are significant differences in commercial bank profitability arising from differences in specified variables. If the hypotheses are accepted the next hypotheses state that
these variables significantly affected operating
relationships which help to explain the profitability differences. The variables and the operating ratios used in the statistical analysis are chosen to clarify the nature of the Turkish Banking Industry.
In this study to see the stewardship effects, the natural division due to ownerships of Turkish banks are used. The banks are grouped into three :
Group 1: It consists the state-owned commercial banks. In
the sector there are eight of this kind.
Group 2; This group is made up of the publicly owned
commercial banks of the sector. Twentyfive commercial banks who have been continued their services in both 1989 and 1990 meet this classification
Group 3: The banks which are either partly owned by, or
are branches of foreign banks are put in this group. There are 23 banks in this group.
The categorization of the banks due to their ownerships are given in Appendix A. There are 8 cells covering state-owned banks and therefore one bank falls in each cell. Three Turkish private commercial banks fall in the first seven cells in the second group and four banks belong to the 8th cell of this group. In the last group three banks fall in each of the first seven cells and two for the last cell.
After the banks in each stewardship group were
categorized by total deposits ( size ) , they were ranked
by profitability and divided into two groups according to
relative profitability. The size-group categories are
divided into 4. Therefore 24 cells appeared for the means and variances in each year. Due to this categorization of data minimum two banks are desired in each cell, however due to the nature of the Turkish banks there is only one
bank in some of the cells. Unweighted arithmetic means and variances are then computed for each of the ratios for the population of banks in each profitability group.
Also overall unweighted means and variances of the
operating ratios are computed for every deposit size group.
The table given below summarizes the categorization used in the first part of the analysis ;
Stewardship Effects 1 2 3 State-owned X(OOO) X(OIO) X(020) X(OOl) X(Oll) X(021) X(IOO) X(llO) X(120) X(lOl) X(lll) X(121) X(200) X(210) X(220) X(201) X(211) X(221) X(300) X(310) X(320) X(301) X(311) X(321) Table 6
In the table X(ijk) denotes the mean of the one of the 40 operating ratios where the subscripts:
i = 0,..,3 denotes one of the size effects groups
j = 0,1,2 denotes one of the stewardship groups
k = 0,1 denotes one of the management effect groups
Therefore the data are prepared for a 4*3*2 factorial
analysis where the are four size groups, three
Categorization of the relevant data for the second part is given in the table below;
Stewardship Effects State-owned X(OOOO) X(OIOO) X(0200) X(OOIO) X(OllO) X(0210) X(IOOO) - X(llOO) X(1200) X(IOIO) X(lllO) X(1210) X(2000) X(2100) X(2200) X(2010) X(2110) X(2210) X(3000) X(3100) X(3200) X(3010) X(3110) X(3210) X(OOOl) X(OIOI) X(0201) XiOOll) X(Olll) X(0211) X(lOOl) X(llOl) X(1201) XilOll) X(llll) X(1211) X(2001) X(2101) X(2201) X(2011) X(2111) X(2211) X(3001) X(3101) X(3201) X(3011) X(3111) X(3111) Table 7
In the table X(ijkl) denotes the mean of the one of the 40 operating ratios where the subscripts:
i = 0,..,3 denotes one of the size effects groups
j = 0,1,2 denotes one of the stewardship groups
k = 0,1 denotes one of the management effect groups
1 = 0,1 denotes one of the year groups
In the second part of the analysis, in order to test environmental effects (time effects) the categorization
statistical model has been tested because of the entrance of the new factor, namely time effects factor.The main
time effects and the interactions appeared by the
addition of the new factor is tested a four-factorial Analysis of Variance application. In this categorization there existed 48 cells for the analysis providing a 4*3*2*2 factorial analysis that is applied in the second part.
In this study the ratio of net income after taxes to total capital accounts (NI/TA) is selected to rank the
banks in each size group and place them in the
appropriate profitability groups. NI/TA is selected
because it is accepted as the 'bottom line' measure of
bank performance under the constrained control of
management. [19 ]
The other variables include 40 meaningful ratios from the data for which there are sufficient observations. About
the variables selected for testing, they cannot be
divided into more basic explanatory variables due to the small number of Turkish banks as a population.
4.2. Methodology of the Statistical Analysis
4.2.1. The nature of Factorial Analysis of Variance
In factorial analysis of variance two or more independent variables vary independently or interact with each other to produce variation in a dependent variable. Factorial analysis of variance is the statistical method that
analyses the independent and interactive effects of two or more independent variables on a dependent variable.
Factorial analysis enables the researcher to manipulate and control two or more variables simultaneously. In the analyses the variables that are not manipulated can be controlled. Another advantage of the factorial analysis
is that it is more precise than one-way analysis. The
final advantage - and, from a large scientific view
point, perhaps the most important one - is the study of
the interactive effects of independent variables on
dependent variables.
In this study, in the first part of the analysis a three- factorial analysis of variance for the fixed effects model is applied to the case and in the second part a
four-factorial analysis of variance for the fixed effects
model is applied. A statistical computer package is
utilized for performing the needed calculations for these multifactor studies involving three and four factors. As the designs are balanced the ANOVA procedures of the
SAS/STAT Software is used to overcome the possible
problems that can be faced during the statistical
computations about analysis of variance. However, for
completeness the necessary computational formulas for three factor studies, the detailed notations are given in Appendix C.
Table 5 contains the appropriate test statistics and
percentiles of the F distribution for the various
possible tests for the three factor study used in the study.
The hypotheses are tested statistically by analysis of
variance. An analysis of variance model for this
multifactor investigation was utilized to determine
whether the effects of these independent variables
interact in important ways and which one of the
independent variables shows the greatest statistical
relation to the dependent variable.
Alternatives Test Statistic Percentile___________
Horalla^ =0 F=MSM/MSE Ha:not all =0 Ho:all =0 F=MSS/MSE Ha:not all =0 vJ F[l-a;a-l, (n-l)abc] F[l- a;b-l, (n-l)abc] Ho:all =0 F=MS0/MSE Ha:not all =0 F[l-a;c-l, (n-l)abc]
Ho:all =0 F=MSM0/MSE F [1-a;(a-1 ) (b-1 ) , {n-1)abc]
Ha:not all a/3 =0
Ho:all <xy =0 F=MSS0/MSE F[l-a; (a-1) (c-1) , (n-l)abc]
Ha:not all ay =0
Ho:all(3r=0 F=MSMS/MSE F [1-a; (c-1) (b-1) , (n-1) abc]
Ha:not all =0
Ho:alla/3y=0 F=MSABC/MSE F [1- a ; (a-1) (c-1) (b-1) , (n-1)
;abc ]
Ha:not alla^y=*^
The model used is a fixed effects model and while testing the hypotheses several models were defined. Fixed effect model seemed appropriate for this study since the factor levels are chosen because of intrinsic interest in them and they are not considered as a sample from a larger population. Each model contains explanatory variables, called an effect, selected from those hypothesized as affecting operating ratio results.
In the first part of the analysis the following
statistical model was built up to test the data;
Model 1. for Management. Size and Stewardship effects:
X Jk
In this model;
X denotes the mean value of one of the cells for one of the operating ratios represented in the data format for the given year.
M is the proxy variable that is the coefficient
reflecting the effects of a particular profitability groups on one of the operating ratios. The subscript i represents one of the profitability groups. In terns of testing the null hypothesis of no significant management effects on the value of one of the operating ratios, the
significance of the partial correlation between the
profitability quadrilles and the ratio value was tested.
S is the coefficient reflecting the effects of a
particular deposit size on the value of one of the operating ratios. The subscript j represents one of the
deposit groups. In teirms of testing the null hypothesis of no significant size effects on the value of one of the
operating ratios, the significance of the partial
correlation between the size groups and the ratio value was tested.
0 is the coefficient reflecting the effects of a
particular stewardship category on the value of one of the operating ratios. The subscript k represents one of
the stewardship categories. In terms of the null
hypothesis of no significant stewardship effects on the value of one of the operating ratios, the significance of the partial correlation between branch number categories and the ratio value was tested.
(MO) is the first- order interaction coefficient put
into model to reflect whether the difference in ■ mean
responses for levels of management effects factor is not constant across the levels of the stewardship effects factor.
(SM) is the first- order interaction coefficient put
into model to reflect if the difference in mean responses for levels of size effects factor is not constant across the levels of the management effects factor.
(SO) is the first- order interaction coefficient put
into model to reflect if the difference in mean responses for levels of size effects factor is not constant across the levels of the stewardship effects factor.
(MSO) is the second- order interaction coefficient put
size effects, stewardship effects and management effects factor.
In order to test the time effects a fourth factor added to the statistical model given above and the model used for the second part became ;
Model 2, for Time effects
X = Ho t M, + S j . + (M0).|o + (SM) .. ♦ (SO)jio t ( Y S ) „ , mj (OY) km (MVSO). t c . Ijkm Ijkm
In this model the explanations for the coefficients· that appear in the first model are valid. New main, two-way- interactions, three-way interactions effects are added to the first model.
Ym is the coefficient reflecting the effects of a
particular year on the value of one of the operating ratios. The subscript m represents one of the years 1989 or 1990. In terms of testing the null hypothesis of no significant time effects on the value of one of the
operating ratios, the significance of the partial
correlation between the years and the ratio value was tested.
(YM) is the first- order interaction coefficient put
into model to reflect if the difference in mean responses for levels of year effects factor is not constant across the levels of the management effects factor.
(SY) is the first- order interaction coefficient put
for levels of size effects factor is not constant across the levels of the year effects factor.
(YO) is the first- order interaction coefficient put
into model to reflect if the difference in mean responses for levels of year effects factor is not constant across the levels of the stewardship effects factor.
(OYS) , (MYS) and (MYO) are the second- order interaction
coefficients put into model to reflecting the triple
interaction between year effects, size effects,
stewardship effects and management effects factor.
4.3. Analysis and Results
In the first part of the analysis the hypotheses that there are significant differences in Turkish commercial banks' profitability arising from the specified variables
are statistically tested. Three-factorial analysis of
variance is applied the data under consideration. The categorization of this data is given in Table 6.
The null hypotheses - that are explained in section 4.1.2 are rejected and it is accepted that management, stewardship and deposit size have significant influence on relative profitability. Also, it is shown that these
variables have significant impact on the operating
relationships through which these influences are
transmitted. The main effects and the interaction effects
of the factors on the selected 17 profitability, 6
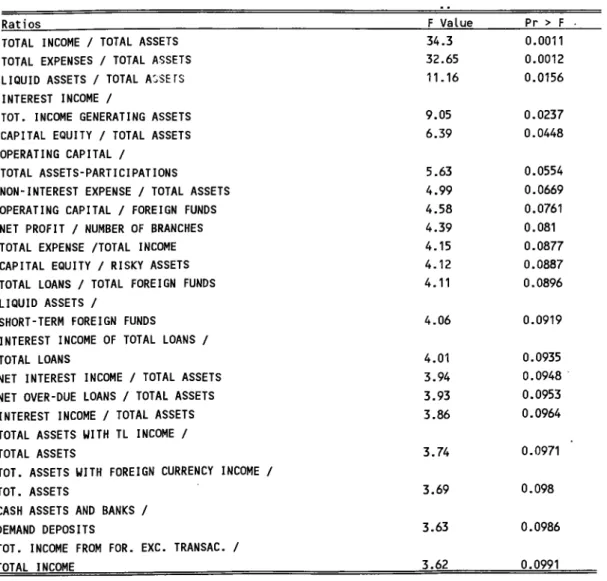
liquidity, 6 asset quality, 11 capital adequacy, total of 40 operating ratios are tested. All of the F test results for the tested model are given in Appendix-B.
An expected and important finding is the significant effects of the management on the operating relationships. The F values for the half of ratios under test, rejected the null hypotheses of no significant management effects
differences. That is to say there are significant
management effects on 20 out of 40 operating
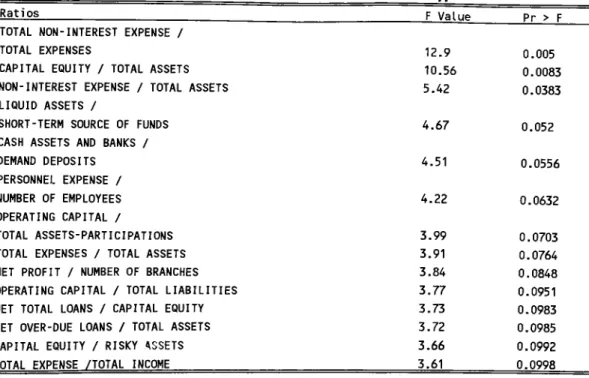
relationships. However, it is found that management is not the only factor effecting relative profitability ; The ratios significantly affected by management are given in the Table 9. 23 of the operating relationships are significantly affected by the stewardship factor showing
that these critical financial relationships are also
affected by the ownership structure of the banks.
R a t i o s F V a l u e P r > F . T O T A L INCOME / T O T A L ASSE TS 3 4 . 3 0 . 0 0 1 1 T O T A L E X P E N S E S / T O T A L ASSE TS 3 2 .6 5 0 . 0 0 1 2 L I Q U I D AS SE TS / TO TA L ASSETS 1 1 . 1 6 0 . 0 1 5 6 IN T E R E S T INCOME / T O T . INCOME G E N E R A T IN G ASSE TS 9 .0 5 0 . 0 2 3 7 C A P I T A L E Q U I T Y / T O T A L ASSETS 6 . 3 9 0 .0 4 4 8 O P E R A T IN G C A P I T A L / T O T A L A S S E T S - P A R T I C I P A T I O N S 5 .6 3 0.0 55 4 N O N - I N T E R E S T E X P E N S E / TO TA L ASSETS 4 . 9 9 0.0 6 6 9 O P E R A T IN G C A P I T A L / F O R E IG N FUNDS 4 . 5 8 0 . 0 7 6 1 NE T P R O F I T / NUMBER O F BRANCHES 4 . 3 9 0 .0 8 1 T O T A L E X P E N S E / T O T A L INCOME 4 . 1 5 0 . 0 8 7 7 C A P I T A L E Q U I T Y / R IS K Y ASSE TS 4 . 1 2 0 . 0 8 8 7 TO TA L LOANS / TO TA L F O RE IG N FUNDS 4 . 1 1 0.0 8 9 6 L I Q U I D A S SE T S / SHORT-TERM F O R E IG N FUNDS 4 . 0 6 0 .0 9 1 9 I N T E R E S T INCOME OF T O T A L LOANS / T O T A L LOANS 4 . 0 1 0.0935 NE T I N T E R E S T INCOME / T O T A L A S SE TS 3 .9 4 0 .0 9 4 8 NET O V E R -D U E LOANS / T O T A L A S SE TS 3 .9 3 0 .0 953 IN T E R E S T INCOME / T O T A L A S SE TS 3 .8 6 0 .0 9 6 4 TO TA L A S SE T S WITH T L INCOME / T O T A L A S SE TS 3 . 7 4 0 . 0 9 7 1
T O T . A S S E T S WITH F O R E IG N CURRENCY INCOME /
T O T . A S SE TS 3 .6 9 0 .0 9 8
CASH A S SE T S AND BANKS /
DEMAND D E P O S I T S 3 .6 3 0 .0 9 8 6
T O T . INCOME FROM F O R . E X C . TRANSAC. /
T O T A L INCOME 3 .6 2 0 .0 9 9 1
![Table 1 General Financial Developments in Turkey (1980 - 1990 ) [40]](https://thumb-eu.123doks.com/thumbv2/9libnet/5992224.125885/19.920.146.634.100.512/table-general-financial-developments-turkey.webp)
![Table 3 Number of Branches and Employees in 1990 [40]](https://thumb-eu.123doks.com/thumbv2/9libnet/5992224.125885/25.920.138.745.640.1046/table-number-branches-employees.webp)
![Table 5 Distribution of deposits by type and bank group [38]](https://thumb-eu.123doks.com/thumbv2/9libnet/5992224.125885/28.920.144.760.150.447/table-distribution-deposits-type-bank-group.webp)