GENETIC ANALYSIS OF SMAD4 GENE IN TGF-p SIGNALLING
PATHWAY IN HUMAN LIVER CANCER
A THESIS
SUBMITTED TO THE DEPARTMENT OF MOLECULAR BIOLOGY
AND GENETICS
AND THE INSTITUTE OF ENGINEERING AND SCIENCE
OF BILKENT UNIVERSITY
IN PARTIAL FULFILLMENT OF THE REQUIREMENTS
FOR THE DEGREE OF
MASTER OF SCIENCE
/B98
meliha
burcu
îrmal
GENETIC ANALYSIS OF SMAD4 GENE IN TGF-p SIGNALLING
PATHWAY IN HUMAN LIVER CANCER
A THESIS
SUBMITTED TO THE DEPARTMENT OF MOLECULAR BIOLOGY
AND GENETICS
AND THE INSTITUTE OF ENGINEERING AND SCIENCE
OF BILKENT UNIVERSITY
IN PARTIAL FULFILLMENT OF THE REQUIREMENTS
FOR THE DEGREE OF
MASTER OF SCIENCE
By
MELİHA BURCU IRMAK
JULY, 1998
J ?
^908
С 4 3 2 0 2
M.Burcu Irmak
I certify that I read this thesis and that in my opinion it is fully adequate, in scope and in quality, as thesis for the degree of Master of Science.
I certify that I read this thesis and that in my opinion it is fully adequate, in scope and in quality, as thesis for the degree of Master of Science.
Prof. Dr. Mehmet Oztürk
I certify that I read this thesis and that in my opinion it is fully adequate, in scope and in quality, as thesis for the degree of Master of Science.
Approved for Institute of Engineering and Science.
Prof Dr. Mehmet Bara)
ABSTRACT
GENETIC ANALYSIS OF SMAD4 GENE IN TGF-p SIGNALLING
PATHWAY IN HUMAN LIVER CANCER
Meliha Burcu Irniak
M.S. in Molecular Biology and Genetics
Advisor: Dr. M. Cengiz Yakicier
July, 1998
HCC is a multistep genetic disease in which many genomic changes occur as a result of uncontrolled proliferation of hepatocytes. Molecular events leading to HCC is still unclear. Until now, neither an oncogene nor a tumor suppressor gene has been shown to be prefentially altered in HCC. Genetic alterations other than p53, pl6, BRCA2 (Breast Carcinoma Associated Protein), M6P/IGFIIR (lyiannose 6 Phosphate/ Insulin Like Growth Factor II Receptor), Rb (Retinoblastoma), PRLTS (Platelet Derived Growth Factor Receptor-|3-Like Tumor Suppressor Gene), and Tg737 (Candidate polycyctic kidney disease gene) genes remain unknown. TGF-P is a strong inhibitor of hepatocyte proliferation. In HCC and cirrhosis increased levels of TGF-P is observed, so this shows that the presence of high levels of TGF-3 does not avoid hepatocyte proliferation. Thus, there may be a disruption in the signalling pathway of TGF-p. The common mediator Smad4 gene, which is among the genes located in TGF-P signalling pathway, is found to be mutated in many cancer types. We decided to do the mutational analysis of Smad4 gene, which is located in the signalling pathway of the hepatocyte antiproliferative factor, TGF-p. Exons 8, 9, 10, and 11 which are in MH2 region, and exon 2 which is in MHl region of Smad4 is mutationally analysed by SSCP for 35 HCC cases. In the 35 HCC tumors, 5 alterations were observed (14%), 3 of them being in exon 8, one of them being in exon 9a, and the last one being in exon 10 of Smad4 gene. In the samples we tested, no big deletions were observed, but the alterations observed are probably single base changes. Also HCC cell lines namely, HepG2, Hep3B, Huh-7, FOCUS, Mahlavu, and PLC/PRF/5 were checked for their mutations and cell lines other then PLC/PRF/5 were analysed for their mRNA transcription. There were no big deletions or alterations in N- and C- terminals of the cell lines and we have shown mRNA transcription for all cell lines except Hep3B in which PCR has revealed very weak amplification. Our results suggest that Smad4 might be involved in at least a part of primary HCC tumor development. Key words; HCC, TGF-3, Mutation, Smad4, Cell line, SSCP, PCR.
ÖZET
TGF-P SİNYAL YOLUNDA YER ALAN SMAD4 GENİNİN İNSAN
KARACİĞER KANSERİNDE GENETİK ANALİZİ
Meliha Burcu Irmak
Moleküler Biyoloji ve Genetik Bölümü Yüksek Lisans
Tez Yöneticisi: Dr. M. Cengiz Yakıcıer
Temmuz, 1998
Hepatosellüler karsinoma, hepatositlerin kontrolsüz çoğalması sonucu, değişik genetik bozukluklann birikmesiyle oluşan çok basamaklı bir hastalıktır. Hepatosellüler karsinomaya yol açan moleküler olaylar henüz bilinmemektedir. Bu güne kadar, ne belli bir onkogenin, ne de tümör baskılayıcı genin, HCC’ye neden olduğu gösterilememiştir. HCC vakalarında p53, pl6, BRCA2, M6P/IGFIIR, Rb, PRLTS, ve Tg737 genlerinde gösterilen mutasyonlann dışında gen bozukluklan hala bilinmemektedir. TGF-P, hepatosit çoğalmasını önleyici çok güçlü bir moleküldür. Hepatosellüler karsinoma ve siroz sırasında TGF-3 seviyesinde artma gözlenmiştir, buna rağmen hepatositler çoğalmaya devam etmiştir. Bu sebeple, karaciğer kanserlerinde TGF-P sinyal yolunda bir bozukluk olabileceği düşünülebilir. TGF-P sinyal yolunda yer alan genlerin arasında bulunan, ortak aracı, Smad4 geninin çeşitli kanser tiplerinde mute olduğu bulunmuştur. Biz de, hepatosit çoğalmasını engelleyici bir faktör olan TGF-P’nm sinyal yolunda yer alan Smad4 geninin mutasyon analizini yapmaya karar verdik. 35 HCC vakası için, SSCP analizi ile Smad4 geninin, mutasyonlann çok yoğun olduğu MH2 bölgesine denk gelen, kodlayan bölgeler 8, 9, 10, ve 11 ile MHl bölgesine denk gelen kodlayan bölge 2’nin mutasyonlan tarandı. 3 tanesi kodlayan bölge 8, 1 tanesi kodlayan bölge 9 ve sonuncusu da kodlayan bölge lO’da olmak üzere, 35 HCC vakasinda 5 tane (14%) değişiklik göründü. Test edilen örneklerde büyük delesyonlara rastlanmadı, ama görülen değişiklikler büyük bir ihtimalle tek baz değişiklikleridir. Bununla birlikte, HCC hücre hatlan olan, HepG2, Hep3B, FIuh7, FOCUS, Mahlavu, ve PLC/PRF/5 mutasyonları ve PLC/PRF/5 hariç diğer hücre hatlan mRNA transkripsiyonu için kontrol edildi. Hücre hatlanmn N- ve C- uçlarında büyük delesyon ve değişikliklere rastlanmadı, ve Hep3B dışında bütün hücre hatlanmn mRNA yazılımı gösterildi. Elde ettiğimiz sonuçlar Smad4 geninin en azından bazı HCC vakalarının gelişiminde rol oynayabileceğini düşündürmektedir.
Anahtar kelimeler: Hepatosellüler karsinoma, TGF-P, Mutasyon, Smad4, Hücre hattı, SSCP, PCR.
ACKNOWLEDGMENT
Special thanks to Dr. Cengiz Yakicier who has been advising me with his great knowledge, patience, and everlasting interest, and being helpful in any way during my graduate studies.
I am also greatfiil to my laboratory partner Alper Romano for his friendship and help during my research period.
It is my pleasure to express my thanks to Prof Mehmet Oztiirk for his suggestions when I needed, and to Ass. Prof Marie Riccardio, and Biologist Birsen Cevher for the sequencing experiments.
CONTENTS
I. Introduction
1.1. Hepatocellular Carcinoma
1.2. Genetics of Hepatocellular Carcinoma 1.3. Transforming Growth Factor-P
1.4. Transforming Growth Factor-P Signalling 1.5. Smads 1.6. Aim 1 3 5 6 9 15
1
II. Materials and Methods II. 1. Materials
II. 1.1. Samples II. 1.2. Solutions II.2. Methods
11.2.1. Polymerase Chain Reaction 11.2.1.1. Procedure
11.2.2. Single Stranded Conformation Polymorphism Analysis 11.2.2.1. Procedure
11.2.3. Polyacrylamide Gel Electrophoresis 11.2.3.1. Procedure 11.2.4. Gel Drying 22 22 22 24 25 25 25 27 28 28 29 29 VII
11.2.5. Autoradiography
11.2.6. Restriction Enzyme Digestion
29 30 111. Results 31 IV. Discussion 39 Appendix A 47 References 49 VIII
LIST OF TABLES
Table 1.1: HCC Mutations
Table 1.2: Smad4 Mutations and Alterations in Tumors Table 1.3; Cell Line Mutations and Alterations of Smad4
Table 2.1: p53 Gene Mutations and HBV Status of 35 Tumor Samples
Table 2.2. The Origins, p53 Gene, and HCV Integration Status of the Cell Lines Table 2.3: The List of the Primers Used for Tumors
Table 2.4: The List of the cDNA Primers Table 2.5: Restriction Enzyme Cutting Sites
Table 3.1: SSCP Results of the Tumors for Smad4 Gene
LIST OF FIGURES
Figure 3.1: SSCP Analysis of p53 Gene Codon 248-249 Mutations Figure 3.2: SSCP Analysis of Exon 10 Tumor DNAs with No Alteration Figure 3.3: SSCP Analysis of Exon 8
Figure 3.4: SSCP Analysis of Exon 9a Figure 3.5: SSCP Analysis of Exon 10
ABBREVIATIONS
Ann APS Arg Bisacrylamide BMP bp BRCA2 CMC DDGE del DPC4 DNA dNTP Dpp EDTA E2F f Freq G HA HBV HCC HCV IGFII IGFIIR KD L LOH M MAD MADR MAP mCi MgCl2 MHl MH2 MI min ml mM mRNA M6P MTSI N-terminal Annealing Ammonium Persulphate Arginine N, N, methylene bis-acrylamide Bromephenol blue Base pairBreast Carcinoma Associated Protein 2 Chemical Mismatch Cleavage
Denaturing Gradient Gel Electrophoresis Deletion
Deleted in Pancreatic Carcinoma 4 Deoxyribonucleic Acid
Deoxynucleotide Triphosphate Drosophila gene decapentaplegenic Ethylene Diamine Tetra Acetic Acid Elongation Factor 2 Familial Frequency Glysine Heteroduplex Analysis Hepatitis B Virus Hepatocellular Carcinoma Hepatitis C Virus
Insuline-like Growth Factor II
Insuline-like Growth Factor II Receptor Kilodalton
Leucine
Loss of Heterozygosity Molar
Mother Against dpp
Mother Against dpp Related Mitogen Activated Protein Millicuri
Magnesium Chloride Mad Homology region 1 Mad Homology region 2 Microsatellite Instability Minute
Milliliter Millimolar
Messanger Ribonucleic Acid Mannose 6 Phosphate Multi Tumor Suppressor I Amino-terminal
P Proline
^^P-dATP Phosphate 33- deoxyadenosine three phosphate
PAGE Polyacrylamide Gel Electrophoresis
PCR Polymerase Chain Reaction
pmol picomol
PRLTS Platelet Derived Growth Factor Receptor-P-like
Xumor Suppressor Gene
P IT Protein Xruncation Xest
RB Retinoblastoma
RNA Ribonucleic Acid
S Serine
SAD Smad Activating Domain
sec Second
Ser Serine
Smad Sma and mad related
SSCP Single Stranded Conformation Polymorphism
STK Serine/Xhreonine Kinase
TAK-1 XGF-P Activated Kinase-1
TBE Xris-Boric acid-EDXA
temp Xemperature
TGF-p Xransforming Growth Factor-P
TGF-pl Xransforming Growth Factor-P 1
TGF-P2 Xransforming Growth Factor-P2
TGF-рЗ Xransforming Growth Factor-p3
Tg737 Candidate Polycystic Kidney Disease Gene
Thr Xhreonine
TSG Xumor Suppressor Gene
XPRI Xransforming Growth Factor-P Receptor I
XPRII Xransforming Growth Factor-P Receptor II
til Microliter
pM Micromolar
Pg Microgram
UV Ultraviolet
Chapter 1
L Introduction
I.l. Hepatocellular Carcinoma
Multiple cell types such as hepatocytes, bile duct epithelia, neuroendocrine, and mesodermal cells within the liver may cause primary hepatic tumors. However, the hepatocellular carcinomas (HCC) constitute the great majority of primary liver cancers which derive from hepatocytes. HCC is the 1^ most frequent cancer occurring worldwide. However, it is the 4‘*’ most common cause of death from cancer. The overall ratio of mortality to incidence is 99% because of its poor prognosis. When compared to other parts of the world, the incidence of HCC is significantly higher in Southern Africa and Southeast Asia. Like many adult tumors, HCC is a multistep disease in which many genomic changes occur as a result of uncontrolled proliferation of hepatocytes. Under normal physiological conditions, adult hepatocytes are nondividing cells. Infact, as a response to a minor cell loss due to aging or apoptosis (programmed cell death), only a minor fraction of hepatocytes appears to undergo cell division. During liver injury, substantial cell death can occur as a result of exposure to viral (i.e., hepatitis B virus,
hepatitis C virus), chemical (i.e., aflatoxin) or even cellular (i.e., iron or copper) factors. Liver injury provokes an increase in the proliferating fraction of hepatocytes. Chronic state of cell death and regeneration is probably the main source of genetic errors which lead to malignant transformation of hepatocytes and probably explains the big time lapse (10s of years) between the first exposure to étiologie factors and the clinical manifestation of HCC (Ding e/a/. 1991[1], Ôztürk 1994 [2], Wands ei a/. 1995 [3]).
Chronic hepatitis B virus (HBV) infection is the major etiology of hepatocellular carcinoma. The integration of viral sequences into the host genome is a relatively common event in HCC. However, viral integration is neither necessary nor sufficient for hepatocyte transformation. The genes coding for cyclin A (Wang et al. 1990 [4], 1992 [5]), and retinoic acid receptor (Dejean et al. 1986 [6]) which are involved in cellular proliferation and cellular differentiation respectively, are the two examples where HBV integration has interrupted the integrity of the genes. In addition to these two genes, the most recent HBV DNA integration characterized occurred in the cellular mevalonate kinase gene (Graef et al. 1994 [7], 1995 [8]) which is the key enzyme of cholestrol biosynthesis pathway, and is indirectly involved in the farnésylation of growth-related proteins like the ras oncoprotein. Overexpression of this gene may contribute to the dysrégulation of hepatocyte proliferation. These integrations are extremely rare and unique. Another hepatotrop virus, hepatitis C virus (HCV), antibodies and viral RNA have been also detected respectively in the serum and in the liver of the patients with HCC. In contrast to HBV, because of the fact that HCV is an RNA virus, insertion to
host genome is not a mechanism for HCV directed hepatocarcinogenesis (Ding et al. 1991 [1], Ôztürk 1994 [2], Wands étal. 1995 [3]).
1.2. Genetics of Hepatocellular Carcinoma
Even though increased expression (H-ras, myc, and IGF-II genes have been observed to be overexpressed in livers of mice, rats and woodchucks) and some mutations of several oncogenes (H-ras is mutated in 30-60% of the spontaneous HCC in B6CFI and C3H mice) are frequently observed in animals, in human HCC, no known oncogene has been shown to be consistently activated by a structural change (Grisham et al. 1996 [9]). However, c-myc (Arbuthnol et al. 1991 [10]), c-fos (Arbuthnol et al. 1991 [10]), cyclin D1 (Nishida et al. 1994 [11]), c-met (Boix et al. 1994 [12]), and retinoic acid receptor (Sever et al. 1991 [13]) genes has been shown to be amplified in a limited number of cases in human HCC.
The analysis of chromosomal changes in HCC permitted the identification of several loci deleted in HCC, the short arm of chromosome 17 (17pl3) being the most frequently deleted one which harbors the p53 gene. It was later reported that “the p53 gene is a frequent target in HCCs”. Most of the mutations clustered to a single hotspot and converted an arginine residue at codon 249 of the p53 gene to a serine residue. Worldwide, the presence of codon 249 mutation in HCC’s correlated with high risk of exposure to aflatoxins and HBV with high incidence in the countries such as Mozambique, Transkie, China, and Vietnam and with no incidence of codon 249
mutation in other locations such as North America, Europe, the Middle East, and Japan (Even though HBV infection is frequently seen in the Middle East and Japan) (Oztiirk 1994 [2]). Even though, p53 mutations are the most frequent genetic abnormalities observed in HCCs, tumors from low aflatoxin exposure areas show infrequent p53 mutations.
In addition to 17pl3, other chromosomal arms are found to display loss of heterozygosity (LOH) in more than 20% of HCCs studied (16p, 16q, 5p, 4q, Ip, 5q, 8q, 13q). Chromosomal deletions that occur at low frequency in HCCs (11 p, lOq, 14q, 17q, 4p, 15q) are random deletions which are not probably related to the progression of malignant transformation but related to the increased genomic instability of cancer cells (Ozturk 1994 [2], Grisham et al. 1996 [9]).
Recently, another frequently deleted region at the mannose 6-phosphate/insulin-like growth factor receptor II (M6P/IGF-IIR) locus located at chromosome 6q26-27 has been observed, and frequent mutations of this gene were published (Souza et al. 1995 [14]). LOH at the chromosome 9p21 (54%) has also been added to the list recently. However, multi tumor suppressor I/pl6 (MTSI/pl6) gene located at chromosome 9p21 was mutated infrequently in the samples tested (Hui et al. 1996 [15], Chaubert et al. 1997 [16], Qin et al. 1996 [17], Biden et al. 1996 [18]). In a study, it is also stated that, pl6 in HCC is inactivated predominantly by post-transcriptional regulation rather than by genomic aberrations and lack of transcription (Hui et al. 1996 [15]). Another tumor suppressor gene (TSG), breast cancer associated protein 2 (BRCA2) gene which is
located close to the retinoblastoma (RB) gene on chromosome 13q was also found to be mutated in HCCs. Two out of three mutations observed in BRCA2 gene were germline mutations (Katagiri et al. 1996 [19]). Also, Rb was shown to have tumor specific small deletions in the remaining corresponding allele of the lost allele (Zhang et al. 1994 [20]).
1.3. Transforming Growth Factor-P
In most of the cases, tumor cells develop when normal progenitor cells lose control of signal transduction pathways that regulate responses to soluble growth factors. Some growth factors such as epidermal growth factor and platelet-derived growth factor stimulate the signaling pathways, others lead to inhibition of cell growth presumably through mechanisms that target the cell-cycle-regulated events. Among the growth inhibitory factors, the autocrine/paracrine effectors of the type P transforming growth factors, TGF-pi TGF-P2, and TGF-P3 are the ones of key interest, TGF-pi being the most frequently studied one (Alexandrow et al. 1995 [21]).
The TGF-P superfamily of cytokines consists of at least 25 different peptides that have been implicated as multifunctional regulators of cell growth, differentiation, and function. On the basis of sequence similarity, this cytokines can be grouped into three, TGF-Ps, activins, and bone morphological proteins (BMP) (Brand et al. 1996 [22]). TGF-Ps control cell fate by regulating the expression of genes encoding cell cycle regulators, differentiation factors, cell adhesion molecules, matrix products, and many other
components that are key determinants of cell phenotype and apoptosis (Attisano et al. 1994 [23], Heldinetal.\991 [24]).
TGF-pi is excreted as inactive preproTGF-pi containing a latency peptide which blocks its binding to its receptors. By proteolytic cleavage of the latency peptide prepro TGF-pi is activated. This process can be accomplished by plasmin in the presence of transglutaminase when the preproTGF-pi is bound to the M6P/IGF-IIR through phosphomannosyl residues on the growth factor. Following the cleavage, active ligand can bind to TGF-p receptor II (Souza et al. 1996 [25]).
1.4. Transforming Growth Factor-P Signalling
Cellular action of TGF-P family members is initiated by their binding to receptor complexes of type I (TPRI) and type II (TPRII) with intrinsic serine/threonine kinase (STK) activity. There is also a third receptor called type III (betaglycan). It binds to all three TGF-P isoforms with high affinity but has no apparent signaling function. Even though it serves an auxiliary role by presenting TGF-P to TPRII, the cells lacking betaglycan can respond to TGF-p. TPRI and TPRII are similar in structure with small cysteine-rich extracellular regions and intracellular parts consisting mainly of the STK domains. The ligand binding domain contains six to nine variable cysteines and an invariant cysteine box close to the transmembrane domain in all STK receptors. Positioning of cysteine residues determines ligand binding and is conserved in receptors with the same ligand specificity. Although TPRI is quite similar to TPRII, it has three
distinguishing features. The extracellular ligand binding domains of all XpRIs contain seven cysteine residues at nearly the same positions and the cysteine box. At the carboxyl terminus, only a very short nonkinase sequence is present lacking serine/threonine (ser/thr) residues. Most important, the kinase domain is immediately preceded by a type I receptor-specific domain that is rich in serine (SGSGSGLP, the GS box) (Brand et al.
1996 [22], Heldine/a/. 1997 [24]).
Receptor activation occurs upon binding of the ligand to xpRII. Ligand-sitimulated autophophorylation of tyrosine kinase receptors is not observed in this ser/thr kinase receptor. XPRII is constitutively autophosphorylated. Recently, it was reported that phosphorylation of Ser213 and Ser409 is required for XPRII activity, whereas phosphorylation of Ser416 inhibits the receptor signaling and autophosphorylation on tyrosine residues, as well as on serine and threonine residues occur, even though the importance of tyrosine autophoshorylation remains to be determined. Unlike XPRII, XPRI is unable to recognize and bind to the free ligand, XGF-P, in the free medium. However, it can recognize ligand-bound type II receptor forming an oligomeric complex, a heterotetramer consisting of two XPRI and two XPRII, shown by the analysis of *^^I- labelled XGF-P 1 crosslinked to its receptor. This complex formation is strongly correlated with the signaling process. Cells defective in one of the two receptors are refractory to any XGF-P effects. Phosphorylation o f receptor I occurs upon its recruitment into the ligand-XPRII complex and it is a central event in the signal transduction pathway of receptor kinases. XPRI phosphorylation occurs in a cluster of
serine (Seri 65) and threonine residues on the GS domain, a highly conserved region next to the N-terminus of the kinase domain in all type I receptors (Heldin et al. 1997 [24], Eppert et al. 1996 [26], Massague 1996 [27], Wrana et al. 1994 [28]). The phosphorylation process is likely to be catalyzed by the type II receptor which can be concluded from the experiments that compare the phosphorylation state of these receptors when cotransfected with wild-type or kinase-defective mutants of each other such as when T^RI was coexpressed with the kinase defective XPRII, it bound ligand and formed a complex with mutant receptor, but did not become phosphorylated (Wrana et
al. 1994 [28]). The assembly of the receptor complex is triggered by ligand binding, but
the complex is also stabilized by direct interaction between the cytoplasmic parts of the receptors. All these things predict that the type II and type I receptors act in sequence, which is supported by the finding that a constitutively active type I receptor harboring a mutation that results in an aspartate or glutamic acid in GS domain endows TPRI with elevated kinase activity which makes it exert TGF-P signals in the absence of TPRII and the ligand (Heldin et al. 1997 [24], Souza et al. 1996 [25]). In short, in the case of TGF- P signaling pathway, receptor activation occurs upon binding of ligand to TpRII which then recruits and phoshorylates TPRI that propagates the signal to downstream targets. A general model of TGF-p/SMAD signalling is provided in Figure A.l in Appendix A.
Nowadays, more is known about the nuclear targets for TGF-P cascades involved in both growth control and gene transcription. The RB, p l5 ’’’^ ‘‘®, p21^''’*, and p27^’’^ are found to be implicated in TGF-P signaling. Proliferation of eukaryotic cells is regulated by the balance of positive and negative cell cycle regulators-cyclins, cyclin dependent kinases
(Cdks), Cdk inhibitors, and cyclin-activating kinases. Rb, a tumor suppressor ‘pocket protein’, is a key substrate for G1 Cdks. It complexes with E2F transcription factors which regulate DNA polymerase-alpha, dihydrofolate reductase, and cdc2 expression that are required for DNA synthesis. Rb phosphorylation is increased upon activation of Cdks by mitogenic growth factors which results in releasing of E2F , sequential binding of E2F to differing pocket proteins and ultimately cell-cycle progression. For many cell types TGF-P acts as an anti-mitogen. It has been reported that, in TGF-|3 treated cells, the activity (p27) or abundance (p i5 and p21) of several key Cdk inhibitors is increased. Conversely, TGF-|5 suppresses the synthesis of the late G l- and S-phase cyclin E and A along with Cdk2 and Cdk4 resulting in the control of Rb phosphorylation and acting as secondary adaptations to the growth-arrested state. This is the pivotal event to the antiproliferative pathway since deregulated E2F expression can overcome growth suppression by TGF-|5. The events that couple receptor activation to increased expression of Cdk inhibitors and reduced cyclin/Cdk expression still remains undefined (Alexandrow
etal. 1995 [21], Brand etal. 1996 [22], Ravitz etal. 1997 [29]).
1.5. Smads
Until today, very little was known about TGF-P signal transduction from the cell membrane to the nucleus. The first clue came from the studies with Drosophila (fhiit fly) resulting in the identification of some components of the pathway. Recently, a cytoplasmic candidate interacting with Dpp (Drosophila gene decapentaplegenic that encodes a fly homologue of BMP) has been identified and called mothers against dpp, or
MAD. Later it has been shown that the Drosophila MAD protein is present in the cytoplasm and is necessary for Dpp, which is a Drosophila TGF-P family member, mediated response. Shortly after that, MAD related genes (MADR=Smad) have been described in Xenopous (Xmadl and Xmad2) and Caenorhabditis elegans (sma-2, sma-3, and sma-4 genes) (Eppert et al. 1996 [26], Lagna et al. 1996 [30], Baker et al. 1997 [31]).
A recent paper describes the identification of a novel candidate tumor suppressor gene in human. Deleted in Pancreatic Cancer (DPC4=Smad4) with sequence homology to MAD. Up to 85% similarity to these proteins was observed in exons 1, 2, and 11 and up to 75% similarity was seen in exon 8 (Hahn et al. 1996 [32]). Further other homologues of MAD (JV18-1, JV15-1, JV15-2, JV5-1, and W 4-l) were identified based on homology in the expressed sequence databases (Riggins et al. 1996 [33]). Not to be confused in terminology, all the human MADRs are named as Smad (Smadl, Smad2, Smad3, Smad4, and Smad5). Very recently identification of Smad6, Smad7, and Smad8 have also been described (Derynck et al. 1996 [34], Imamura et al. 1997 [35], Nakao et al. 1997 [36],
C htnetal. 1997 [37]).
Smad family genes encode proteins of about 42KD-60KD and these proteins are about 450 amino acids long. They show great homology at the amino and the carboxyl terminals termed Mad-homology domains, MHl and MH2, respectively, which are linked by a proline-rich linker sequence. However, they have no specific protein motif that gives
clue to their function. Thus, it is still unclear how Smad proteins elicit information (Heldin et al. 1997 [24], Massague 1996 [27], Niehrs et al. 1996 [38]) . Analysis of Smadl suggests that the protein resides predominantly in the cytoplasm in unstimulated cells, but accumulates in the nucleus upon activation of BMP signaling pathways. So controlling of Smad retention in the cytoplasm can be an attractive hypothesis for the control of TGF-P signalling pathway as this is the case recurring in other signal transduction pathways (Niehrs et al. 1996 [38]).
Members of the Smad family have different roles in signaling which depends on the type of the ligand (TGF-P, BMP, or activin) and their phosphorylation. They can be categorized into two depending on their phosphorylation fashion as pathway-restricted or common mediator Smads. Smadl, Smad2, Smad3, SmadS, and Smad8 interact with and become phosphorylated by specific type 1 serine/threonine kinase receptors and thereby act in a pathway-restricted manner. Activation of these Smads is triggered by their phosphorylation by TPRI at SSXS (Ser-Ser-X-Ser) motif at their most C-terminal regions. Upon phosphorylation , they are released from the receptor (Wrana et al. 1997 [39], Whitman 1997 [40]). On the other hand, Smad4, which is distantly related to Smad2 and Smad3, differs in the mode of action. Smad4 does not enter into contact with TpRI. Smad4 is not phosphorylated by TPRI, since it lacks the C-terminal SSXS motif However, Smad4 was found to be constitutively phosphorylated in MvlLu cells, and the phosphorylation levels remained unchanged upon TGF-P 1 stimulation. The phosphorylation of Smad4 has been reported to increase after activin stimulation, but the functional importance of this remains to be determined (Lagna et al. 1996 [30]). Upon
ligand stimulation and phosphorylation of pathway-restricted Smads, Smad4 forms hetero-oligomeric complex with them (Wrana et al 1997 [39], Whitman 1997 [40]). In mammalian cells, Smad4 forms hetero-oligomers with Smad2 and SmadS after activation of TGF-3 or activin type I receptors, whereas it forms complexes with Smadl and possibly with SmadS after activation of BMP type I receptors (Lagna et al. 1996 [30], Baker et al. 1997 [31]). It has been reported that a possible candidate for an activating kinase of Smad4 is TGF-P activated kinase, TAK-1, which is a mitogen activated protein (MAP) kinase kinase homologue. Interestingly, both TAK-1 and Smad4 were shown to act in both TGF-P and BMP signalling pathway (Lagna et al. 1996 [30], Nakao et al.
1997 [41]).
Very recently identified inhibitory Smads, Smad6 and Smad7, lack carboxyl-terminal phosphorylation site like Smad4, but unlike Smad4, they interact with type I receptors and probably more stable than pathway restricted Smads. This may be the reason of competitive inhibition of the Smad binding site on the type I receptor. Since they are not phosphorylated, inhibitory Smads are not released from the receptor occupying the binding site for pathway-restricted Smads (Whitman 1997 [40], Wu et al. 1997 [42]).
In the case of TGF-P-mediated Smad activation, Smad2, Smad3, and Smad4 exist as homomeric complexes in the absence of ligand. Upon activation of receptors and their phosphorylation, the three Smads assemble in a common complex, or possibly in several types of complexes, of which the stoichiometry between the components is unknown (Nakao et al. 1997 [41]). Smad4 plays a central role in signalling by different TGF-P
related factors and receptor systems, distinct from the other Smads. It synergizes with Smadl, Smad2, and Smad3 depending on the signal, while Smadl, Smad2, and Smad3 do not synergize with each other to induce gene expression. In addition, the fact that it does not associate with the receptor and it does not become phosphorylated by the receptor is consistent with its central function in the signaling pathway (Wu et al. 1997 [42]). It has been pointed out that Smad phosphorylation is important in homomerization and heteromerization of the Smads (Whitman 1997 [40], Nakao et al. 1997 [41]). It has been reported that the effector function of Smad4 is located in the conserved C-terminal domain and is inhibited by its N-terminal domain. This inhibition is achieved by the interaction of the N-terminal domain with the C-terminal domain which prevents the association with other Smads. It was observed that this inhibitory function is increased in tumor-derived forms of Smad4, having mutant ArglOO (exon 2) in their N-domains with higher affinity to their respective C-domains. However, still it is the C-terminal domain that harbors most of the mutations in Smad4 resulting in Smad4 which is not able to homomerize or heteromerize. The three dimensional structure of the Smad4 C-terminal domain predicts that some of these mutations destabilize the core structure, others disrupt the C-domain homomerization, and others disrupt a putative Smad4-Smad2 interface (Hata et al. 1997 [43], Liu et al. 1996 [44], Baker et al. 1996 [45]). The crystal structure of C-terminal domain of Smad4 reveals that it forms a crystallographic trimer through a conserved pro-protein interface, and the tumor derived missense mutations map to this region of the protein (Shi et al. 1997 [46]). Separate activation and ligand-response domains within Smad4 have been characterized using a functional assay based on the restoration of TGF-P responsiveness in a Smad4 null cell line by transient transfection
with Smad4. It is shown that amino acid residues 274-321 in Smad4 is necessary for transducing signal downstream from the receptor and thus is referred as Smad activating domain (SAD). SAD may be unique to Smad4 in Smad family members. The ligand response domain of Smad4 is located to N-terminal domain of the gene and is thought to obscure the SAD located at the C-terminal of the middle linker region in the absence of ligand either by direct blockage of this region, or by conformational interference. However, following ligand activation, SAD is exposed most probably due to unfolding of the molecular structure to interact with other Smads (Caestecker et al. 1997 [47]).
After ligand activation, Smad4, Smad2, and possibly SmadS translocate to the nucleus as a heteromeric complex which contains trimers of each and perform their transcriptional activation role there by specifically interacting with DNA-binding proteins or directly with DNA. One example of transcriptional activation by Smad complex is the activation of Mix. 2 gene (immediate early response gene) in Xenopous which is activin sensitive. This activation occurs consequent to Smad2-Smad4 and FAST-1 (DNA binding protein) complex binding to activin responsive element in the promoter of Mix. 2 gene (Chen et al. 1996 [48], 1997 [49]). Another example is that Drosophila Mad binds to DNA and directly mediated activation of an enhancer within vestigial wing-patterning gene in cells across the entire developing wing blade (Kim et al. 1997 [50]). A general model of TGF- P/SMAD signalling is provided in Figure A. 1 in Appendix A.
Consequently, the nature of the signals that controls Smad protein localization is still unclear, but the results suggest that Smad proteins can function in the pathway to
transmit signals from the c5^oplasm into the nucleus. There are many potential targets for Smads in the nucleus, and the possibility that Smad proteins are transcription factors is suggested by the observation that the protein can function as a transcriptional activator, when fused to a heterologous DNA-binding domain (Niehres et al. 1996 [38]).
1.6. Aim
Taking all the information above into consideration, what may be the relation between HCC development and TGF-P signaling pathway and what may be the reason for choosing Smad4 for performing mutational analysis in HCC?
As it has been discussed above, HCC usually develops after a 20-50 year period of HBV infection, often subsequent to cirrhosis. This long latent period before the clinical symptoms indicates they are the result of a multistep process. Several studies have been directed toward the identification of common genetic alterations. Frequent deletions in at least ten chromosomal locations might indicate that there are at least ten different genes involved in HCC. There are few tumor suppressor genes known to be mutated and inactivated in human HCC. Genetic alterations other than p53 (Ozturk 1994 [2], Unsal et
al. 1994 [51], Puisieux & Ozturk 1997 [52], Kishimoto et al. 1997 [53]), pl6 (Hui et al.
1996 [15], Chaubert et al. 1997 [16], Qin et al. 1996 [17], Biden et al. 1996 [18]), BRCA2 (Katagiri et al 1996 [19]), M6P/IGF-IIR (Souza et al. 1995 [14]), RB (Zhang et
al 1994 [20], Puisieux et al. 1993 [54]), PRLTS (Fujiwara et al. 1995 [55]), and Tg737
(Isfort et al. 1997 [56]) remain highly unknown. The alterations reported in these genes in HCC cases are summarized in the table below, Table 1.1.
Gene Alteration Freq, Reference
pl6 GC deletion 8/24 Q ine/a/., 1996
Homozygous deletion 2/24
G-^C 1/23 Biden etal., 1997
No protein expression 11/32 Hui etal., 1996
Hemizygous germ-line mutation 4/26 Chaubert et a/., 1997
Rb Loss of heterozygosity (LOH) 9/21 Zhang et al., 1994
No protein expression 8/9 of LOH
No protein expression 3/12 of non- LOH
Small deletion 2/9 of LOH
BRCA2 6 base pair deletion in intron 1/60 Katagiri etal., 1996 Germ-line mutation
• G ^ T • A-^C
2/60
M6P/IGF2R LOH 70/100 Souza eta/., 1995
C;G->A:T 25/100 of
LOH
p53 Point mutation Puisieux & Ôztürk.,
• High aflatoxin 55% 1997
• Low aflatoxin 28%
PRLTS Val302Ala
TT deletion CTTTC175CTG
2/48 Fujiwara et al., 1995
Tg737 Deletion of exons 3, 5, 14, 22 4/11 Isfort eta/., 1997 Table 1.1: HCC Mutations
TGF-pi is a strong inhibitor of hepatocyte proliferation and it has been proposed as guardian of quiescence in liver. Certain data indicate that TGF-pi can actively suppress tumor formation in vitro (Fausto et al. 1995 [57]). Loss of growth inhibitory response to
TGF-P at the cellular level is probably an important step in malign progression. Recently, several lines of evidence indicate that TGF-3 receptors and proteins involved in signaling by TGF-|is act as tumor suppressor genes. The prediction was bom out with the finding that the TjJRII is inactivated by mutation in (A)io repeat in colon cancer with microsatellite instability (MI) (Markowitz et al. 1995 [58], Akiyoma et al. 1996 [59], Lu
et al. 1995 [60]). This idea was further supported by the mutations in this gene in
gastrointestinal cancer (Renault et al. 1996 [61]). When we have a look at other genes in the pathway, we see that IGF-IIR is inactivated by mutation in (G)g repeat in gastrointestinal tumors with MI (Souza et al. 1996 [25]), Smad2 is mutated in lung (Uchida et al. 1996 [62]), and colon cancers (Eppert et al. 1996 [26], Riggins et al. 1996 [33]), and common mediator Smad, Smad4, is mutated in colon (MacGrogan et al. 1997 [63], Thiagalingam et al. 1996 [64]), pancreas (Hahn et al. 1996 [32]), lung {Nagatake et
al. 1996 [65]), biliary tract (Hahn et al. 1998 [66]), and juvenile polyposis (Howe et al.
1998 [67]). The list of the published mutations, and alterations in Smad4 gene in various tumor types are summarized in Table 1.2.
Tumor Codon (Exon)
Alteration Freq, Reference
Biliary tract 343(8) TCA^TGA Ser^stop 5/32 Hahn et al.
Biliary tract 433(9) GCA->ACA A la^Thr 1998
Biliary tract 497(11) CGC^CAC A rg^H is
Biliary tract 502(11) AGG^GGG A rg^Gly
Biliary tract 523(11) TGC-^TGG C ys^Trp
Lung 202-203(4) 2 base pair deletion (CC) 3/42 Nagatake et
frameshift al, 1996
Lung 420(9) CGT^CAT Arg^H is
Lung 441(10) CGT^CCT Arg->Pro
Colorectal 64(1) GCA-»GTA Gly^Val 1/9 MacGrogan
et al., 1997
Pancreatic 358(8) GGA^TGA Gly^stop 6/27 Hahn et al..
Pancreatic 412(9) TAC^TA G T yr^stop 1996
Pancreatic 483(10) AGT^AAT aberrant
Pancreatic 493(11) splicing
Pancreatic 515(11) GAT->CAT Asp->His
Pancreatic 516-518(11) AGA->TGA Arg->stop CAGAGCATC^C frameshift
Neuroblastoma Altered protein expression 6/32 Kog et al.,
1997
Colon 1-11 Homozygous deletion 6/100 Thiagalingam
Colon 1-11 Homozygous deletion et al., 1996
Colon 358(8) TCTGGA->TTCCTGA
Colon 130(2) Gly^stop
Colon 361(8) C-^T Pro-^Ser
Colon 370(8) C->T Arg^Cys
T-^A Val->Asp
Juvenile polyposis 414-416(9) 4 base pair deletion 5/9 Howe et al.. Juvenile polyposis 414-416(9) 4 base pair deletion 3/5(f) 1998
Juvenile polyposis 414-416(9) 4 base pair deletion 2/5(s) Juvenile polyposis 348(8) 2 base pair deletion
Juvenile polyposis 229-231(5) 1 base pair insertion Table 1.2: Smad4 Mutations and Alterations in Tumors
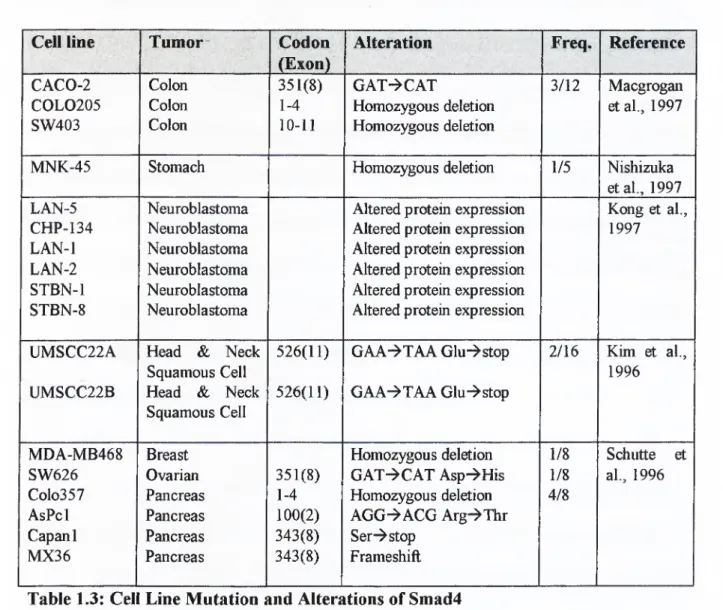
Breast, ovarian, pancreas (Schüttle et al. 1996 [68]), stomach (Nishizuka et al. 1997 [69]), head and neck squamous cell (Kim et al. 1996 [70]), and colon (MacGrogan et al. 1997 [63]) carcinoma cell lines also show alterations in Smad4 gene. The below table. Table 1.3, lists the mutations, and altareations found in those cell lines.
Cell line Tumor' Codon
(Exon)
Alteration Freq. Reference
CACO-2 Colon 351(8) GAT->CAT 3/12 Macgrogan
COLO205 Colon 1-4 Homozygous deletion et al., 1997
SW403 Colon 10-11 Homozygous deletion
MNK-45 Stomach Homozygous deletion 1/5 Nishizuka
et al., 1997
LAN-5 Neuroblastoma Altered protein expression Kong et al..
CHP-134 Neuroblastoma Altered protein expression 1997
LAN-1 Neuroblastoma Altered protein expression
LAN-2 Neuroblastoma Altered protein expression
STBN-1 Neuroblastoma Altered protein expression
STBN-8 Neuroblastoma Altered protein expression
UMSCC22A Head & Neck 526(11) GAA-^TAAGlu^stop 2/16 Kim et al..
Squamous Cell 1996
UMSCC22B Head & Neck Squamous Cell
526(11) GAA-^TAA Glu"^stop
MDA-MB468 Breast Homozygous deletion 1/8 Schutte et
SW626 Ovarian 351(8) GAT^CAT Asp-»His 1/8 al., 1996
Colo357 Pancreas 1-4 Homozygous deletion 4/8
AsPcl Pancreas 100(2) AGG-^ACG Arg-^Thr
Capanl Pancreas 343(8) Ser-^stop
MX36 Pancreas 343(8) Frameshift
Table 1.3: Cell Line Mutation and Alterations of Smad4
Also 3' untranslated region (UTR) nucleotide substitution in esophageal squamous cell carcinoma (Barrett et al. 1996 [71], Maesawa et al. 1997 [72]), and altered expression in neuroblastoma (Kong et al. 1997 [73]), in Smad4 gene have been observed.
Eventhough, there is a recent study for the mutational analysis of other Smads in TGF-P signalling pathway, no mutation was characterized for Smadl, SmadS, Smad5, and Smad6 (Riggins et al. 1997 [74]).
In HCC, decreased levels of TpRII and IGF-IIR mRNA and protein levels have been observed (Sue et al. 1995 [75]). Mutations of IGF-IIR gene in HCC was also published (Souza et al. 1995 [14]). These alterations may result in the disruption of TGF-P signaling pathway. Depending on the type and the region of the mutation homomerization or heteromerization of the Smad family members is prevented, thus they can not oligomerize and translocate to the nucleus to transactivate the target gene. As it is discussed before, cancer cells lose responsiveness to TGF-P which is an antiproliferative agent. Even though increased levels of TGF-P has been observed in liver cancers and in cirrhosis, cellular proliferation occurs which can be explained by the possibility of disruption of the genes in the TGF-P signalling pathway.
Smad4, which is a common mediator Smad, is shown to be mutated in many cancer types. Interestingly, there is no study concerning genetic analysis of recently identified Smad4 gene in HCCs has been performed. Consequently, we decided to do the mutational analysis of Smad4 gene in human HCCs.
Smad4 gene consists of 11 exons and codes for 552 amino acids long protein. As it has been discussed before the mutations are mostly localized to MHl and MH2 regions. Comparing the exons based on the number of the mutations, exonS in MH2 region comes
first. It is followed by exon 11, exon 9, and exon 10 which are all located in MH2 region. Then conies exon 2 in MHl region. Finally other exons in Smad4 gene namely exon 1, 4, and 5 take place. In correlation with this data, we decided to concentrate on the exons located in MH2 region of the gene, exons 8, 9, 10, and 11, and exon 2 which is in MHl region. The structure of Smad4 gene is provided in Figure A. 2 in Appendix A.
Chapter 2
II. Materials and Methods
II. 1. Materials
II. 1.1. Samples
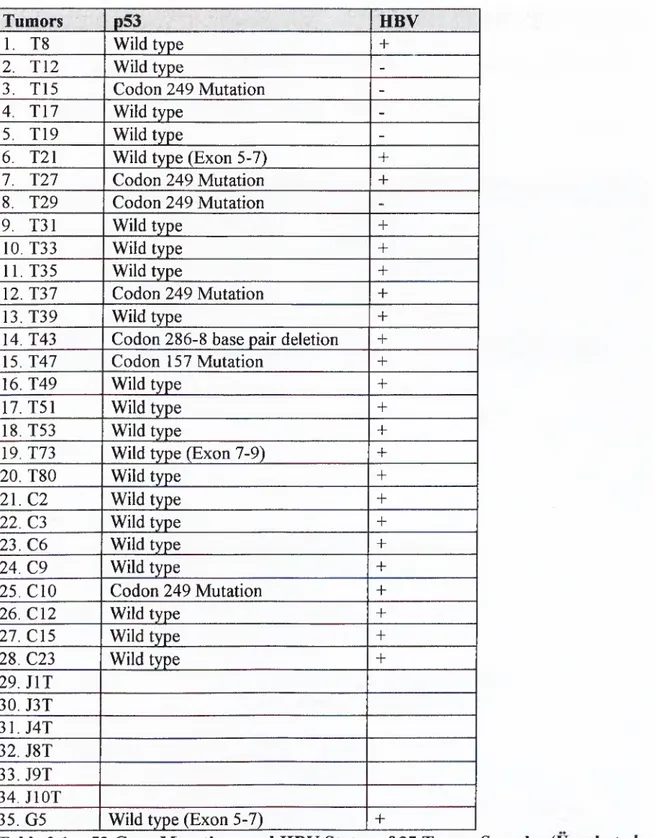
We investigated 35 tumor DNAs that were obtained from hepatocellular carcinoma patients living in South Africa, Mozambique, China, Japan, and Germany. These tumors were tested for their p53 gene mutation and HBV status which is summarized in Table 2.1. These DNA samples were studied in France before, so no DNA extraction was performed by us. We both had the tumor DNAs, which were isolated from the liver tissue of the patients, and the normal DNA of the patients, which were isolated from the normal part of the liver of the patients.
Tumors p53 HBV 1. T8 Wild type + 2. T12 Wild type -3. T15 Codon 249 Mutation -4. T17 Wild type -5. T19 Wild type
-6. T21 Wild type (Exon 5-7) +
7. T27 Codon 249 Mutation + 8. T29 Codon 249 Mutation -9. T31 Wild type + 10. T33 Wild type -l· 11. T35 Wild type + 12. T37 Codon 249 Mutation -b 13. T39 Wild type +
14. T43 Codon 286-8 base pair deletion -b
15. T47 Codon 157 Mutation
4-16. T49 Wild type 4
17. T51 Wild type 4
18. T53 Wild type 4
19. T73 Wild type (Exon 7-9) -f
20. T80 Wild type 4
21. C2 Wild type 4
22. C3 Wild type 4
23. C6 Wild type 4
24. C9 Wild type 4
25. CIO Codon 249 Mutation 4
26. C12 Wild type 4 27. C15 Wild type 4 28. C23 Wild type 4 29. JIT 30. J3T 31. J4T 32. J8T 33. J9T 34. ЛОТ
35. G5 Wild type (Exon 5-7) 4
Table 2.1: p53 Gene Mutations and HBV Status of 35 Tumor Samples (Unsal et al.^ 1994)
We also investigated six hepatocellular cell lines for the mutations and the trancription of Smad4 gene. The examined cell lines are HepG2 (Aden et al., 1979 [76]), Hep3B (Aden
et al., 1979 [76]), Huh-7 (Nakabayashi et al., 1982 [77]), FOCUS (He et al., 1984 [78]), Mahlavu (Alexander et al., 1984 [79]), and PLC/PRF/5 (Alexander et al., 1976 [80]). The information about the cell lines are given in Table 2.2.
Name Origin P53 HBV
HepG2 Hepatoblastoma Wild type
-Hep3B HCC Deleted +
Huh-7 HCC No gross change
-FOCUS HCC Deleted +
Mahlavu HCC No gross change
-PLC/PRF/5 HCC No gross change -f
Table 2.2: The origins, p53 Gene, and HCV Integration Status of the Cell Lines
11.1.2. Solutions
Tris-borate Loading Buffer Ethidium bromide SSCP loading buffer Acrylamide-bisacrylamide 0.5X:0.045 M Tris-borate (TBE), 0.001 MEDTA 6X;0.25% bromphenol blue 30% glycerol in water10 mg/ml in water (stock solution), 0.5 |xg/ml (working solution) 95% formamide, 0.25% BPB bromphenol blue
49.5% acrylamide and 0,5 % N-N- methylene bis-acrylamide
All the solutions are prepared according to the procedures of Maniatis
IL2.1. Polymerase Chain Reaction
Polymerase chain reaction (PCR) was performed for the amplification of the 5 exons of Smad4 gene and cell lines, and fiall length cDNAs of hepatoma cell lines. It is an in vitro enzymatic method for the amplification of the sequence of interest.
PCR is based on three main steps and these three steps are called a "cycle". The cycle involves a dénaturation step, in which template DNA is denatured, an annealing step, during which primers which are short oligonucleotides complementary to the sequence to be amplified, are allowed to bind to the template DNA and a polymerization step, during which a thermostable enzyme uses deoxyribonucleotide three phosphates to synthesize the complementary strands of the strands the primers annealed in 5' to 3' direction.
II.2.1.1. Procedure
PCR for the exons of Smad4 gene was performed in 25 pi working mixture containing 0.005 mCi ^^P-dATP, 1.5 mM MgCL, 40 pM dNTP, 20 pmol forward and 20 pmol reverse primer, 2.5 pi lOX buffer and 1.5 unit Taq polymerase and the mixture was completed to 25 pi with autoclaved ddlLO. The conditions for the amplification of the exons of the cell lines were the same.
II.2. Methods
The samples were initially denatured at 95 °C (3 min). Then 30 cycles of dénaturation at 95 °C (30 sec), annealing at 56 or 57 °C (30 min), and extension at 72 °C (45 sec) follows the initial dénaturation step. Lastly, a final extension at 72 °C (5 min) completes the reaction.
Full length cDNAs of the hepatoma cell lines are amplified by PCR in a 25 pi working solution containing 1.5 mM MgCL, 400 pM dNTP, 20 pmol forward primer, 20 pmol reverse primer, 2.5 pi lOX buffer, and 1.5 unit Taq polymerase.. The mixture is completed to 25 pi with autoclaved ddH20.
Before performing radioactive PCR, the PCR conditions were set up nonradioactively and the amplification products were checked with 1.5% agarose gel, and visualized with ethidium bromide staining under UV.
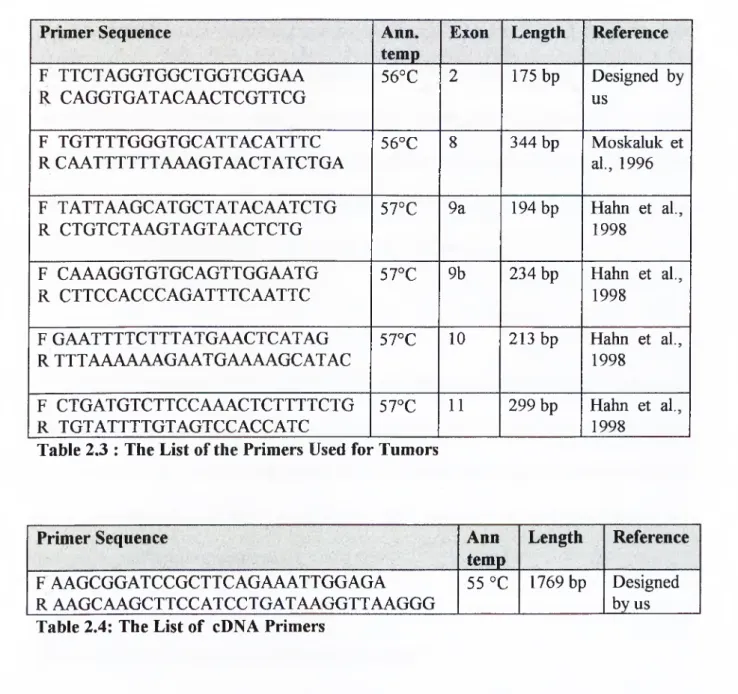
Perkin Elmer thermal cycler model 9600 was used for the amplification of the exons. The primers have been synthesized in house using Beckman lOOOM oligosynthesizer. The primer sequences, their anneealing temperatures, the length of the amplified DNA sequence and the exon numbers are given in Table 2.2. The primers used for the amplification of full length cDNA of the hepatoma cell lines are given in Table 2.3.
Primer Sequence Ann. temp
Exon Length Reference
F TTCTAGGTGGCTGGTCGGAA R CAGGTGATACAACTCGTTCG 56°C 2 175 bp Designed by us F TGTTTTGGGTGCATTACATTTC R CAATTTTTTAAAGTAACTATCTGA 56°C 8 344 bp Moskaluk et al., 1996 F TATTAAGCATGCTATACAATCTG R CTGTCTAAGTAGTAACTCTG 57°C 9a 194 bp Hahn et al., 1998 F CAAAGGTGTGCAGTTGGAATG R CTTCCACCCAGATTTCAATTC 57°C 9b 234 bp Hahn et al., 1998 F GAATTTTCTTTATGAACTCATAG R TTTAAAAAAGAATGAAAAGCATAC 57°C 10 213 bp Hahn et al., 1998 F CTGATGTCTTCCAAACTCTTTTCTG R TGTATTTTGTAGTCCACCATC 57°C 11 299 bp Hahn et al., 1998
Table 2.3 : The List of the Primers Used for Tumors
Primer Sequence Ann
temp Length Reference F AAGCGGATCCGCTTCAGAAATTGGAGA R AAGCAAGCTTCCATCCTGATAAGGTTAAGGG 55 °C 1769 bp Designed by us Table 2.4; The List of cDNA Primers
II.2.2. Single Stranded Conformation Polymorphism Analysis
Single stranded conformation polymorphism (SSCP) analysis is used as a mutation detection technique while investigating Smad4 gene.
This technique is based on dénaturation of the PCR product and running each sample, which is now composed of the denatured single strands, on vertical electrophoresis side
by side through a non-denaturing polyacrylamide gel. The idea behind denaturing the amplified sequence is that, the two single strands of the DNA molecule assume a three dimensional conformation which is dependent on the primary sequence. The single strands migrate according to the conformation they acquire. In the case of a sequence difference, differential migration of the single strands is expected when compared to the migration of the single strands of the normal DNA sequence.
II.2.2.1. Procedure
In order to prepare the PCR products for SSCP analysis, 8 pi of SSCP buffer containing formamide is mixed with 2 pi of PCR product and denatured at 96 °C for 2 min in heat block. Formamide avoids renaturation of the denaturated single strands. Denatured sample is then kept in ice for 5 min before SSCP analysis which will be observed by polyacrylamide gel electrophoresis.
II.2.3. Polyacrylamide Gel Electrophoresis
Polyacrylamide gel electrophoresis is a high resolution technique used to observe the DNA bands by using different staining methods, such as, ethidum bromide, sybrgreen and silver staining or autoradiography. Due to the negative charges of the phosphates of the DNA molecule, upon voltage application DNA migrates from negative to the positive pole of the gel through the porous structure of the polyacrylamide gel.
10% 100 ml polyacrylamide gel solution, containing 20 ml 49.5:0.5 acrylamide- bisacrylamide, 10 ml lOXTBE, and 10 ml 10% glycerol is prepared, filtered, and degassed. Then, 500 pi 10% APS and 50 pi TEMED, is added to the mixture. After filtering and degasing it, it is poured to EC 160 vertical gel electrophorase. Following 2 hours of polymerization and 30 min of pre-run at 50 watt in cold room (5 °C), 10 pi of formamide and denatured sample mixture is loaded and run at 50 watt for 11 to 14 hours depending on the conditions set for each exon.
II.2.3.1. Procedure
11.2.4. Gel Drying
The gel is mounted on a 3M Wattman paper, covered with stretch film, and dried for two hours at 80 °C with a gel drier in the presence of vacuum.
11.2.5. Autoradiography
A film is put over the dried gel, and together they are put in a cassette with intensifier for exposure during 3 days. Following the exposure time, the film is developed with a developer in a dark room. In the case of faint signals, the same procedure is repeated for a longer time.
11.2.6. Restriction Enzyme Digestion
Restriction endonuclease, Mnll is used to detect the arglOOthr (AGG->ACG) mutation in exon 2 and the recognition site of the enzyme is shown in Table 2.4. If there is no mutation in the exon, the enzyme digests at the given sequence by recognizing the GG sequence of exon 2 which is at the 3’ recognition site of the enzyme. However, in the case of mutation, it can not recognize the base change from G to C, thus can not digest the sequence.
Restriction Endonuclease Recognition site
Mnll 5’...CCTC(N)7'...3'
3'...GGAG(N)6'...5' Table 2.5: Restriction Enzyme Cutting Sites
Chapter 3
III. Results
We sucsessfully amplified the exons 2, 8, 9, 10, and 11 by PCR, and performed radioactive SSCP analysis to all 35 HCC samples for each exon.
In SSCP, after exposure and development of the film, in most of the cases, we were able to detect two bands which are close to each other, and another third band which is far from the other two bands. With the help of a control nondenatured DNA sample, we were able to conclude that the lower band corresponds to the double-stranded DNA, and the other closely migrated bands correspond to denatured single strands.
In the gels with longer migration time to increase the resolution, the bands of double- stranded DNA were not observed since they migrate faster than the single strands.
In order to test our gel conditions, we performed SSCP analysis for the p53 gene codon 248-249 mutations. We were able to observe very clear shifts in the mutant samples compared to their wild-types as can be seen from Figure 3.1.
The two upper bands correspond to single strands, and the lower bands, which migrated the same in both the wild type and the mutant p53 correspond to the nondenatured double strand of the amplified DNA.
wt-p53 and mut-p53 Analysis in SSCP
3 3 a
B B
N) 1 fJl rjl SO 4^ac
Figure 3.1: SSCP Analysis of p53 Gene Codon 248-249 Mutations.
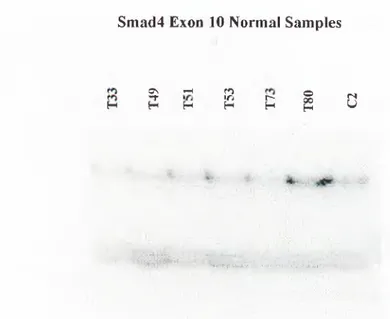
In most of the cases, no alterations were observed following SSCP analysis as can be seen from Figure 3.2.
Smad4 Exon 10 Normal Samples
Os r -i
"i·
H H H
^
S PO
I GFigure 3.2: SSCP Analysis of Exon 10 Tumor DNAs with No Alteration
In the cases in which differential migration has been observed, the shifted bands have been observed to migrate slower than the other normal bands. Sometimes in addition to the shifted band, a single strand with a same migration pattern with the normal denatured DNA strand can be observed in the shifted tumor DNA. This result may be due to the fact that, the tumor DNA may not be homogeneous i.e., some normal cell contamination such as lymphocytes and endothelial cells to the cancer liver tissue may have lead to normal DNA contamination.
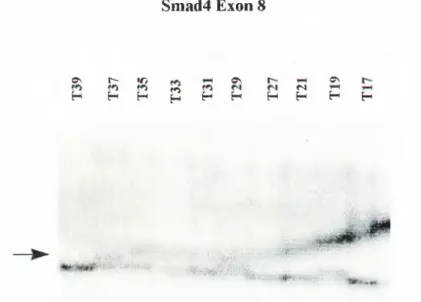
In the 35 tumors we analyzed, we were able to observe three shifted samples in exon 8. The below figure. Figure 3.3 shows SSCP analysis of exon 8 of Smad4 gene for some tumor samples.
S m a d 4 E x o n 8 OS l> «rs tTi H OS os fN H H H H H H H H H
Figure 3.3: SSCP Analysis of Exon 8
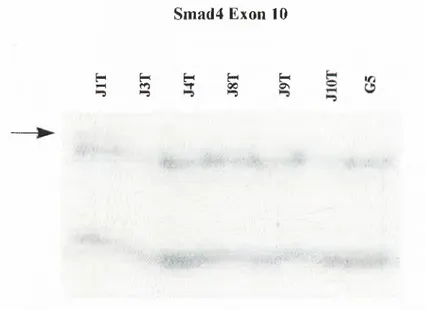
In addition to the shifts observed in exon 8, SSCP analysis resulted in two more shifts, one in exon 9a (to cover the coding region of exon 9, it was divided into two parts, namely, exon 9a and exon 9b), and in exon 10. SSCP analysis of some tumor samples together with the shifted samples can be seen from Figure 3.4 and 3.5, respectively. The samples, in which differential migration has been observed, were amplified together with their DNA extracted from the normal part of the liver. We also observed similar migration pattern (two bands instead of one). However, in one of the tumors, one of these two bands was weaker than the other one, contrary to two similar band pattern in normal DNA from the same patient.
Smad4 Exon 9a
H
H H UTi mH H <sHm0m
Figure 3.4: SSCP Analysis of Exon 9a
Smad4 Exon 10
H
tH
1-5 H fo »-5 H'-t H 00 I-:» HON
Figure 3.5: SSCP Analysis of Exon 10
The results o f SSCP analysis o f all the samples can be seen from the following table. Table 3.1 associated with their coutries, p53 gene mutation, and HBV integration status.
Tumors p53 HBV Smad4
1. T8 (SA-L) Wild type Wild type
2. T12 (SA-T) Wild type - Wild type
3. T15 (M) Codon 249 Mutation - · Wild type
4. T17 (SA-L) Wild type - Wild type
5. T19 (SA-T) Wild type - Shift (Exon 8)
6. T21 (SA-T) Wild type (Exon 5-7) + Wild type
7. T27 (M) Codon 249 Mutation + Wild type
8. T29 (M) Codon 249 Mutation - Shift (Exon 8)
9. T31 (SA-T) Wild type + Wild type
10. T33 (SA-T) Wild type + Wild type
11.T35 (SA-T) Wild type + Wild type
12. T37 (M) Codon 249 Mutation + Shift (Exon 8, 9)
13. T39 (SA-S) Wild type + Wild type
14. T43 (SA-T) Codon 286-8 bp. del. + Wild type 15. T47 (M) Codon 157 Mutation - f - Wild type
16. T49 (SA-C) Wild type Wild type
17. T51 (M) Wild type + Wild type
18. T53 (M) Wild type + Wild type
19. T73 (G) Wild type (Exon 7-9) Wild type
20. T80 (G) Wild type + Wild type
21. C2 (C) Wild type + Wild type
22. C3 (C) Wild type H - Wild type
23. C6 (C) Wild type + Wild type
24. C9 (C) Wild type + Wild type
25. CIO (C) Codon 249 Mutation + Wild type
26. C12 (C) Wild type + Wild type
27. C15 (C) Wild type - f Wild type
28. C23 (C) Wild type + Wild type
29. JIT (J) Shift (Exon 10)
30. J3T (J) Wild type
31.J4T (J) Wild type
32.J8T (J) Wild type
33.J9T (J) Wild type
34. JIOT (J) Wild type
35. G5 (G) Wild type (Exon 5-7) + Wild type
Table 3.1: SSCP Results of the Tumors for Smad4 Gene
The samples were from Sa-L, South Africa (Lesonto); SA-T, South Africa (Transkei); M, Mozambique; SA-S, South Africa (Swaziland); SA-C, South Africa (Caucasian); C, China; J, Japan; and G, Germany.
In order to test whether the normal DNAs of the samples shift or not, we also performed SSCP analysis to them, and we loaded the normals of the shifted samples with their tumors to the SSCP gel. Four of the normals (exon 8 and exon 9a) showed shifts like their tumors. We are still trying to confirm the shift in exon 10.
While analyzing the inhibitory mutation in codon 100 which corresponds to exon 2 and results in arginine (AGG) to threonine (ACG) change, we expected to have a digestion at 3’. . .GGAG(N)6’. . .5’ unless there is a mutation. We observed that all samples were digested successfully with the enzyme, revealing that, codon 100 is not mutated.
In addition to the patient tumor samples, SSCP analysis were also performed for the genomic hepatoma cell lines. However, no alteration was observed in the cell lines in any of the tested exons.
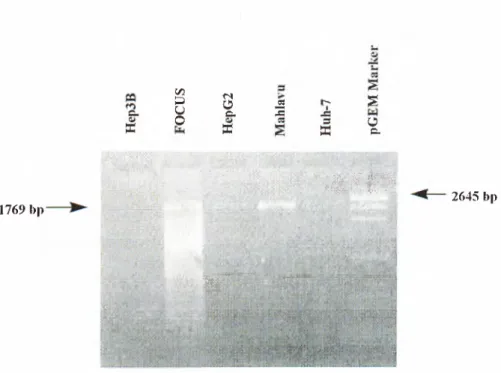
Consequent to the results of SSCP analysis for the cell lines, we checked Smad4 gene expression for cell lines HepG2, Hep3B, Huh-7, FOCUS, and Mahlavu by amplifying the cDNAs of them. All cell line cDNAs were amplified as can be seen from Figure 3.6. However, the band corresponding to Hep3B was very faint. There was no large deletion detectable with 2% agarose.
1769 bp
Smad4 Expression In Hepatoma Cell Lines
Cm X C/5 P u
o
<N oc. a m2 2 a s OC m . j i i a t wn·*·«·“ ^ 1 1 „ J . ¡1««M ¡.-saLM^^ 'Eft‘ii«)i· "i>fı|н·'l ii',j> 2 M
2645 bp
Figure 3.6: PCR Analysis of Cell Line cDNAs
We are trying to amplify Smad4 cDNA in the presence o f a house keeping gene primers, as an internal control in order to confirm this result.
Chapter 4
IV. Discussion
It has been indicated that, HCC usually develops after a 20-50 year period of HBV infection, often subsequent to cirrhosis (Ding et al. 1991[1], Ôztürk 1994 [2]). This long latent period before the clinical symptoms indicates that they are the result of a multistep process. However, the molecular events leading to HCC still remains to be established. In contrast to other tumors, in human HCC, neither a single oncogene nor a tumor suppressor gene has been shown to be preferentially altered nor show a characteristic of HCC pattern. Even though viral HBV-DNA integrations resulted in altered expression of some genes namely cyclin A, retinoic acid receptor gene, and mevalonate kinase gene (Wang et al. 1990[5], Dejean et al. 1986[6], Graef et al. 1994[7]), there is no HBV- DNA specific locus in human hepatocyte genome which will result in altered expression of an oncogene or a tumor suppressor gene. Several studies on human HCC tissues suggest that overexpressed c-myc, c-fos, cyclin D l, c-met and retinoic acid receptor genes may play a role in human hepatocarcinogenesis (Arbuthnol et al. 1991 [10], Nishida
etal. 1994[ll],B o ix etal. 1994[12], Severe/a/. 1991[13]).
There is no evidence of a familial predisposition to HCC, and HCC is not associated with the development of other malignancies.
Until now, several studies have been directed toward the identification of the genetic alterations in HCC. However, genetic alterations other than p53, pl6, BRCA2, M6P/IGF-IIR, Rb, PRLTS, and Tg737 remain highly unknown. In high aflatoxin exposure areas , p53 mutations are 55% and most of them are codon 249 mutations. In the remaining seven genes, mutations appear very infrequently.
In most cases, tumor cells develop when normal progenitor cells lose control of signal transduction pathways that regulate responses to soluble growth factors. Some growth factors inhibit cellular proliferation and TGF-P is among them.
TGF-P is a strong inhibitor of hepatocyte proliferation. The signal from the ligand, TGF- P, to the nucleus is mediated by serine-threonine kinase receptor pathway. In this pathway TPRII is found to show MI in gastrointestinal and colon cancers. Also, IGF-IIR shows MI in gastrointestinal tumors. Smad2 is mutated in lung, and colon cancers. Smad4, the common mediator Smad is shown to be mutated in breast, ovarian, pancreas, colon, head and neck squamous cell, lung, stomach, biliary tract, and juvenile polyposis cancers. On the other, hand other Smads namely Smadl, Smad3, Smad5, and Smad6 in the pathway were not found to be mutated. Smad7 and SmadS are not mutationally analyzed until now.
The mutations in the genes that participate in the pathway may lead to unresponsiveness to TGF-|3 resulting in hepatocyte proliferation. In TGF-(3 signalling pathway, only TPRII and IGF-IIR mRNA and protein levels have been tested for HCC patients and shown to be decreased in level. This altered levels of expression result in the disruption of TGF-P signalling pathway. No mutational analysis of the pathway genes in HCC has been done until now.
Single base alterations are the most common type of mutations. Hetereduplex analysis (HA), denaturing gradient gel electrohporesis (DGGE), RNase cleavage, chemical mismatch cleavage (CMC), protein truncation test (PTT), restriction enzyme digestion, direct sequencing, and single stranded conformation polymorphism (SSCP) analysis are the methods that are used to detect single base alterations in the genome in literature.
HA is based on the idea that denatured and renatured PCR products will form both homoduplexes of the wild type and the mutant DNA strands, or heteroduplexes of the mutant and wild type DNA strands and homoduplexes will have differential migration pattern on polyacrylamide gel.
DGGE also relies on differential electrophoretic migration of wild type and mutant DNA when they are electrophorased through a gradient of increasing concentration of a denaturing agent. As the PCR product migrates, it denatures and single base change exhibits a differential mobility.