ARTICLE
OPEN
doi:10.1038/nature15393A global reference for human
genetic variation
The 1000 Genomes Project Consortium*
The 1000 Genomes Project set out to provide a comprehensive description of common human genetic variation by
applying whole-genome sequencing to a diverse set of individuals from multiple populations. Here we report
completion of the project, having reconstructed the genomes of 2,504 individuals from 26 populations using a
combina-tion of low-coverage whole-genome sequencing, deep exome sequencing, and dense microarray genotyping. We
characterized a broad spectrum of genetic variation, in total over 88 million variants (84.7 million single nucleotide
polymorphisms (SNPs), 3.6 million short insertions/deletions (indels), and 60,000 structural variants), all phased
onto high-quality haplotypes. This resource includes .99% of SNP variants with a frequency of .1% for a variety of
ancestries. We describe the distribution of genetic variation across the global sample, and discuss the implications for
common disease studies.
The 1000 Genomes Project has already elucidated the properties and
distribution of common and rare variation, provided insights into the
processes that shape genetic diversity, and advanced understanding of
disease biology
1,2. This resource provides a benchmark for surveys of
human genetic variation and constitutes a key component for human
genetic studies, by enabling array design
3,4, genotype imputation
5,
cataloguing of variants in regions of interest, and filtering of likely
neutral variants
6,7.
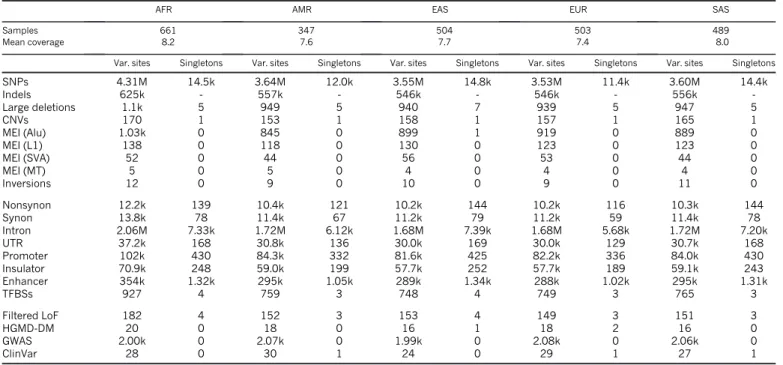
In this final phase, individuals were sampled from 26 populations
in Africa (AFR), East Asia (EAS), Europe (EUR), South Asia (SAS),
and the Americas (AMR) (Fig. 1a; see Supplementary Table 1 for
population descriptions and abbreviations). All individuals were
sequenced using both whole-genome sequencing (mean depth 5 7.43)
and targeted exome sequencing (mean depth 5 65.73). In addition,
individuals and available first-degree relatives (generally, adult
off-spring) were genotyped using high-density SNP microarrays. This
pro-vided a cost-effective means to discover genetic variants and estimate
individual genotypes and haplotypes
1,2.
Data set overview
In contrast to earlier phases of the project, we expanded analysis
beyond bi-allelic events to include multi-allelic SNPs, indels, and a
diverse set of structural variants (SVs). An overview of the sample
collection, data generation, data processing, and analysis is given in
Extended Data Fig. 1. Variant discovery used an ensemble of 24
sequence analysis tools (Supplementary Table 2), and
machine-learn-ing classifiers to separate high-quality variants from potential false
positives, balancing sensitivity and specificity. Construction of
hap-lotypes started with estimation of long-range phased haphap-lotypes using
array genotypes for project participants and, where available, their
first degree relatives; continued with the addition of high confidence
bi-allelic variants that were analysed jointly to improve these
haplo-types; and concluded with the placement of multi-allelic and
struc-tural variants onto the haplotype scaffold one at a time (Box 1).
Overall, we discovered, genotyped, and phased 88 million variant sites
(Supplementary Table 3). The project has now contributed or
validated 80 million of the 100 million variants in the public dbSNP
catalogue (version 141 includes 40 million SNPs and indels newly
contributed by this analysis). These novel variants especially
enhance our catalogue of genetic variation within South Asian (which
account for 24% of novel variants) and African populations (28% of
novel variants).
To control the false discovery rate (FDR) of SNPs and indels at
,5%, a variant quality score threshold was defined using high depth
(.303) PCR-free sequence data generated for one individual per
population. For structural variants, additional orthogonal methods
were used for confirmation, including microarrays and long-read
sequencing, resulting in FDR , 5% for deletions, duplications,
multi-allelic copy-number variants, Alu and L1 insertions, and
,20% for inversions, SVA (SINE/VNTR/Alu) composite
retrotran-sposon insertions and NUMTs
8(nuclear mitochondrial DNA
var-iants). To evaluate variant discovery power and genotyping
accuracy, we also generated deep Complete Genomics data (mean
depth 5 473) for 427 individuals (129 mother–father–child trios,
12 parent–child duos, and 16 unrelateds). We estimate the power to
detect SNPs and indels to be .95% and .80%, respectively, for
variants with sample frequency of at least 0.5%, rising to .99% and
.85% for frequencies .1% (Extended Data Fig. 2). At lower
frequen-cies, comparison with .60,000 European haplotypes from the
Haplotype Reference Consortium
9suggests 75% power to detect
SNPs with frequency of 0.1%. Furthermore, we estimate heterozygous
genotype accuracy at 99.4% for SNPs and 99.0% for indels
(Supplementary Table 4), a threefold reduction in error rates
com-pared to our previous release
2, resulting from the larger sample size,
improvements in sequence data accuracy, and genotype calling and
phasing algorithms.
A typical genome
We find that a typical genome differs from the reference human
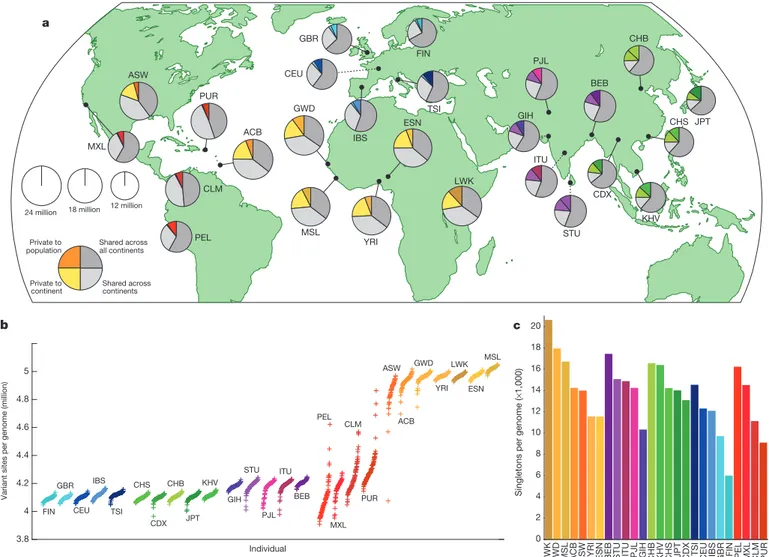
genome at 4.1 million to 5.0 million sites (Fig. 1b and Table 1).
Although .99.9% of variants consist of SNPs and short indels,
structural variants affect more bases: the typical genome contains
an estimated 2,100 to 2,500 structural variants (,1,000 large
dele-tions, ,160 copy-number variants, ,915 Alu inserdele-tions, ,128 L1
insertions, ,51 SVA insertions, ,4 NUMTs, and ,10 inversions),
affecting ,20 million bases of sequence.
6 8 | N A T U R E | V O L 5 2 6 | 1 O C T O B E R 2 0 1 5
*Lists of participants and their affiliations appear in the online version of the paper.
The total number of observed non-reference sites differs greatly
among populations (Fig. 1b). Individuals from African ancestry
populations harbour the greatest numbers of variant sites, as
pre-dicted by the out-of-Africa model of human origins. Individuals from
recently admixed populations show great variability in the number of
variants, roughly proportional to the degree of recent African ancestry
in their genomes.
The majority of variants in the data set are rare: ,64 million
auto-somal variants have a frequency ,0.5%, ,12 million have a frequency
between 0.5% and 5%, and only ,8 million have a frequency .5%
(Extended Data Fig. 3a). Nevertheless, the majority of variants observed
in a single genome are common: just 40,000 to 200,000 of the variants in
a typical genome (1–4%) have a frequency ,0.5% (Fig. 1c and
Extended Data Fig. 3b). As such, we estimate that improved rare variant
discovery by deep sequencing our entire sample would at least double
the total number of variants in our sample but increase the number of
variants in a typical genome by only ,20,000 to 60,000.
Putatively functional variation
When we restricted analyses to the variants most likely to affect gene
function, we found a typical genome contained 149–182 sites with
protein truncating variants, 10,000 to 12,000 sites with
peptide-sequence-altering variants, and 459,000 to 565,000 variant sites
over-lapping known regulatory regions (untranslated regions (UTRs),
promoters, insulators, enhancers, and transcription factor binding
sites). African genomes were consistently at the high end of these
ranges. The number of alleles associated with a disease or phenotype
in each genome did not follow this pattern of increased diversity in
Africa (Extended Data Fig. 4): we observed ,2,000 variants per
gen-ome associated with complex traits through gengen-ome-wide association
studies (GWAS) and 24–30 variants per genome implicated in rare
disease through ClinVar; with European ancestry genomes at the
high-end of these counts. The magnitude of this difference is unlikely
to be explained by demography
10,11, but instead reflects the ethnic bias
of current genetic studies. We expect that improved characterization
of the clinical and phenotypic consequences of non-European alleles
will enable better interpretation of genomes from all individuals and
populations.
Sharing of genetic variants among populations
Systematic analysis of the patterns in which genetic variants are
shared among individuals and populations provides detailed accounts
of population history. Although most common variants are shared
across the world, rarer variants are typically restricted to closely
related populations (Fig. 1a); 86% of variants were restricted to a
single continental group. Using a maximum likelihood approach
12,
we estimated the proportion of each genome derived from several
putative ‘ancestral populations’ (Fig. 2a and Extended Data Fig. 5).
ACB ASW BEB CDX CEU CHB CHS CLM ESN FIN GBR GIH GWD IBS ITU JPT KHV LWK MSL MXL PEL PJL PUR STU TSI YRI Private to population Private to continent Shared across continents Shared across all continents 18 million 12 million 24 million Individual
Variant sites per genome (million)
3.8 4 4.2 4.4 4.6 4.8 5 MSL ESN LWK YRI GWD ACB ASW PUR CLM MXL PEL BEB ITU PJL STU GIH KHV JPT CHB CDX CHS TSI IBS CEU GBR FIN
Singletons per genome (
× 1,000) 0 2 4 6 8 10 12 14 16 18 20
LWK GWD MSL ACB ASW YRI ESN BEB STU ITU PJL GIH CHB KHV CHS JPT CDX TSI CEU IBS GBR FIN PEL MXL CLM PUR
a
b
c
Figure 1
|
Population sampling. a, Polymorphic variants within sampled
populations. The area of each pie is proportional to the number of
poly-morphisms within a population. Pies are divided into four slices, representing
variants private to a population (darker colour unique to population), private to
a continental area (lighter colour shared across continental group), shared
across continental areas (light grey), and shared across all continents (dark
grey). Dashed lines indicate populations sampled outside of their ancestral
continental region. b, The number of variant sites per genome. c, The average
number of singletons per genome.
1 O C T O B E R 2 0 1 5 | V O L 5 2 6 | N A T U R E | 6 9 G2015 Macmillan Publishers Limited. All rights reserved
This analysis separates continental groups, highlights their internal
substructure, and reveals genetic similarities between related
popula-tions. For example, east–west clines are visible in Africa and East Asia,
a north–south cline is visible in Europe, and European, African,
and Native-American admixture is visible in genomes sampled in
the Americas.
To characterize more recent patterns of shared ancestry, we first
focused on variants observed on just two chromosomes (sample
fre-quency of 0.04%), the rarest shared variants within our sample, and
known as f
2variants
2. As expected, these variants are typically
geo-graphically restricted and much more likely to be shared between
individuals in the same population or continental group, or between
populations with known recent admixture (Extended Data Fig. 6a, b).
Analysis of shared haplotype lengths around f
2variants suggests a
median common ancestor ,296 generations ago (7,410 to 8,892 years
ago; Extended Data Fig. 6c, d), although those confined within a
population tend to be younger, with a shared common ancestor
,143 generations ago (3,570 to 4,284 years ago)
13.
Insights about demography
Modelling the distribution of variation within and between genomes
can provide insights about the history and demography of our
ancestor
populations
14.
We
used
the
pairwise
sequentially
Markovian coalescent (PSMC)
14method to characterize the effective
population size (N
e) of the ancestral populations (Fig. 2b and
Extended Data Fig. 7). Our results show a shared demographic history
for all humans beyond ,150,000 to 200,000 years ago. Further, they
show that European, Asian and American populations shared strong
and sustained bottlenecks, all with N
e,
1,500, between 15,000 to
20,000 years ago. In contrast, the bottleneck experienced by African
populations during the same time period appears less severe, with
N
e.
4,250. These bottlenecks were followed by extremely rapid
inferred population growth in non-African populations, with notable
exceptions including the PEL, MXL and FIN.
Due to the shared ancestry of all humans, only a modest number of
variants show large frequency differences among populations. We
observed 762,000 variants that are rare (defined as having frequency
,0.5%) within the global sample but much more common (.5%
frequency) in at least one population (Fig. 3a). Several populations
have relatively large numbers of these variants, and these are typically
genetically or geographically distinct within their continental group
(LWK in Africa, PEL in the Americas, JPT in East Asia, FIN in Europe,
and GIH in South Asia; see Supplementary Table 5). Drifted variants
within such populations may reveal phenotypic associations that
would be hard to identify in much larger global samples
15.
Analysis of the small set of variants with large frequency differences
between closely related populations can identify targets of recent,
localized adaptation. We used the F
ST-based population branch
stat-istic (PBS)
16to identify genes with strong differentiation between
pairs of populations in the same continental group (Fig. 3b). This
approach reveals a number of previously identified selection signals
(such as SLC24A5 associated with skin pigmentation
17, HERC2
assoc-iated with eye colour
18, LCT associated with lactose tolerance, and the
FADS cluster that may be associated with dietary fat sources
19).
Several potentially novel selection signals are also highlighted (such
as TRBV9, which appears particularly differentiated in South Asia,
PRICKLE4, differentiated in African and South Asian populations,
and a number of genes in the immunoglobulin cluster, differentiated
in East Asian populations; Extended Data Fig. 8), although at least
some of these signals may result from somatic rearrangements (for
example, via V(D)J recombination) and differences in cell type
com-position among the sequenced samples. Nonetheless, the relatively
small number of genes showing strong differentiation between closely
related populations highlights the rarity of strong selective sweeps in
recent human evolution
20.
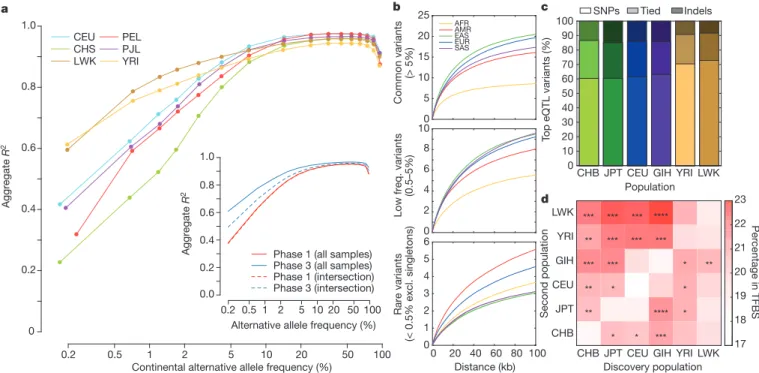
Sharing of haplotypes and imputation
The sharing of haplotypes among individuals is widely used for
imputation in GWAS, a primary use of 1000 Genomes data. To assess
imputation based on the phase 3 data set, we used Complete
Genomics data for 9 or 10 individuals from each of 6 populations
(CEU, CHS, LWK, PEL, PJL, and YRI). After excluding these
indivi-duals from the reference panel, we imputed genotypes across the
genome using sites on a typical one million SNP microarray. The
squared correlation between imputed and experimental genotypes
was .95% for common variants in each population, decreasing
gradually with minor allele frequency (Fig. 4a). Compared to phase
1, rare variation imputation improved considerably, particularly for
newly sampled populations (for example, PEL and PJL, Extended
Data Fig. 9a). Improvements in imputations restricted to overlapping
samples suggest approximately equal contributions from greater
genotype and sequence quality and from increased sample size
(Fig. 4a, inset). Imputation accuracy is now similar for bi-allelic
SNPs, bi-allelic indels, multi-allelic SNPs, and sites where indels
and SNPs overlap, but slightly reduced for multi-allelic indels, which
typically map to regions of low-complexity sequence and are much
harder to genotype and phase (Extended Data Fig. 9b). Although
imputation of rare variation remains challenging, it appears to be
BOX 1
Building a haplotype scaffold
To construct high quality haplotypes that integrate multiple variant
types, we adopted a staged approach37. (1) A high-quality ‘haplotype
scaffold’ was constructed using statistical methods applied to SNP microarray genotypes (black circles) and, where available, genotypes for first degree relatives (available for ,52% of samples;
Supplementary Table 11)38. (2a) Variant sites were identified using a
combination of bioinformatic tools and pipelines to define a set of high-confidence bi-allelic variants, including both SNPs and indels (white triangles), which were jointly imputed onto the haplotype scaffold. (2b) Multi-allelic SNPs, indels, and complex variants (represented by yellow shapes, or variation in copy number) were placed onto the haplotype scaffold one at a time, exploiting the local linkage disequilibrium information but leaving haplotypes for other
variants undisturbed39. (3) The biallelic and multi-allelic haplotypes
were merged into a single haplotype representation. This multi-stage approach allows the long-range structure of the haplotype scaffold to be maintained while including more complex types of variation. Comparison to haplotypes constructed from fosmids suggests the average distance between phasing errors is ,1,062 kb, with typical phasing errors stretching ,37 kb (Supplementary Table 12).
(1) Construction of haplotype scaffold from SNP microarray genotypes, using trio data where available.
(2a) Joint genotyping and statistical phasing of biallelic variants from sequence data onto haplotype scaffold.
(2b) Independent genotyping and phasing of multi-allelic and complex variants onto haplotype scaffold.
(3) Integration of variant calls into unified haplotypes.
7 0 | N A T U R E | V O L 5 2 6 | 1 O C T O B E R 2 0 1 5
most accurate in African ancestry populations, where greater genetic
diversity results in a larger number of haplotypes and improves the
chances that a rare variant is tagged by a characteristic haplotype.
Resolution of genetic association studies
To evaluate the impact of our new reference panel on GWAS, we
re-analysed a previous study of age-related macular degeneration
(AMD) totalling 2,157 cases and 1,150 controls
21. We imputed
17.0 million genetic variants with estimated R
2.
0.3, compared to
14.1 million variants using phase 1, and only 2.4 million SNPs using
HapMap2. Compared to phase 1, the number of imputed common
and intermediate frequency variants increased by 7%, whereas the
number of rare variants increased by .50%, and the number of indels
increased by 70% (Supplementary Table 6). We permuted
case-con-trol labels to estimate a genome-wide significance threshold of
P , ,1.5 3 10
28, which corresponds to ,3 million independent
var-iants and is more stringent than the traditional threshold of 5 3 10
28(Supplementary Table 7). In practice, significance thresholds must
balance false positives and false negatives
22–24. We recommend that
thresholds aiming for strict control of false positives should be
deter-mined using permutations. We expect thresholds to become more
stringent when larger sample sizes are sequenced, when diverse
sam-ples are studied, or when genotyping and imputation is replaced with
direct sequencing. After imputation, five independent signals in four
previously reported AMD loci
25–28reached genome-wide significance
(Supplementary Table 8). When we examined each of these to define a
set of potentially causal variants using a Bayesian Credible set
approach
29, lists of potentially functional variants were ,43 larger
than in HapMap2-based analysis and 7% larger than in analyses based
on phase 1 (Supplementary Table 9). In the ARMS2/HTRA1 locus, the
most strongly associated variant was now a structural variant
(esti-mated imputation R
25
0.89) that previously could not be imputed,
consistent with some functional studies
30. Deep catalogues of
poten-tially functional variants will help ensure that downstream functional
analyses include the true candidate variants, and will aid analyses that
integrate complex disease associations with functional genomic
ele-ments
31.
The performance of imputation and GWAS studies depends on the
local distribution of linkage disequilibrium (LD) between nearby
var-iants. Controlling for sample size, the decay of LD as a function of
physical distance is fastest in African populations and slowest in East
Asian populations (Extended Data Fig. 10). To evaluate how these
differences influence the resolution of genetic association studies and,
Table 1
|
Median autosomal variant sites per genomeAFR AMR EAS EUR SAS
Samples 661 347 504 503 489
Mean coverage 8.2 7.6 7.7 7.4 8.0
Var. sites Singletons Var. sites Singletons Var. sites Singletons Var. sites Singletons Var. sites Singletons
SNPs 4.31M 14.5k 3.64M 12.0k 3.55M 14.8k 3.53M 11.4k 3.60M 14.4k Indels 625k - 557k - 546k - 546k - 556k -Large deletions 1.1k 5 949 5 940 7 939 5 947 5 CNVs 170 1 153 1 158 1 157 1 165 1 MEI (Alu) 1.03k 0 845 0 899 1 919 0 889 0 MEI (L1) 138 0 118 0 130 0 123 0 123 0 MEI (SVA) 52 0 44 0 56 0 53 0 44 0 MEI (MT) 5 0 5 0 4 0 4 0 4 0 Inversions 12 0 9 0 10 0 9 0 11 0 Nonsynon 12.2k 139 10.4k 121 10.2k 144 10.2k 116 10.3k 144 Synon 13.8k 78 11.4k 67 11.2k 79 11.2k 59 11.4k 78 Intron 2.06M 7.33k 1.72M 6.12k 1.68M 7.39k 1.68M 5.68k 1.72M 7.20k UTR 37.2k 168 30.8k 136 30.0k 169 30.0k 129 30.7k 168 Promoter 102k 430 84.3k 332 81.6k 425 82.2k 336 84.0k 430 Insulator 70.9k 248 59.0k 199 57.7k 252 57.7k 189 59.1k 243 Enhancer 354k 1.32k 295k 1.05k 289k 1.34k 288k 1.02k 295k 1.31k TFBSs 927 4 759 3 748 4 749 3 765 3 Filtered LoF 182 4 152 3 153 4 149 3 151 3 HGMD-DM 20 0 18 0 16 1 18 2 16 0 GWAS 2.00k 0 2.07k 0 1.99k 0 2.08k 0 2.06k 0 ClinVar 28 0 30 1 24 0 29 1 27 1
See Supplementary Table 1 for continental population groupings. CNVs, copy-number variants; HGMD-DM, Human Gene Mutation Database disease mutations; k, thousand; LoF, loss-of-function; M, million; MEI, mobile element insertions.
Time (scaled in units of 2μT)
Population size (scaled in units of 4
μN e × 10 3) 0 0.2 0.4 0.6 0.8 1 1.2 1.4 1.6 1.8
Time, assuming μ = 1.25×10⁻⁸ to 1.5×10⁻⁸ per bp per generation and 20–30 years per generation
7–12 kya 33–60 kya 67–120 kya 333–600 kya 10–5 5×10⁻⁵ 10–4 5×10⁻⁴ CDX ESN MSL YRI CLM MXL PEL PUR CHB CHS JPT KHV CEU FIN GBR IBS TSI BEB GIH ITU PJL STU ACB ASW GWD LWK
a
b
ACBASWCLM CEU BEBCDX CHSCHB ESN GWD IBSGBR FIN GIHITU KHV JPT LWK YRIMSL MXLPURPELTSI PJL STU
Figure 2
|
Population structure and demography. a, Population structure
inferred using a maximum likelihood approach with 8 clusters. b, Changes
to effective population sizes over time, inferred using PSMC. Lines represent
the within-population median PSMC estimate, smoothed by fitting a cubic
spline passing through bin midpoints.
1 O C T O B E R 2 0 1 5 | V O L 5 2 6 | N A T U R E | 7 1 G2015 Macmillan Publishers Limited. All rights reserved
in particular, their ability to identify a narrow set of candidate
func-tional variants, we evaluated the number of tagging variants (r
2.
0.8)
for a typical variant in each population. We find that each common
variant typically has over 15–20 tagging variants in non-African
populations, but only about 8 in African populations (Fig. 4b). At
lower frequencies, we find 3–6 tagging variants with 100 kb of variants
with frequency ,0.5%, and differences in the number of tagging
variants between continental groups are less marked.
Among variants in the GWAS catalogue (which have an average
frequency of 26.6% in project haplotypes), the number of proxies
averages 14.4 in African populations and 30.3–44.4 in other
contin-ental groupings (Supplementary Table 10). The potential value of
Common variants (> 5%) 0 5 10 15 20 25 AFR AMR EAS EUR SAS
Low freq. variants
(0.5–5%) 0 2 4 6 8 10 Rare variants (< 0.5% excl. singletons) 0 1 2 3 4 5 6 Distance (kb) 80 100 60 40 20 0
a
b
c
d
0.2 0.5 1 2 5 10 20 50 100 100 Aggregate R 2 0 0.2 0.4 0.6 0.8 1.0 CEU CHS LWK PEL PJL YRIContinental alternative allele frequency (%) Discovery population
Second population
Population
Top eQTL variants (%)
SNPs Tied Indels 17 18 19 20 21 22 23 Per centage in TFBS Aggregate R 2 0.2 0.5 1 2 5 10 20 50 100 0.0 0.2 0.4 0.6 0.8 1.0
Alternative allele frequency (%) Phase 1 (all samples) Phase 3 (all samples) Phase 1 (intersection) Phase 3 (intersection) 90 80 70 60 50 40 30 20 10 0 LWK YRI GIH CEU JPT CHB
CHB JPT CEU GIH YRI LWK CHB JPT CEU GIH YRI LWK
*** *** *** *** ** ** ** * * * * * * ** *** *** *** *** *** **** ****
Figure 4
|
Imputation and eQTL discovery. a, Imputation accuracy as a
function of allele frequency for six populations. The insert compares
imputation accuracy between phase 3 and phase 1, using all samples (solid
lines) and intersecting samples (dashed lines). b, The average number of
tagging variants (r
2.
0.8) as a function of physical distance for common (top),
low frequency (middle), and rare (bottom) variants. c, The proportion of top
eQTL variants that are SNPs and indels, as discovered in 69 samples from
each population. d, The percentage of eQTLs in TFBS, having performed
discovery in the first population, and fine mapped by including an additional 69
samples from a second population (*P , 0.01, **P , 0.001, ***P , 0.0001,
McNemar’s test). The diagonal represents the percentage of eQTLs in TFBS
using the original discovery sample.
Number of exonic SNPs in gene
10 50 100 500 Maximum normalized PBS 0 10 20 30 40 50 60 70 80 ABCC11 CABP1 CCNT2 CLDN10 CMYA5 FADS1 FADS2 FLG HERC2 IGHA1 IGHA2 IGHE IGHG1 IGHG2 IGHG3 IGHG4 LCT LILRB2 LRP1 MYRF NMNAT2 PRAMEF11 PRICKLE4 R3HDM1 SH3BGR SLC24A5 SLC45A2 TCHH TMEM121 TRBV9 ACB ASW ESN GWD LWK MSL YRI CLM MXL PEL PUR CDX CHB CHS JPT KHV CEU FIN GBR IBS TSI BEB GIH ITU PJL STU 0 50 100 150 200 LWK MSL GWD ESN YRI ACB ASW PEL MXL CLM PUR JPT CDX KHV CHB CHS FIN CEU GBR IBS TSI GIH ITU STU PJL BEB Variants (thousands)
a
b
1 5Figure 3
|
Population differentiation. a, Variants found to be rare (,0.5%)
within the global sample, but common (.5%) within a population. b, Genes
showing strong differentiation between pairs of closely related populations.
The vertical axis gives the maximum obtained value of the F
ST-based
population branch statistic (PBS), with selected genes coloured to indicate
the population in which the maximum value was achieved.
7 2 | N A T U R E | V O L 5 2 6 | 1 O C T O B E R 2 0 1 5
multi-population fine-mapping is illustrated by the observation that
the number of proxies shared across all populations is only 8.2 and,
furthermore, that 34.9% of GWAS catalogue variants have no proxy
shared across all continental groupings.
To further assess prospects for fine-mapping genetic association
signals, we performed expression quantitative trait loci (eQTL)
dis-covery at 17,667 genes in 69 samples from each of 6 populations
(CEU, CHB, GIH, JPT, LWK, and YRI)
32. We identified eQTLs for
3,285 genes at 5% FDR (average 1,265 genes per population). Overall,
a typical eQTL signal comprised 67 associated variants, including an
indel as one of the top associated variants 26–40% of the time (Fig. 4c).
Within each discovery population, 17.5–19.5% of top eQTL variants
overlapped annotated transcription factor binding sites (TFBSs),
con-sistent with the idea that a substantial fraction of eQTL
polymorph-isms are TFBS polymorphpolymorph-isms. Using a meta-analysis approach to
combine pairs of populations, the proportion of top eQTL variants
overlapping TFBSs increased to 19.2–21.6% (Fig. 4d), consistent with
improved localization. Including an African population provided the
greatest reduction in the count of associated variants and the greatest
increase in overlap between top variants and TFBSs.
Discussion
Over the course of the 1000 Genomes Project there have been
sub-stantial advances in sequence data generation, archiving and analysis.
Primary sequence data production improved with increased read
length and depth, reduced per-base errors, and the introduction of
paired-end sequencing. Sequence analysis methods improved with
the development of strategies for identifying and filtering
poor-qual-ity data, for more accurate mapping of sequence reads (particularly in
repetitive regions), for exchanging data between analysis tools and
enabling ensemble analyses, and for capturing more diverse types of
variants. Importantly, each release has examined larger numbers of
individuals, aiding population-based analyses that identify and
lever-age shared haplotypes during genotyping. Whereas our first analyses
produced high-confidence short-variant calls for 80–85% of the
ref-erence genome
1, our newest analyses reach ,96% of the genome
using the same metrics, although our ability to accurately capture
structural variation remains more limited
33. In addition, the evolution
of sequencing, analysis and filtering strategies means that our results
are not a simple superset of previous analysis. Although the number of
characterized variants has more than doubled relative to phase 1,
,2.3 million previously described variants are not included in the
current analysis; most missing variants were rare or marked as low
quality: 1.6 million had frequency ,0.5% and may be missing from
our current read set, while the remainder were removed by our
filter-ing processes.
These same technical advances are enabling the application of
whole genome sequencing to a variety of medically important
sam-ples. Some of these studies already exceed the 1000 Genomes Project
in size
34–36, but the results described here remain a prime resource for
studies of genetic variation for several reasons. First, the 1000
Genomes Project samples provide a broad representation of human
genetic variation—in contrast to the bulk of complex disease studies
in humans, which primarily study European ancestry samples and
which, as we show, fail to capture functionally important variation in
other populations. Second, the project analyses incorporate multiple
analysis strategies, callsets and variant types. Although such ensemble
analyses are cumbersome, they provide a benchmark for what can be
achieved and a yardstick against which more practical analysis
strat-egies can be evaluated. Third, project samples and data resulting from
them can be shared broadly, enabling sequencing strategies and
ana-lysis methods to be compared easily on a benchmark set of samples.
Because of the wide availability of the data and samples, these samples
have been and will continue to be used for studying many molecular
phenotypes. Thus, we predict that the samples will accumulate many
types of data that will allow connections to be drawn between variants
and both molecular and disease phenotypes.
Online Content Methods, along with any additional Extended Data display items and Source Data, are available in the online version of the paper; references unique to these sections appear only in the online paper.
Received 12 May; accepted 20 August 2015.
1. The 1000 Genomes Project Consortium. A map of human genome variation from population-scale sequencing. Nature467, 1061–1073 (2010).
2. The 1000 Genomes Project Consortium. An integrated map of genetic variation from 1,092 human genomes. Nature491, 56–65 (2012).
3. Voight, B. F. et al. The metabochip, a custom genotyping array for genetic studies of metabolic, cardiovascular, and anthropometric traits. PLoS Genet.8, e1002793 (2012).
4. Trynka, G. et al. Dense genotyping identifies and localizes multiple common and rare variant association signals in celiac disease. Nature Genet.43, 1193–1201 (2011).
5. Howie, B., Fuchsberger, C., Stephens, M., Marchini, J. & Abecasis, G. R. Fast and accurate genotype imputation in genome-wide association studies through pre-phasing. Nature Genet.44, 955–959 (2012).
6. Xue, Y. et al. Deleterious- and disease-allele prevalence in healthy individuals: insights from current predictions, mutation databases, and population-scale resequencing. Am. J. Hum. Genet.91, 1022–1032 (2012).
7. Jung, H., Bleazard, T., Lee, J. & Hong, D. Systematic investigation of cancer-associated somatic point mutations in SNP databases. Nature Biotechnol.31, 787–789 (2013).
8. Sudmant, P. H. et al. An integrated map of structural variation in 2,504 human genomes. Nature http://dx.doi.org/10.1038/nature15394 (this issue). 9. The Haplotype Reference Consortium
(http://www.haplotype-reference-consortium.org/).
10. Simons, Y. B., Turchin, M. C., Pritchard, J. K. & Sella, G. The deleterious mutation load is insensitive to recent population history. Nature Genet.46, 220–224 (2014). 11. Do, R. et al. No evidence that selection has been less effective at removing
deleterious mutations in Europeans than in Africans. Nature Genet.47, 126–131 (2015).
12. Alexander, D. H., Novembre, J. & Lange, K. Fast model-based estimation of ancestry in unrelated individuals. Genome Res.19, 1655–1664 (2009).
13. Mathieson, I. & McVean, G. Demography and the age of rare variants. PLoS Genet. 10, e1004528 (2014).
14. Li, H. & Durbin, R. Inference of human population history from individual whole-genome sequences. Nature475, 493–496 (2011).
15. Moltke, I. et al. A common Greenlandic TBC1D4 variant confers muscle insulin resistance and type 2 diabetes. Nature512, 190–193 (2014).
16. Yi, X. et al. Sequencing of 50 human exomes reveals adaptation to high altitude. Science329, 75–78 (2010).
17. Lamason, R. L. et al. SLC24A5, a putative cation exchanger, affects pigmentation in zebrafish and humans. Science310, 1782–1786 (2005).
18. Eiberg, H. et al. Blue eye color in humans may be caused by a perfectly associated founder mutation in a regulatory element located within the HERC2 gene inhibiting OCA2 expression. Hum. Genet.123, 177–187 (2008).
19. Mathias, R. A. et al. Adaptive evolution of the FADS gene cluster within Africa. PLoS ONE7, e44926 (2012).
20. Hernandez, R. D. et al. Classic selective sweeps were rare in recent human evolution. Science331, 920–924 (2011).
21. Chen, W. et al. Genetic variants near TIMP3 and high-density lipoprotein-associated loci influence susceptibility to age-related macular degeneration. Proc. Natl Acad. Sci. USA107, 7401–7406 (2010).
22. Wakefield, J. Bayes factors for genome-wide association studies: comparison with P-values. Genet. Epidemiol.33, 79–86 (2009).
23. Wakefield, J. Commentary: genome-wide significance thresholds via Bayes factors. Int. J. Epidemiol.41, 286–291 (2012).
24. Sham, P. C. & Purcell, S. M. Statistical power and significance testing in large-scale genetic studies. Nature Rev. Genet.15, 335–346 (2014).
25. Gold, B. et al. Variation in factor B (BF) and complement component 2 (C2) genes is associated with age-related macular degeneration. Nature Genet.38, 458–462 (2006).
26. Klein, R. J. et al. Complement factor H polymorphism in age-related macular degeneration. Science308, 385–389 (2005).
27. Rivera, A. et al. Hypothetical LOC387715 is a second major susceptibility gene for age-related macular degeneration, contributing independently of complement factor H to disease risk. Hum. Mol. Genet.14, 3227–3236 (2005).
28. Yates, J. R. et al. Complement C3 variant and the risk of age-related macular degeneration. N. Engl. J. Med.357, 553–561 (2007).
29. Maller, J. B. et al. Bayesian refinement of association signals for 14 loci in 3 common diseases. Nature Genet.44, 1294–1301 (2012).
30. Fritsche, L. G. et al. Age-related macular degeneration is associated with an unstable ARMS2 (LOC387715) mRNA. Nature Genet.40, 892–896 (2008). 31. The ENCODE Project Consortium. An integrated encyclopedia of DNA elements in
the human genome. Nature489, 57–74 (2012).
32. Stranger, B. E. et al. Patterns of cis regulatory variation in diverse human populations. PLoS Genet.8, e1002639 (2012).
33. Chaisson, M. J. et al. Resolving the complexity of the human genome using single-molecule sequencing. Nature517, 608–611 (2015).
1 O C T O B E R 2 0 1 5 | V O L 5 2 6 | N A T U R E | 7 3 G2015 Macmillan Publishers Limited. All rights reserved
34. Gudbjartsson, D. F. et al. Large-scale whole-genome sequencing of the Icelandic population. Nature Genet.47, 435–444 (2015).
35. The UK10K Consortium. The UK10K project identifies rare variants in health and disease. Nature http://dx.doi.org/10.1038/nature14962 (2015).
36. Sidore, C. et al. Genome sequencing elucidates Sardinian genetic architecture and augments association analyses for lipid and blood inflammatory markers. Nature Genet. http://dx.doi.org/10.1038/ng3368 (2015).
37. Delaneau, O. & Marchini, J. The 1000 Genomes Project Consortium. Integrating sequence and array data to create an improved 1000 Genomes Project haplotype reference panel. Nature Commun.5, 3934 (2014).
38. O’Connell, J. et al. A general approach for haplotype phasing across the full spectrum of relatedness. PLoS Genet.10, e1004234 (2014).
39. Menelaou, A. & Marchini, J. Genotype calling and phasing using next-generation sequencing reads and a haplotype scaffold. Bioinformatics29, 84–91 (2013). Supplementary Information is available in the online version of the paper. Acknowledgements We thank the many people who were generous with contributing their samples to the project: the African Caribbean in Barbados; Bengali in Bangladesh; British in England and Scotland; Chinese Dai in Xishuangbanna, China; Colombians in Medellin, Colombia; Esan in Nigeria; Finnish in Finland; Gambian in Western Division – Mandinka; Gujarati Indians in Houston, Texas, USA; Han Chinese in Beijing, China; Iberian populations in Spain; Indian Telugu in the UK; Japanese in Tokyo, Japan; Kinh in Ho Chi Minh City, Vietnam; Luhya in Webuye, Kenya; Mende in Sierra Leone; people with African ancestry in the southwest USA; people with Mexican ancestry in Los Angeles, California, USA; Peruvians in Lima, Peru; Puerto Ricans in Puerto Rico; Punjabi in Lahore, Pakistan; southern Han Chinese; Sri Lankan Tamil in the UK; Toscani in Italia; Utah residents (CEPH) with northern and western European ancestry; and Yoruba in Ibadan, Nigeria. Many thanks to the people who contributed to this project: P. Maul, T. Maul, and C. Foster; Z. Chong, X. Fan, W. Zhou, and T. Chen; N. Sengamalay, S. Ott, L. Sadzewicz, J. Liu, and L. Tallon; L. Merson; O. Folarin, D. Asogun, O. Ikpwonmosa, E. Philomena, G. Akpede, S. Okhobgenin, and O. Omoniwa; the staff of the Institute of Lassa Fever Research and Control (ILFRC), Irrua Specialist Teaching Hospital, Irrua, Edo State, Nigeria; A. Schlattl and T. Zichner; S. Lewis, E. Appelbaum, and L. Fulton; A. Yurovsky and I. Padioleau; N. Kaelin and F. Laplace; E. Drury and H. Arbery; A. Naranjo, M. Victoria Parra, and C. Duque; S. Do¨kel, B. Lenz, and S. Schrinner; S. Bumpstead; and C. Fletcher-Hoppe. Funding for this work was from the Wellcome Trust Core Award 090532/Z/09/Z and Senior Investigator Award 095552/Z/11/Z (P.D.), and grants WT098051 (R.D.), WT095908 and WT109497 (P.F.), WT086084/Z/08/Z and WT100956/Z/13/Z (G.M.), WT097307 (W.K.), WT0855322/Z/08/Z (R.L.), WT090770/Z/09/Z (D.K.), the Wellcome Trust Major Overseas program in Vietnam grant 089276/Z.09/Z (S.D.), the Medical Research Council UK grant G0801823 (J.L.M.), the UK Biotechnology and Biological Sciences Research Council grants BB/I02593X/1 (G.M.) and BB/I021213/1 (A.R.L.), the British Heart Foundation (C.A.A.), the Monument Trust (J.H.), the European Molecular Biology Laboratory (P.F.), the European Research Council grant 617306 (J.L.M.), the Chinese 863 Program 2012AA02A201, the National Basic Research program of China 973 program no. 2011CB809201, 2011CB809202 and 2011CB809203, Natural Science Foundation of China 31161130357, the Shenzhen Municipal Government of China grant ZYC201105170397A (J.W.), the Canadian Institutes of Health Research
Operating grant 136855 and Canada Research Chair (S.G.), Banting Postdoctoral Fellowship from the Canadian Institutes of Health Research (M.K.D.), a Le Fonds de Recherche du Que´bec-Sante´ (FRQS) research fellowship (A.H.), Genome Quebec (P.A.), the Ontario Ministry of Research and Innovation – Ontario Institute for Cancer Research Investigator Award (P.A., J.S.), the Quebec Ministry of Economic Development, Innovation, and Exports grant PSR-SIIRI-195 (P.A.), the German Federal Ministry of Education and Research (BMBF) grants 0315428A and 01GS08201 (R.H.), the Max Planck Society (H.L., G.M., R.S.), BMBF-EPITREAT grant 0316190A (R.H., M.L.), the German Research Foundation (Deutsche Forschungsgemeinschaft) Emmy Noether Grant KO4037/1-1 (J.O.K.), the Beatriu de Pinos Program grants 2006 BP-A 10144 and 2009 BP-B 00274 (M.V.), the Spanish National Institute for Health Research grant PRB2 IPT13/0001-ISCIII-SGEFI/FEDER (A.O.), Ewha Womans University (C.L.), the Japan Society for the Promotion of Science Fellowship number PE13075 (N.P.), the Louis Jeantet Foundation (E.T.D.), the Marie Curie Actions Career Integration grant 303772 (C.A.), the Swiss National Science Foundation 31003A_130342 and NCCR “Frontiers in Genetics” (E.T.D.), the University of Geneva (E.T.D., T.L., G.M.), the US National Institutes of Health National Center for Biotechnology Information (S.S.) and grants U54HG3067 (E.S.L.), U54HG3273 and U01HG5211 (R.A.G.), U54HG3079 (R.K.W., E.R.M.), R01HG2898 (S.E.D.), R01HG2385 (E.E.E.), RC2HG5552 and U01HG6513 (G.T.M., G.R.A.), U01HG5214 (A.C.), U01HG5715 (C.D.B.), U01HG5718 (M.G.), U01HG5728 (Y.X.F.), U41HG7635 (R.K.W., E.E.E., P.H.S.), U41HG7497 (C.L., M.A.B., K.C., L.D., E.E.E., M.G., J.O.K., G.T.M., S.A.M., R.E.M., J.L.S., K.Y.), R01HG4960 and R01HG5701 (B.L.B.), R01HG5214 (G.A.), R01HG6855 (S.M.), R01HG7068 (R.E.M.), R01HG7644 (R.D.H.), DP2OD6514 (P.S.), DP5OD9154 (J.K.), R01CA166661 (S.E.D.), R01CA172652 (K.C.), P01GM99568 (S.R.B.), R01GM59290 (L.B.J., M.A.B.), R01GM104390 (L.B.J., M.Y.Y.), T32GM7790 (C.D.B., A.R.M.), P01GM99568 (S.R.B.), R01HL87699 and R01HL104608 (K.C.B.), T32HL94284 (J.L.R.F.), and contracts HHSN268201100040C (A.M.R.) and HHSN272201000025C (P.S.), Harvard Medical School Eleanor and Miles Shore Fellowship (K.L.), Lundbeck Foundation Grant R170-2014-1039 (K.L.), NIJ Grant 2014-DN-BX-K089 (Y.E.), the Mary Beryl Patch Turnbull Scholar Program (K.C.B.), NSF Graduate Research Fellowship DGE-1147470 (G.D.P.), the Simons Foundation SFARI award SF51 (M.W.), and a Sloan Foundation Fellowship (R.D.H.). E.E.E. is an investigator of the Howard Hughes Medical Institute. Author Contributions Details of author contributions can be found in the author list. Author Information Reprints and permissions information is available at
www.nature.com/reprints. The authors declare competing financial interests: details are available in the online version of the paper. Readers are welcome to comment on the online version of the paper. Correspondence and requests for materials should be addressed to A.A. ([email protected]) or G.R.A. ([email protected]).
This work is licensed under a Creative Commons Attribution-NonCommercial-ShareAlike 3.0 Unported licence. The images or other third party material in this article are included in the article’s Creative Commons licence, unless indicated otherwise in the credit line; if the material is not included under the Creative Commons licence, users will need to obtain permission from the licence holder to reproduce the material. To view a copy of this licence, visit http://creativecommons. org/licenses/by-nc-sa/3.0
7 4 | N A T U R E | V O L 5 2 6 | 1 O C T O B E R 2 0 1 5
The 1000 Genomes Project Consortium (Participants are arranged by project role, then by institution alphabetically, and finally alphabetically within institutions except for Principal Investigators and Project Leaders, as indicated.)
Corresponding authors Adam Auton1, Gonçalo R. Abecasis2
Steering committee: David M. Altshuler3(Co-Chair), Richard M. Durbin4(Co-Chair),
Gonçalo R. Abecasis2, David R. Bentley5, Aravinda Chakravarti6, Andrew G. Clark7, Peter
Donnelly8,9, Evan E. Eichler10,11, Paul Flicek12, Stacey B. Gabriel13, Richard A. Gibbs14,
Eric D. Green15, Matthew E. Hurles4, Bartha M. Knoppers16, Jan O. Korbel12,17, Eric S.
Lander13, Charles Lee18,19, Hans Lehrach20,21, Elaine R. Mardis22, Gabor T. Marth23, Gil
A. McVean8,9, Deborah A. Nickerson10, Jeanette P. Schmidt24, Stephen T. Sherry25, Jun
Wang26,27,28,29,30, Richard K. Wilson22
Production group: Baylor College of Medicine Richard A. Gibbs14(Principal
Investigator), Eric Boerwinkle14, Harsha Doddapaneni14, Yi Han14, Viktoriya
Korchina14, Christie Kovar14, Sandra Lee14, Donna Muzny14, Jeffrey G. Reid14, Yiming
Zhu14;BGI-Shenzhen Jun Wang26,27,28,29,30(Principal Investigator), Yuqi Chang26,
Qiang Feng26,27, Xiaodong Fang26,27, Xiaosen Guo26,27, Min Jian26,27, Hui Jiang26,27, Xin
Jin26, Tianming Lan26, Guoqing Li26, Jingxiang Li26, Yingrui Li26, Shengmao Liu26, Xiao
Liu26,27, Yao Lu26, Xuedi Ma26, Meifang Tang26, Bo Wang26, Guangbiao Wang26,
Honglong Wu26, Renhua Wu26, Xun Xu26, Ye Yin26, Dandan Zhang26, Wenwei Zhang26,
Jiao Zhao26, Meiru Zhao26, Xiaole Zheng26;Broad Institute of MIT and Harvard Eric S. Lander13(Principal Investigator), David M. Altshuler3, Stacey B. Gabriel13(Co-Chair), Namrata Gupta13;Coriell Institute for Medical Research Neda Gharani31, Lorraine H.
Toji31, Norman P. Gerry31, Alissa M. Resch31;European Molecular Biology Laboratory,
European Bioinformatics Institute Paul Flicek12(Principal Investigator), Jonathan
Barker12, Laura Clarke12, Laurent Gil12, Sarah E. Hunt12, Gavin Kelman12, Eugene
Kulesha12, Rasko Leinonen12, William M. McLaren12, Rajesh Radhakrishnan12, Asier
Roa12, Dmitriy Smirnov12, Richard E. Smith12, Ian Streeter12, Anja Thormann12, Iliana
Toneva12, Brendan Vaughan12, Xiangqun Zheng-Bradley12;Illumina David R. Bentley5
(Principal Investigator), Russell Grocock5, Sean Humphray5, Terena James5, Zoya
Kingsbury5;Max Planck Institute for Molecular Genetics Hans Lehrach20,21(Principal
Investigator), Ralf Sudbrak32(Project Leader), Marcus W. Albrecht33, Vyacheslav S.
Amstislavskiy20, Tatiana A. Borodina33, Matthias Lienhard20, Florian Mertes20, Marc
Sultan20, Bernd Timmermann20, Marie-Laure Yaspo20;McDonnell Genome Institute
at Washington University Elaine R. Mardis22(Co-Principal Investigator) (Co-Chair),
Richard K. Wilson22(Co-Principal Investigator), Lucinda Fulton22, Robert Fulton22;US
National Institutes of Health Stephen T. Sherry25(Principal Investigator), Victor
Ananiev25, Zinaida Belaia25, Dimitriy Beloslyudtsev25, Nathan Bouk25, Chao Chen25,
Deanna Church34, Robert Cohen25, Charles Cook25, John Garner25, Timothy
Hefferon25, Mikhail Kimelman25, Chunlei Liu25, John Lopez25, Peter Meric25, Chris
O’Sullivan35, Yuri Ostapchuk25, Lon Phan25, Sergiy Ponomarov25, Valerie Schneider25,
Eugene Shekhtman25, Karl Sirotkin25, Douglas Slotta25, Hua Zhang25;University of
Oxford Gil A. McVean8,9(Principal Investigator);Wellcome Trust Sanger Institute
Richard M. Durbin4(Principal Investigator), Senduran Balasubramaniam4, John
Burton4, Petr Danecek4, Thomas M. Keane4, Anja Kolb-Kokocinski4, Shane McCarthy4, James Stalker4, Michael Quail4
Analysis group: Affymetrix Jeanette P. Schmidt24(Principal Investigator), Christopher
J. Davies24, Jeremy Gollub24, Teresa Webster24, Brant Wong24, Yiping Zhan24;Albert
Einstein College of Medicine Adam Auton1(Principal Investigator), Christopher L.
Campbell1, Yu Kong1, Anthony Marcketta1;Baylor College of Medicine Richard A.
Gibbs14(Principal Investigator), Fuli Yu14(Project Leader), Lilian Antunes14, Matthew
Bainbridge14, Donna Muzny14, Aniko Sabo14, Zhuoyi Huang14;BGI-Shenzhen
Jun Wang26,27,28,29,30(Principal Investigator), Lachlan J. M. Coin26, Lin Fang26,27,
Xiaosen Guo26, Xin Jin26, Guoqing Li26, Qibin Li26, Yingrui Li26, Zhenyu Li26, Haoxiang
Lin26, Binghang Liu26, Ruibang Luo26, Haojing Shao26, Yinlong Xie26, Chen Ye26, Chang
Yu26, Fan Zhang26, Hancheng Zheng26, Hongmei Zhu26;Bilkent University Can
Alkan36, Elif Dal36, Fatma Kahveci36;Boston College Gabor T. Marth23(Principal
Investigator), Erik P. Garrison4(Project Lead), Deniz Kural37, Wan-Ping Lee37, Wen Fung
Leong38, Michael Stromberg39, Alistair N. Ward23, Jiantao Wu39, Mengyao Zhang40;
Broad Institute of MIT and Harvard Mark J. Daly13(Principal Investigator), Mark A.
DePristo41(Project Leader), Robert E. Handsaker13,40(Project Leader), David M.
Altshuler3, Eric Banks13, Gaurav Bhatia13, Guillermo del Angel13, Stacey B. Gabriel13,
Giulio Genovese13, Namrata Gupta13, Heng Li13, Seva Kashin13,40, Eric S. Lander13,
Steven A. McCarroll13,40, James C. Nemesh13, Ryan E. Poplin13;Cold Spring Harbor
Laboratory Seungtai C. Yoon42(Principal Investigator), Jayon Lihm42, Vladimir
Makarov43;Cornell University Andrew G. Clark7(Principal Investigator), Srikanth
Gottipati44, Alon Keinan7, Juan L. Rodriguez-Flores45;European Molecular Biology
Laboratory Jan O. Korbel12,17(Principal Investigator), Tobias Rausch17,46(Project
Leader), Markus H. Fritz46, Adrian M. Stu¨tz17;European Molecular Biology Laboratory, European Bioinformatics Institute Paul Flicek12
(Principal Investigator), Kathryn Beal12, Laura Clarke12, Avik Datta12, Javier Herrero47, William M. McLaren12, Graham R.
S. Ritchie12, Richard E. Smith12, Daniel Zerbino12, Xiangqun Zheng-Bradley12;Harvard
University Pardis C. Sabeti13,48(Principal Investigator), Ilya Shlyakhter13,48, Stephen F.
Schaffner13,48, Joseph Vitti13,49;Human Gene Mutation Database David N. Cooper50
(Principal Investigator), Edward V. Ball50, Peter D. Stenson50;Illumina David R.
Bentley5(Principal Investigator), Bret Barnes39, Markus Bauer5, R. Keira Cheetham5,
Anthony Cox5, Michael Eberle5, Sean Humphray5, Scott Kahn39, Lisa Murray5, John
Peden5, Richard Shaw5;Icahn School of Medicine at Mount Sinai Eimear E. Kenny51
(Principal Investigator);Louisiana State University Mark A. Batzer52(Principal
Investigator), Miriam K. Konkel52, Jerilyn A. Walker52;Massachusetts General Hospital
Daniel G. MacArthur53(Principal Investigator), Monkol Lek53;Max Planck Institute for
Molecular Genetics Ralf Sudbrak32(Project Leader), Vyacheslav S. Amstislavskiy20,
Ralf Herwig20;McDonnell Genome Institute at Washington University Elaine R.
Mardis22(Co-Principal Investigator), Li Ding22, Daniel C. Koboldt22, David Larson22, Kai
Ye22;McGill University Simon Gravel54;National Eye Institute, NIH Anand
Swaroop55, Emily Chew55;New York Genome Center Tuuli Lappalainen56,57(Principal
Investigator), Yaniv Erlich56,58(Principal Investigator), Melissa Gymrek13,56,59,60,
Thomas Frederick Willems61;Ontario Institute for Cancer Research Jared T.
Simpson62;Pennsylvania State University Mark D. Shriver63(Principal Investigator);
Rutgers Cancer Institute of New Jersey Jeffrey A. Rosenfeld64(Principal Investigator);
Stanford University Carlos D. Bustamante65(Principal Investigator), Stephen B.
Montgomery66(Principal Investigator), Francisco M. De La Vega65(Principal
Investigator), Jake K. Byrnes67, Andrew W. Carroll68, Marianne K. DeGorter66, Phil
Lacroute65, Brian K. Maples65, Alicia R. Martin65, Andres Moreno-Estrada65,69, Suyash
S. Shringarpure65, Fouad Zakharia65;Tel-Aviv University Eran Halperin70,71,72
(Principal Investigator), Yael Baran70;The Jackson Laboratory for Genomic Medicine
Charles Lee18,19(Principal Investigator), Eliza Cerveira18, Jaeho Hwang18, Ankit
Malhotra18(Co-Project Lead), Dariusz Plewczynski18, Kamen Radew18, Mallory
Romanovitch18, Chengsheng Zhang18(Co-Project Lead);Thermo Fisher Scientific
Fiona C. L. Hyland73;Translational Genomics Research Institute David W. Craig74
(Principal Investigator), Alexis Christoforides74, Nils Homer75, Tyler Izatt74, Ahmet A.
Kurdoglu74, Shripad A. Sinari74, Kevin Squire76;US National Institutes of Health Stephen T. Sherry25(Principal Investigator), Chunlin Xiao25;University of California, San Diego Jonathan Sebat77,78(Principal Investigator), Danny Antaki77, Madhusudan
Gujral77, Amina Noor77, Kenny Ye79;University of California, San Francisco Esteban G.
Burchard80(Principal Investigator), Ryan D. Hernandez80,81,82(Principal Investigator),
Christopher R. Gignoux80;University of California, Santa Cruz David Haussler83,84
(Principal Investigator), Sol J. Katzman83, W. James Kent83;University of Chicago
Bryan Howie85;University College London Andres Ruiz-Linares86(Principal
Investigator);University of Geneva Emmanouil T. Dermitzakis87,88,89(Principal
Investigator);University of Maryland School of Medicine Scott E. Devine90(Principal
Investigator);University of Michigan Gonçalo R. Abecasis2(Principal Investigator)
(Co-Chair), Hyun Min Kang2(Project Leader), Jeffrey M. Kidd91,92(Principal
Investigator), Tom Blackwell2, Sean Caron2, Wei Chen93, Sarah Emery92, Lars Fritsche2,
Christian Fuchsberger2, Goo Jun2,94, Bingshan Li95, Robert Lyons96, Chris Scheller2,
Carlo Sidore2,97,98, Shiya Song91, Elzbieta Sliwerska92, Daniel Taliun2, Adrian Tan2,
Ryan Welch2, Mary Kate Wing2, Xiaowei Zhan99;University of Montre´al Philip
Awadalla62,100(Principal Investigator), Alan Hodgkinson100;University of North
Carolina at Chapel Hill Yun Li101;University of North Carolina at Charlotte Xinghua
Shi102(Principal Investigator), Andrew Quitadamo102;University of Oxford Gerton
Lunter8(Principal Investigator), Gil A. McVean8,9(Principal Investigator) (Co-Chair),
Jonathan L. Marchini8,9(Principal Investigator), Simon Myers8,9(Principal
Investigator), Claire Churchhouse9, Olivier Delaneau9,87, Anjali Gupta-Hinch8, Warren
Kretzschmar8, Zamin Iqbal8, Iain Mathieson8, Androniki Menelaou9,103, Andy
Rimmer87, Dionysia K. Xifara8,9;University of Puerto Rico Taras K. Oleksyk104
(Principal Investigator);University of Texas Health Sciences Center at Houston Yunxin Fu94(Principal Investigator), Xiaoming Liu94, Momiao Xiong94;University of
Utah Lynn Jorde105(Principal Investigator), David Witherspoon105, Jinchuan Xing106;
University of Washington Evan E. Eichler10,11(Principal Investigator), Brian L.
Browning107(Principal Investigator), Sharon R. Browning108(Principal Investigator),
Fereydoun Hormozdiari10, Peter H. Sudmant10;Weill Cornell Medical College, Ekta
Khurana109(Principal Investigator);Wellcome Trust Sanger Institute Richard M.
Durbin4(Principal Investigator), Matthew E. Hurles4(Principal Investigator), Chris
Tyler-Smith4(Principal Investigator), Cornelis A. Albers110,111, Qasim Ayub4, Senduran
Balasubramaniam4, Yuan Chen4, Vincenza Colonna4,112, Petr Danecek4, Luke Jostins8,
Thomas M. Keane4, Shane McCarthy4, Klaudia Walter4, Yali Xue4;Yale University Mark
B. Gerstein113,114,115(Principal Investigator), Alexej Abyzov116, Suganthi
Balasubramanian115, Jieming Chen113, Declan Clarke117, Yao Fu113, Arif O.
Harmanci113, Mike Jin115, Donghoon Lee113, Jeremy Liu115, Xinmeng Jasmine
Mu13,113, Jing Zhang113,115, Yan Zhang113,115
Structural variation group: BGI-Shenzhen Yingrui Li26, Ruibang Luo26, Hongmei
Zhu26;Bilkent University Can Alkan36, Elif Dal36, Fatma Kahveci36;Boston College
Gabor T. Marth23(Principal Investigator), Erik P. Garrison4, Deniz Kural37, Wan-Ping
Lee37, Alistair N. Ward23, Jiantao Wu23, Mengyao Zhang23;Broad Institute of MIT and
Harvard Steven A. McCarroll13,40(Principal Investigator), Robert E. Handsaker13,40
(Project Leader), David M. Altshuler3, Eric Banks13, Guillermo del Angel13, Giulio
Genovese13, Chris Hartl13, Heng Li13, Seva Kashin13,40, James C. Nemesh13, Khalid
Shakir13;Cold Spring Harbor Laboratory Seungtai C. Yoon42(Principal Investigator),
Jayon Lihm42, Vladimir Makarov43;Cornell University Jeremiah Degenhardt7;
European Molecular Biology Laboratory Jan O. Korbel12,17(Principal Investigator)
(Co-Chair), Markus H. Fritz46, Sascha Meiers17, Benjamin Raeder17, Tobias
Rausch17,46, Adrian M. Stu¨tz17;European Molecular Biology Laboratory, European Bioinformatics Institute Paul Flicek12
(Principal Investigator), Francesco Paolo Casale12, Laura Clarke12, Richard E. Smith12, Oliver Stegle12, Xiangqun Zheng-Bradley12;Illumina David R. Bentley5
(Principal Investigator), Bret Barnes39, R. Keira Cheetham5, Michael Eberle5, Sean Humphray5, Scott Kahn39, Lisa Murray5, Richard Shaw5;Leiden University Medical Center Eric-Wubbo Lameijer118;Louisiana
State University Mark A. Batzer52(Principal Investigator), Miriam K. Konkel52, Jerilyn A.
Walker52;McDonnell Genome Institute at Washington University Li Ding22(Principal
Investigator), Ira Hall22, Kai Ye22;Stanford University Phil Lacroute65;The Jackson
Laboratory for Genomic Medicine Charles Lee18,19(Principal Investigator) (Co-Chair),
Eliza Cerveira18, Ankit Malhotra18, Jaeho Hwang18, Dariusz Plewczynski18, Kamen
Radew18, Mallory Romanovitch18, Chengsheng Zhang18;Translational Genomics
Research Institute David W. Craig74(Principal Investigator), Nils Homer75;US
National Institutes of Health Deanna Church34, Chunlin Xiao25;University of
California, San Diego Jonathan Sebat77(Principal Investigator), Danny Antaki77, Vineet
Bafna119, Jacob Michaelson120, Kenny Ye79;University of Maryland School of
Medicine Scott E. Devine90(Principal Investigator), Eugene J. Gardner90(Project
Leader);University of Michigan Gonçalo R. Abecasis2(Principal Investigator), Jeffrey
M. Kidd91,92(Principal Investigator), Ryan E. Mills91,92(Principal Investigator), Gargi