https://doi.org/10.1007/s00128-018-2292-x
Effect of Boron Toxicity on Oxidative Stress and Genotoxicity in Wheat
(Triticum aestivum L.)
Şükrü Serter Çatav1 · Tuncer Okan Genç1 · Müjgan Kesik Oktay1 · Köksal Küçükakyüz1 Received: 17 August 2017 / Accepted: 5 February 2018 / Published online: 12 February 2018
© Springer Science+Business Media, LLC, part of Springer Nature 2018
Abstract
Boron (B) toxicity, which occurs in semi-arid and arid environments, can adversely affect the growth and yield of many plants. The aim of this study was to determine the effects of different concentrations of boric acid (3, 6, 9 and 12 mM) on growth, oxidative stress and genotoxicity parameters in root and shoot tissues of wheat seedlings. Our results indicate that B stress inhibits root and shoot growth of wheat in a concentration-dependent manner, and leads to increases in TBARS and H2O2 contents in shoot tissue. Moreover, our findings suggest that high concentrations of B may exert a genotoxic effect on wheat. To the best of our knowledge, this is the first report to evaluate the effect of B stress on genotoxicity in both root and shoot tissues of wheat.
Keywords Boron · Wheat · Oxidative stress · Genotoxicity · RAPD-PCR Boron (B) is an essential micronutrient element required for
plant growth (Reid 2013), and plays an important role in the maintenance of cell wall-membrane integrity, as well as sup-porting metabolic functions (Blevins and Lukaszewski 1998; Roessner et al. 2006). On the other hand, the productivity of many agricultural systems is severely affected by insufficient or excessive amounts of B in the soil (Reid et al. 2004). B toxicity generally occurs in semi-arid and arid environ-ments, where B level is high in the soil or in the irrigation water (Nable et al. 1997). Chlorosis, necrosis of leaf tips, and inhibition of root elongation are the main symptoms of B toxicity in many plants (Cervilla et al. 2007; Wang et al.
2010). In addition to these, a number of physiological and metabolic processes such as cell wall development, cell divi-sion, stomatal conductance and photosynthesis are known to be affected by toxic levels of B (Papadakis et al. 2004; Reid et al. 2004; Landi et al. 2012).
Reactive oxygen species (ROS), comprising of free radi-cals such as superoxide anion and hydroxyl radical, as well as non-radical oxygen derivatives like hydrogen peroxide and singlet oxygen, are naturally produced as a by-product of various metabolic processes, including cellular respiration,
photorespiration and photosynthesis (Gill and Tuteja 2010; Jia 2011; Sharma et al. 2012). Under normal conditions, ROS are maintained within a physiological range by the antioxidant defense system which consists of enzymatic and non-enzymatic antioxidants (Shen et al. 1997; Wellen and Thompson 2010). However, the equilibrium between production and scavenging of ROS may be disrupted by various stress factors such as drought, salinity, UV radia-tion and heavy metal polluradia-tion, leading a significant increase in intracellular ROS level (Apel and Hirt 2004; Gill and Tuteja 2010). The excessive production of ROS can induce oxidative stress, which results in cellular damage through a number of mechanisms such as lipid peroxidation, protein oxidation, enzyme inactivation and DNA damage (Bartosz
1997; Sharma et al. 2012).
In recent years, many studies have shown that increasing concentrations of B may cause oxidative stress in various plants (Cervilla et al. 2007; Ardıc et al. 2009; Aftab et al.
2010; Kaya and Ashraf 2015). However, even though the B accumulation in root and shoot tissues are generally different from each other (Nable 1988; Kalayci et al. 1998; Cenkci et al. 2009), in most of these studies, oxidative stress param-eters have been measured either in shoot or leaf tissues of studied species (Cervilla et al. 2007; Ardıc et al. 2009; Kaya and Ashraf 2015). Consequently, there is limited knowledge regarding whether B can cause an increase in oxidative stress in root tissue (but see, Karabal et al. 2003; Wang et al. 2010).
* Köksal Küçükakyüz [email protected]
1 Department of Biology, Muğla Sıtkı Koçman University,
On the other hand, various studies have suggested that root and leaf tissues can show different responses to stress condi-tions (Shah et al. 2001; Bandeoğlu et al. 2004). Determining the oxidative stress parameters in both root and shoot tis-sues, therefore, may provide valuable information for better understanding of B toxicity in plants.
The random amplified polymorphic DNA (RAPD) tech-nique has been widely applied for the detection of genetic diversity (Ram et al. 2008), the construction of genetic maps (Yin et al. 2001), and the identification of resistance genes (Young and Kelly 1997). Furthermore, it has also been fre-quently used in ecotoxicological studies to determine the genotoxic effects of various contaminants such as heavy metals (Liu et al. 2009; Cenkci et al. 2010a) and herbicides (Cenkci et al. 2010b; Aksakal et al. 2013). In RAPD stud-ies, the potential genotoxicity is determined by the compari-son of band profiles (e.g. appearance and disappearance of bands, changes in band intensity) between toxicant-exposed and unexposed samples (Atienzar et al. 2002; Wolf et al.
2004). It has been suggested that variations in RAPD profiles may be related to DNA alterations such as DNA adducts, point mutations and chromosomal rearrangements induced by toxic agents (Wolf et al. 2004; Atienzar and Jha 2006).
As far as we know, the possible genotoxic effect of B on wheat has been investigated in two studies using RAPD technique (Kekec et al. 2010; Erdal et al. 2014). The findings of these studies suggest that B treatments may cause changes in RAPD profiles of the studied genotypes. On the other hand, the genotoxic effect of B has not been determined for shoot tissue in both studies. Moreover, it is well known that there is a substantial genotypic variation in tolerance to B toxicity in wheat (Nable 1988; Kalayci et al. 1998; Torun et al. 2006). Therefore, more studies are required to clarify the potential genotoxic effect of B on wheat.
The aims of the present study were to determine the effects of B on growth and oxidative stress parameters in root and shoot tissues of wheat seedlings, and to evaluate the possible DNA damage induced by B stress using RAPD technique. We hypothesize that increasing concentrations of B may lead to different levels of oxidative stress and geno-toxicity in root and shoot tissues of wheat.
Materials and Methods
In this study, a Turkish cultivar of wheat (Triticum aestivum L.), Kıraç-66, was used. Seeds of this cultivar were steri-lized for 10 min with 3% sodium hypochlorite containing one drop of Tween-20 and rinsed with distilled water three times. Surface-sterilized seeds were incubated in distilled water for 24 h at 20°C in darkness. After that, germinated seeds were placed in Eppendorf tubes containing 0.8 mL agar (1%). The narrow end of each tube was cut with a
heated knife before placement of seeds to allow the roots to protrude from the tube tip. Eppendorf tubes were then placed in styrofoam floats and let seedlings grow hydro-ponically in a growth chamber at 22°C under a photoperiod of 16 h (100 µmol m−2 s−1) for 6 days. A modified
nutri-ent solution (pH 5.6), which consisted of 0.65 mM KNO3, 0.40 mM CaCl2, 0.25 mM MgCl2, 0.08 mM NH4NO3 and
0.025 mM H3BO3 (boric acid [BA]), was used to provide
essential nutrients. At the end of 7 days of growth, different concentrations of BA (3, 6, 9 and 12 mM) were added to nutrient solutions in order to determine the effects of B on physiological and biochemical parameters in wheat. Con-trol (contains 0.025 mM BA) and B-subjected plants were grown with the same growth conditions for another 5 days (Karabal et al. 2003). The nutrient solutions were changed every 2–3 days and aerated continuously. After the end of the experiment, the root and leaf tissues of 12 days old wheat seedlings were used for further measurements and assays.
After the harvest, photographs of seedlings from each treatment were taken using a digital camera. ImageJ analysis software (version 1.51k) was used to measure the root and shoot length of each seedling. The total seedling length and root/shoot ratio were also calculated. Finally, root and shoot dry weights of each seedling were determined after drying at 70°C for 48 h.
In order to determine the chlorophyll and carotenoid con-tents, 0.5 g of fresh leaf materials were extracted with 80% acetone and the extracts were centrifuged at 10,000 rpm for 15 min at 4°C. After that, the absorbance of supernatants was measured at 663, 645, and 470 nm using a UV–Vis spectrophotometer (Sumanta et al. 2014).
For determination of H2O2 levels in root and shoot
tis-sues, samples were homogenized in 10 volumes of (w/v) ice cold 0.1% trichloroacetic acid (TCA). The homogenate was centrifuged at 10,000 rpm for 15 min at 4°C. Subsequently, 0.5 mL of the supernatant was mixed with 0.5 mL of 10 mM potassium phosphate buffer (pH 7.0) and 1 mL of 1 M potas-sium iodide (KI). After 20 min of incubation at room tem-perature, the absorbance of the mixtures was measured at 390 nm (Velikova et al. 2000). The content of H2O2 was
calculated by comparison with a standard calibration curve prepared from a range of concentrations of H2O2 (0–50 µM). The results were expressed as µM g−1 FW.
Thiobarbituric acid-reactive substances (TBARS), which is an indicator of lipid peroxidation, was assayed as described by Karabal et al. (2003). Briefly, 0.5 g of root and shoot samples were homogenized in 5 mL ice-cold 0.1% TCA. The homogenates were centrifuged at 10,000 rpm for 20 min at 4°C, and the supernatants were collected for the determination of TBARS content. One mL supernatant of each sample was mixed with 4 mL of 20% TCA and 0.5% TBA and heated at 95°C for 30 min. The reaction was termi-nated in an ice bath and reaction mixtures were centrifuged
at 10,000 rpm for 10 min at 4°C. Following centrifuga-tion, absorbance of each mixture was measured at 440, 532 and 600 nm with a UV–Vis spectrophotometer (Shimadzu UV-1700). The TBARS content (nmol g−1 FW) was
calcu-lated by using the formula of Du and Bramlage (1992). B concentration of root and shoot tissues was determined by azomethine-H method (John et al. 1975). Approximately, 100–200 mg of dried root and shoot samples were put into Teflon vessels containing 10 mL of freshly prepared con-centrated HNO3–H2O2 acid mixture (7:3, v/v). After
stand-ing for 10 min, the samples were digested in a microwave system (Berghof Speedwave MWS-3, Germany) at various time intervals and temperatures. The digested samples were then filtered and diluted 10 times with ultrapure water. The azomethine-H solution and buffer masking reagent were pre-pared according to Banuelos et al. (1992). The reaction mix-ture consisted of 1 mL sample solution, 2 mL buffer masking reagent and 2 mL azomethine-H solution. The mixtures were mixed thoroughly and incubated at room temperature for 30 min. Finally, the absorbance of mixtures was measured at 420 nm by using a UV–Vis spectrophotometer. The content of B was quantified by using a standard calibration curve prepared from different concentrations of B (0–15 µg/mL).
Genomic DNA was extracted from approximately 250 mg of fresh root and shoot tissues using the CTAB (cetyltri-methylammonium bromide) method described by Doyle and Doyle (1987), with minor modifications. The PCR reactions were performed in a total volume of 25 µL consisting of 25 ng DNA, 1.2 µM primer, 200 µM dNTPs, 2.5 µM MgCl2 and 1 U Taq DNA Polymerase (Thermo). Sequences (5′–3′) from primer 1 to 10 were: AGG CAG AGCA (OPY-8), GGG CCA ATGT (OPY-16), GTC CAC ACGG (OPB-8), CTG GAC GTCA (OPW-7), GGC GGA TAAG (OPW-5), AGT CGC CCTT (OPY-15), TTC AGG GCAC (OPW-18), AAT CGG GCTG (OPA-4), CTG ACC AGCC (OPH-19) and ACC TTT GCGG (Primer 5).
All primers used in our experiments were selected according to published sequences (Liu et al. 2009; Aksakal and Esim 2015). The PCR reactions were repeated three times for each sample and negative controls were used to avoid cross-contamination. Amplification was conducted in a thermal cycler (Bio-Rad iCycler®, USA), programmed as follows: one cycle of 4 min at 94°C followed by 30 cycles of 1 min at 94°C; 1 min at 34°C; and 1 min at 72°C. The extension of all amplified products was completed by a final extension step of 8 min at 72°C. After amplification, PCR products were loaded onto 1.5% agarose gels supple-mented with ethidium bromide (0.5 µg/mL). Electrophoresis was carried out in 1X TAE buffer at 70 V for 2 h. A Gene Ruler™ 100 bp DNA Ladder Plus (Fermentas) was used as a standard for molecular size determination. Digital images of the gels were analyzed by using GelJ software (version 2.0). The genomic template stability [GTS (%)] was calculated
as follows: 100 − (100 × (a/n)), where “n” is the number of total bands in control and “a” is the number of polymor-phic bands detected in B-treated samples. Polymorphism in RAPD profiles was determined with appearance of new bands and disappearance of existing bands as compared to control (Aksakal and Esim 2015).
The data sets were analyzed by one-way ANOVA fol-lowed by Tukey HSD test to compare the differences between control and treatment groups. Data normality and homoscedasticity were verified using Shapiro–Wilk and Bartlett’s tests, respectively. Furthermore, a two-way ANOVA followed by Holm-Sidak post hoc test was con-ducted to examine the effects of treatment and tissue type for each tested parameter.
Results and Discussion
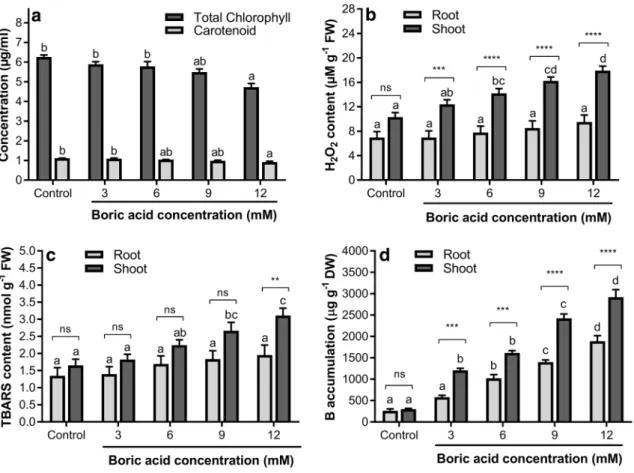
It has been shown that high concentrations of B may adversely affect the root and shoot growth in many plants (Kalayci et al. 1998; Karabal et al. 2003; Wang et al. 2010). In our study, BA treatments significantly reduced the root and shoot growth of wheat in a concentration-dependent manner (Table 1). The results of root/shoot ratios demon-strated that root growth is more sensitive to B toxicity than shoot growth. Furthermore, BA treatments induced a signifi-cant reduction in total seedling length at the concentrations of 3 mM and above, while the reduction in total seedling weight was observed at the concentrations of 9 and 12 mM. In addition, the total chlorophyll and carotenoid contents were significantly decreased by the highest concentration of BA treatment (12 mM), as compared to control (Fig. 1a). On the other hand, other BA treatments did not affect the photosynthetic pigment concentrations. Our results are con-sistent with previous studies showing that B induces dose-dependent decreases in plant growth parameters (Nable
1988; Sakcali et al. 2015; Kaya and Ashraf 2015).
Many stress factors such as UV radiation, drought and high temperature are known to induce the excessive forma-tion of ROS, and it has been demonstrated that lipid per-oxidation is one of the main outcomes of ROS-mediated injury (Catalá 2009; Gill and Tuteja 2010). A number of studies in recent years have shown that B stress may also cause increases in ROS production and lipid peroxidation (Ardıc et al. 2009; Aftab et al. 2010; Kaya and Ashraf 2015). However, most of these studies have focused on B-induced oxidative stress in either leaf or shoot tissues. Therefore, there is limited information regarding whether B can lead to an increase in oxidative stress in root tissue (but see, Kara-bal et al. 2003; Wang et al. 2010). The results of our study demonstrated that H2O2 content in shoot tissue is markedly
(p < 0.05) enhanced by increasing concentrations of BA. On the other hand, even though a slight increment of H2O2 was
observed in root tissue by higher concentrations of BA, no significant difference (p > 0.05) was found between treat-ments (Fig. 1b). Furthermore, significant differences in H2O2 content were found between root and shoot tissues within the same treatment group. Except for control samples, a higher concentration of H2O2 was determined in shoot
tis-sues (Fig. 1b). In addition, our results showed that TBARS
content in shoot tissue is statistically increased by 9 and 12 mM concentrations of BA. However, none of the BA treatments significantly affected (p > 0.05) the TBARS con-tent in root tissue when compared to the control (Fig. 1c). Moreover, no meaningful differences were found for TBARS content between root and shoot tissues within the same treat-ment group, apart from the 12 mM of BA treattreat-ment. The
Table 1 Effects of different concentrations of BA on growth parameters of wheat (Kıraç-66) seedlings
Means ± SE followed by different letters in the same row are significantly different according to Tukey’s HSD test (p < 0.05). “n” indicates the total number of sample analyzed in corresponding parameter
Growth parameters Control Concentration of BA (mM) n
3 6 9 12
Root length (mm) 246 ± 7d 203 ± 7c 165 ± 7b 132 ± 6a 124 ± 8a 267
Shoot length (mm) 211 ± 4c 206 ± 4c 202 ± 4bc 188 ± 4ab 182 ± 4a 267
Total seedling length (mm) 457 ± 9d 409 ± 10c 366 ± 9b 319 ± 10a 306 ± 10a 267
Root/shoot ratio (length) 1.17 ± 0.03d 0.98 ± 0.03c 0.81 ± 0.03b 0.70 ± 0.03a 0.67 ± 0.04a 267
Root dry weight (mg) 8.1 ± 0.3c 7.3 ± 0.3c 6.4 ± 0.2b 5.5 ± 0.2a 4.7 ± 0.2a 256
Shoot dry weight (mg) 20.8 ± 0.5b 20.4 ± 0.6ab 20.3 ± 0.5ab 19.1 ± 0.6ab 18.2 ± 0.6a 256
Total seedling dry weight (mg) 28.8 ± 0.7c 27.7 ± 0.8c 26.7 ± 0.7bc 24.6 ± 0.8ab 23.0 ± 0.8a 256
Root/shoot ratio (dry weight) 0.39 ± 0.01e 0.36 ± 0.01d 0.32 ± 0.01c 0.29 ± 0.01b 0.26 ± 0.01a 256
Fig. 1 Effects of different concentrations of BA on a total chlorophyll and carotenoid contents, b H2O2 level, c TBARS level, and d
accu-mulation of boron. Different letters indicate significant differences at
p < 0.05 (Tukey’s HSD test) between treatments for each tissue
cat-egory or parameter, while asterisks and ns indicate significance of differences between tissues within the same treatment group accord-ing to Holm–Sidak test (ns not significant; *p < 0.05; **p < 0.01; ***
present results confirm previous reports showing that B toxicity can cause oxidative stress in leaf and shoot tissues (Molassiotis et al. 2006; Cervilla et al. 2007; Ardıc et al.
2009). Our findings also support the results of Karabal et al. (2003), who showed that B stress does not affect the H2O2 and TBARS contents in roots of barley seedlings. The rea-son for this difference between root and shoot tissues might be related to different accumulation patterns of B. In our study, even though B accumulation in shoot and root tissues gradually increased with the increase of BA concentrations, B accumulation in shoot tissue was greater than root tissue in all the BA treatments (Fig. 1d).
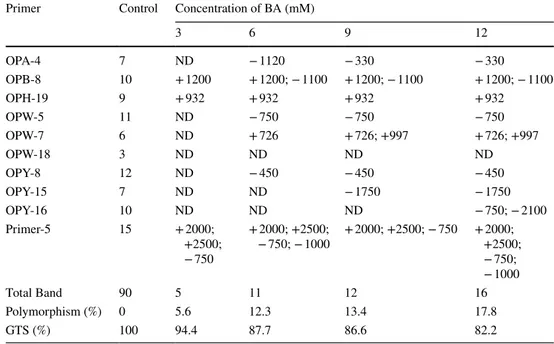
The RAPD-PCR profiles of root and shoot tissues are shown in Tables 2 and 3 and Fig. 2. Of the 10 decamer oligonucleotide primers tested, all of them gave clear and reproducible bands. Total number of bands produced in the control samples of root and shoot tissues was 91 and 90, respectively. The size of these bands ranged from 280 bp (OPB-8) to 3915 bp (OPY-16) in the control samples. The RAPD profiles showed differences in terms of concentra-tion of treatment and type of tissue for the used primers. For example, some primers resulted in no alteration of amplification products (OPA-4 and OPW-18), while some primers (OPB-8 and Primer 5) gave more complicated
Table 2 Molecular sizes (base pair) of appearing (+) and disappearing (−) bands, polymorphism ratio and GTS value in the roots of wheat seedlings exposed to different concentration of BA
ND Not determined
Primer Control Concentration of BA (mM)
3 6 9 12 OPA-4 7 ND ND ND ND OPB-8 10 + 1500 + 1500; − 1100 + 1500 + 1500; − 1100 OPH-19 9 ND ND + 580 + 580 OPW-5 11 ND + 900 + 900 + 900 OPW-7 7 ND − 730 − 730 − 730 OPW-18 3 ND ND ND ND OPY-8 12 ND ND − 1460 − 1460 OPY-15 7 ND ND ND − 900 OPY-16 10 − 750 − 750 − 750 − 750; − 2100 Primer-5 15 − 900; − 1100 − 1100 − 1100 + 620; − 1100 Total Band 91 4 6 7 11 Polymorphism (%) 0 4.4 6.6 7.7 12.1 GTS (%) 100 95.6 93.4 92.3 87.9
Table 3 Molecular sizes (base pair) of appearing (+) and disappearing (−) bands, polymorphism ratio and GTS value in the shoots of wheat seedlings exposed to different concentration of BA
ND Not determined
Primer Control Concentration of BA (mM)
3 6 9 12 OPA-4 7 ND − 1120 − 330 − 330 OPB-8 10 + 1200 + 1200; − 1100 + 1200; − 1100 + 1200; − 1100 OPH-19 9 + 932 + 932 + 932 + 932 OPW-5 11 ND − 750 − 750 − 750 OPW-7 6 ND + 726 + 726; +997 + 726; +997 OPW-18 3 ND ND ND ND OPY-8 12 ND − 450 − 450 − 450 OPY-15 7 ND ND − 1750 − 1750 OPY-16 10 ND ND ND − 750; − 2100 Primer-5 15 + 2000; +2500; − 750 + 2000; +2500; − 750; − 1000 + 2000; +2500; − 750 + 2000; +2500; − 750; − 1000 Total Band 90 5 11 12 16 Polymorphism (%) 0 5.6 12.3 13.4 17.8 GTS (%) 100 94.4 87.7 86.6 82.2
banding patterns (Tables 2, 3). Furthermore, the percent-age of polymorphism in both root and shoot samples were increased in a concentration-dependent manner by BA. The values of genomic template stability (GTS %), which demonstrates the quantitative changes in RAPD profiles, were decreased by increasing concentration of the BA in both tissue types (Tables 2, 3). However, the reduction in GTS (%) values of shoot samples was slightly higher than that of root samples. Our data support the results of previous studies suggesting that B toxicity may exert a genotoxic effect on wheat (Kekec et al. 2010; Erdal et al.
2014). On the other hand, remarkable changes in RAPD profiles of studied wheat cultivars were observed at differ-ent concdiffer-entrations of B. These differences may result from the existence of a large genotypic variation in tolerance to B toxicity in wheat (Torun et al. 2006). Moreover, Cenkci et al. (2009) suggested that B toxicity can cause different degrees of genotoxicity on root and leaf samples of bean due to different accumulation rates of B in tissues. Our results also confirmed this observation in wheat. In our study, we found that B content was remarkably lower in root tissue than in shoot tissue (Fig. 1d). This may explain the relatively lower genotoxic effect of B in root tissue of wheat.
In conclusion, the results of present study indicate that: (i) B stress has a negative effect on the growth of wheat seedlings in a dose-dependent manner; (ii) root growth is more sensitive to B toxicity than shoot growth; (iii) B accumulation in shoot tissue is significantly higher than that in root tissue; (iv) B stress leads to increases in
oxidative stress parameters such as TBARS and H2O2 in shoot tissue; and (v) high concentrations of B may exert a genotoxic impact on root and shoot tissues of wheat.
Acknowledgements This study is one part of a PhD dissertation of the first author, funded by the Scientific Research Projects Coordina-tion Unit of Muğla Sıtkı Koçman University (Grant Number 15/153).
References
Aftab T, Khan MMA, Idrees M et al (2010) Boron induced oxidative stress, antioxidant defence response and changes in artemisinin content in Artemisia annua L. J Agron Crop Sci 196:423–430 Aksakal O, Esim N (2015) Evaluation of arsenic trioxide
genotoxic-ity in wheat seedlings using oxidative system and RAPD assays. Environ Sci Pollut Res 22:7120–7128
Aksakal O, Erturk FA, Sunar S et al (2013) Assessment of genotoxic effects of 2, 4-dichlorophenoxyacetic acid on maize by using RAPD analysis. Ind Crops Prod 42:552–557
Apel K, Hirt H (2004) Reactive oxygen species: metabolism, oxi-dative stress, and signal transduction. Annu Rev Plant Biol 55:373–399
Ardıc M, Sekmen AH, Tokur S et al (2009) Antioxidant responses of chickpea plants subjected to boron toxicity. Plant Biol 11:328–338 Atienzar FA, Jha AN (2006) The random amplified polymorphic DNA (RAPD) assay and related techniques applied to genotoxicity and carcinogenesis studies: a critical review. Mutat Res 613:76–102 Atienzar FA, Venier P, Jha AN, Depledge MH (2002) Evaluation of
the random amplified polymorphic DNA (RAPD) assay for the detection of DNA damage and mutations. Mutat Res 521:151–163 Bandeoğlu E, Eyidoğan F, Yücel M, Öktem HA (2004) Antioxidant
responses of shoots and roots of lentil to NaCl-salinity stress. Plant Growth Regul 42:69–77
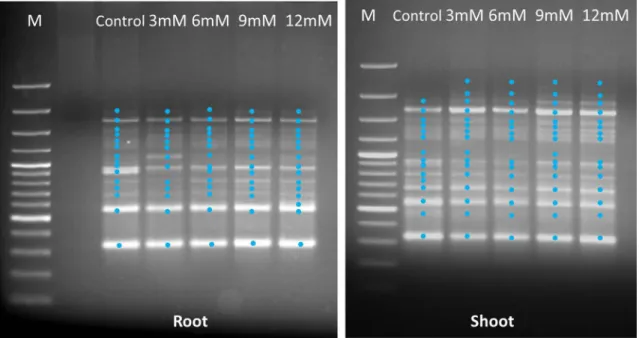
Fig. 2 RAPD profiles (Primer-5) of genomic DNA from root and shoot tissues of wheat seedlings exposed to different concentration of BA. M Molecular size marker (3000, 2000, 1500, 1200, 1000, 900, 800, 700, 600, 500, 400, 300, 200 and 100 bp from top to bottom)
Banuelos GS, Cardon G, Pflaum T, Akohoue S (1992) Comparison of dry ashing and wet acid digestion on the determination of boron in plant tissue. Common Soil Sci Plant Anal 23:17–20
Bartosz G (1997) Oxidative stress in plants. Acta Physiol Plant 19:47–64
Blevins DG, Lukaszewski KM (1998) Boron in plant structure and function. Annu Rev Plant Biol 49:481–500
Catalá A (2009) Lipid peroxidation of membrane phospholipids gen-erates hydroxy-alkenals and oxidized phospholipids active in physiological and/or pathological conditions. Chem Phys Lipids 157:1–11
Cenkci S, Yıldız M, Ciğerci İH et al (2009) Toxic chemicals-induced genotoxicity detected by random amplified polymorphic DNA (RAPD) in bean (Phaseolus vulgaris L.) seedlings. Chemosphere 76:900–906
Cenkci S, Ciğerci İH, Yıldız M et al (2010a) Lead contamination reduces chlorophyll biosynthesis and genomic template stability in Brassica rapa L. Environ Exp Bot 67:467–473
Cenkci S, Yıldız M, Ciğerci İH et al (2010b) Evaluation of 2, 4-D and Dicamba genotoxicity in bean seedlings using comet and RAPD assays. Ecotoxicol Environ Saf 73:1558–1564
Cervilla LM, Blasco B, Ríos JJ et al (2007) Oxidative stress and anti-oxidants in tomato (Solanum lycopersicum) plants subjected to boron toxicity. Ann Bot 100:747–756
De Wolf H, Blust R, Backeljau T (2004) The use of RAPD in ecotoxi-cology. Mutat Res 566:249–262
Doyle J, Doyle JL (1987) Genomic plant DNA preparation from fresh tissue-CTAB method. Phytochem Bull 19:11–15
Du Z, Bramlage WJ (1992) Modified thiobarbituric acid assay for measuring lipid oxidation in sugar-rich plant tissue extracts. J Agric Food Chem 40:1566–1570
Erdal S, Genc E, Karaman A et al (2014) Differential responses of two wheat varieties to increasing boron toxicity. Changes on anti-oxidant activity, oxidative damage and DNA profile. J Environ Protect Ecol 15:1217–1229
Gill SS, Tuteja N (2010) Reactive oxygen species and antioxidant machinery in abiotic stress tolerance in crop plants. Plant Physiol Biochem 48:909–930
Jia L (2011) Is reactive oxygen species (ROS) the underlying factor for inhibited root growth in Osspr1? Plant Signal Behav 6:1024–1025 John MK, Chuah HH, Neufeld JH (1975) Application of improved
azomethine-H method to the determination of boron in soils and plants. Anal Lett 8:559–568
Kalayci M, Alkan A, Cakmak I et al (1998) Studies on differen-tial response of wheat cultivars to boron toxicity. Euphytica 100:123–129
Karabal E, Yücel M, Öktem HA (2003) Antioxidant responses of tol-erant and sensitive barley cultivars to boron toxicity. Plant Sci 164:925–933
Kaya C, Ashraf M (2015) Exogenous application of nitric oxide promotes growth and oxidative defense system in highly boron stressed tomato plants bearing fruit. Sci Hortic 185:43–47 Kekec G, Sakcali MS, Uzonur I (2010) Assessment of genotoxic effects
of boron on wheat (Triticum aestivum L.) and bean (Phaseolus
vulgaris L.) by using RAPD analysis. Bull Environ Contam
Toxi-col 84:759–764
Landi M, Degl’Innocenti E, Pardossi A, Guidi L (2012) Antioxidant and photosynthetic responses in plants under boron toxicity: a review. Am J Agric Biol Sci 7:255–270
Liu W, Yang YS, Li PJ et al (2009) Risk assessment of cadmium-contaminated soil on plant DNA damage using RAPD and physi-ological indices. J Hazard Mater 161:878–883
Molassiotis A, Sotiropoulos T, Tanou G et al (2006) Boron-induced oxidative damage and antioxidant and nucleolytic responses in shoot tips culture of the apple rootstock EM 9 (Malus domestica Borkh). Environ Exp Bot 56:54–62
Nable RO (1988) Resistance to boron toxicity amongst several barley and wheat cultivars: a preliminary examination of the resistance mechanism. Plant Soil 112:45–52
Nable RO, Bañuelos GS, Paull JG (1997) Boron toxicity. Plant Soil 193:181–198
Papadakis IE, Dimassi KN, Bosabalidis AM et al (2004) Boron toxicity in “Clementine” mandarin plants grafted on two rootstocks. Plant Sci 166:539–547
Ram SG, Parthiban KT, Kumar RS et al (2008) Genetic diversity among Jatropha species as revealed by RAPD markers. Genet Resour Crop Evol 55:803–809
Reid RJ (2013) Boron toxicity and tolerance in crop plants. Crop improvement under adverse conditions. Springer, New York, pp 333–346
Reid RJ, Hayes JE, Post A et al (2004) A critical analysis of the causes of boron toxicity in plants. Plant Cell Environ 27:1405–1414 Roessner U, Patterson JH, Forbes MG et al (2006) An investigation
of boron toxicity in barley using metabolomics. Plant Physiol 142:1087–1101
Sakcali MS, Kekec G, Uzonur I et al (2015) Randomly amplified pol-ymorphic-DNA analysis for detecting genotoxic effects of Boron on maize (Zea mays L.). Toxicol Ind Health 31:712–720 Shah K, Kumar RG, Verma S, Dubey RS (2001) Effect of cadmium
on lipid peroxidation, superoxide anion generation and activi-ties of antioxidant enzymes in growing rice seedlings. Plant Sci 161:1135–1144
Sharma P, Jha AB, Dubey RS, Pessarakli M (2012) Reactive oxygen species, oxidative damage, and antioxidative defense mechanism in plants under stressful conditions. J Bot 2012:1–26
Shen BO, Jensen RG, Bohnert HJ (1997) Increased resistance to oxida-tive stress in transgenic plants by targeting mannitol biosynthesis to chloroplasts. Plant Physiol 113:1177–1183
Sumanta N, Haque CI, Nishika J, Suprakash R (2014) Spectrophoto-metric analysis of chlorophylls and carotenoids from commonly grown fern species by using various extracting solvents. Res J Chem Sci 4:63–69
Torun AA, Yazici A, Erdem H, Çakmak İ (2006) Genotypic variation in tolerance to boron toxicity in 70 durum wheat genotypes. Turk J Agric For 30:49–58
Velikova V, Yordanov I, Edreva A (2000) Oxidative stress and some antioxidant systems in acid rain-treated bean plants: protective role of exogenous polyamines. Plant Sci 151:59–66
Wang B-L, Shi L, Li Y-X, Zhang W-H (2010) Boron toxicity is allevi-ated by hydrogen sulfide in cucumber (Cucumis sativus L.) seed-lings. Planta 231:1301–1309
Wellen KE, Thompson CB (2010) Cellular metabolic stress: consider-ing how cells respond to nutrient excess. Mol Cell 40:323–332 Yin T, Huang M, Wang M et al (2001) Preliminary interspecific genetic
maps of the Populus genome constructed from RAPD markers. Genome 44:602–609
Young RA, Kelly JD (1997) RAPD markers linked to three major anthracnose resistance genes in common bean. Crop Sci 37:940–946