Photoluminescence properties of Eu
3+-activated Y
1.50Sc
0.50O
3phosphors
Erkul Karacaoglu* & Esra ÖztürkKaramanoğlu Mehmetbey University, Engineering Faculty, Department of Metallurgy and Materials Engineering, Karaman, Turkey *E-mail: ekaracaoglu@kmu.edu.tr
Received 31 January 2020; revised and accepted 18 August 2020
In this research, Eu3+ activated and Dy3+-co-doped Y2O3 based phosphors have been synthesized by solid-state reaction
method under open atmosphere. The host lattice is composed of 0.25 moles of Sc2O3 which is added to phosphor
composition. Thus, Sc3+ substitution of Y3+ ions is implemented to form Y
1.40Sc0.50O3 host lattice. The thermal analysis
(DTA/TG) have been carried out from 50 °C to 1400 °C for preliminary examination of thermal behavior of phosphors during heat treatments. After the heating process, the phase formations are characterized by X-ray diffraction resulted as Y2O3 single phase cubic structure. The effects of Eu3+ and Dy3+ dopant ions on the photoluminescence and phase formation
properties of the hosts are investigated and determined as Dy3+-co-doped phoshor has the reduced excitation/emission intensities as well as decay lifetimes.
Keywords: Dysprosium ion (Dy3+), Europium ion (Eu3+), Photoluminescence, Scandium ion (Sc3+), Solid-state reaction method, Yttrium oxide (Y2O3)
Inorganic type phophorescent materials which are recognized by their chemical and thermal stability as well as their high quantum efficiency, have attracted an interest of researchers for a long time because of their well-known structures and are noted as an alternative to sulfide based phosphors1,2. Since the ionic radii of Y3+ (0.9–1.075 Å) is similar as with most of the rare earth ions, yttrium oxide (Y2O3) host
lattice is considered as the ideal structure for doping. Also, Y2O3 has good thermal stability up to 2200 °C.
Its melting point is about 2500 °C. Y2O3 along with
CaO, MgO and BN are considered as candidate materials for insulator coating3.
It is well-understood that rare-earth-doped Y2O3
phosphors have excellent luminescent properties namely narrow emission spectrum, long luminescent life times, the color-tunable UC luminescence properties. These phosphors are suitable for fluorescent lamp, solar cell, optical communication, display device, etc. applications. The europium (Eu2+ or Eu3+) ions are used as the significant dopant/activator for lost of host lattices provide obtaining blue to red color region emissions depending on synthesizing atmosphere because the synthesizing atmosphere affects the Eu-ions valence. Moreover, the Eu2+-ions give green color emission in some host lattices (SrAl2O4, BaAl2O4, etc.) and
Eu3+-ions give red color emissions in some hosts (Y2O3,), thus the host structure is significative factor in
obtaining emission to different wavelengths. Furthermore, it was thought that the emission properties of doped Y2O3 could be improved by co-doping with a
certain trace amount of Ln3+-ions, for example, by means of Dy co-doping providing in considerable increased emission life time as well as intensity4-6. In this work, the Y2O3 based host lattice was synthesized
successfully by solid state reaction method in open atmosphere. While creating this host lattice, Sc3+ ions were added instead of Y3+ in the host lattice, or in other words Sc3+ ions are substituted for Y3+ ions. The indexed structure, Y2O3, was still same after substitution of Sc
3+
because the ionic radii of Sc3+ (0.745 Å) is smaller than Y3+ ions (1.011 Å). The electronic structure of Sc3+ ion is similar, and Sc is often included in that ion. Because the radius of Sc3+ is more close to Eu3+ and Dy3+ than Y3+, therefore adding of Sc3+ to Y2O3 lattice may
improve the dispersity of Eu3+ and Dy3+ in Y1.50Sc0.50O3.
Based on this information given above it is acceptable to think that doping Sc3+ to the Y2O3 host may enhance the
photoluminescence intensity7. Then, the effect of Eu3+ doping and Dy3+ co-doping on the photoluminescent properties including the excitation and emission spectrum of host material were well investigated.
Materials and Methods
xEu3+ (x= 0.1 mol%) and xEu3+, yDy3+ (x= 0.1 and y= 0.01 mol%) doped Y1.40Sc0.50O3 phosphors were
prepared by the solid state reaction technique. High purity Yttrium(III) oxide (Y2O3, 99.99%, Acros
Organics), Scandium(III) oxide (Sc2O3, 99.9%, abcr
chemicals), Europium(III) oxide (Eu2O3, 99.9%,
Aldrich) and Dysprosium(III) oxide (Dy2O3,
≥99.99%, Aldrich) chemicals were used for phosphor compositions. The raw materials were stoichiometrically calculated and well-mixed in the agate mortar to get obtain fine and homogenous mixed particles. Before heat treatments, the compositions thermal behaviors at a heating rate of 10 °C/min from room temperature to 1400 °C were analyzed by differential thermal analysis (DTA) and thermogravimetric (TG) instrument (SII Nanotechnology SII6000 Exstar TG/DTA 6300). Then, the heat treatments were carried out in pure alumina crucibles in a muffle furnace (Protherm MOS180/4) at open atmosphere, then cooled down to the room temperature. Here, we studied and sintered Y1.40Sc0.50O3 host based phosphor under open
atmosphere because Eu3+ activated Y2O3 phosphors
are dominate red color emitting materials in commercial applications on fluorescent or LED lighting and display, due to their good luminescent characteristics, suitable atmospheric stability, and lack of hazardous composition opposed to sulfide phosphors. The sintered bulk samples ground to powder form for the characterization process. Powder form of each sample’s phase formation investigations were done with Bruker AXS D8 Advance model X-ray diffractometer (XRD), which run at 40 kV and 30 mA (Cu-Kα radiation) in a step-scan mode (0.02°/2θ). The surface morphology and elemental analysis (EDX) were achieved by a scanning electron microscope (SEM). Finally, the photoluminescence (PL) properties including the excitation and emission spectra and the decay curves as well as life times of the samples were analyzed by a fluorometer (Photon Technology International (PTI), Quanta Master TM 30).
Results and Discussion Thermal analysis
The thermal analysis results (DTA/TG) of Y1.40Eu0.10Sc0.50O3 and Y1.40Eu0.10Dy0.01Sc0.50O3
compositions which were obtained ranges from 50 °C to1400 °C are given in Figs 1-2. The DTA/TG results of all samples show that there is not any mass change or endo/exo-thermic reaction up to 1400 °C despite the hosts were doped with various oxides. SinceY2O3
has good thermal stability up to 2200 °C, the host lattice, along with CaO, MgO and BN are considered as candidate materials for insulator coating. Its melting point8 is about 2500 °C.
X-ray diffraction (XRD) analysis
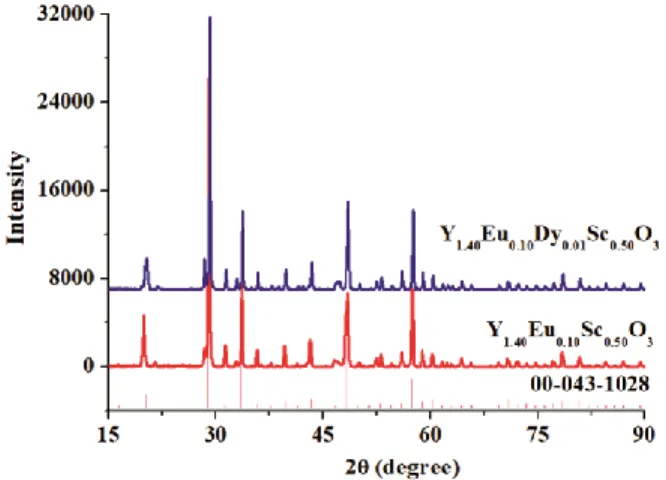
After thermal behavior analysis, each material was subjected to a pre-heat treatment process, namely at 800 °C for 6 h. After the heat treatment (at 1000 °C for 6 h) for structure formation was performed, the XRD analyses were carried out for each sample. The Fig. 3 illustrates the comparative XRD patterns of Y1.40Eu0.10Sc0.50O3 and Y1.40Eu0.10Dy0.01Sc0.50O3. Fig. 3
proved that all the samples were indexed by cubic Y2O3 (JPCDS cards #00-043-1028). There was no
major change in peak positions though the doping or co-doping of host material, so the indexed single phase, Y2O3, is valid for all samples according to
XRD patterns while the host structure is Y1.50Sc0.50O3.
Additionally, the result clearly implies that the dopant and co-dopant ions are well substituted into the Sc3+ ions in the lattice. This clearly implies that the dopant
Fig. 1 — DTA/TG curves of Y1.40Eu0.10Sc0.50O3 phosphor
and co-dopant ions are well substituted into the Sc3+ ions in the lattice. Thus, with doping of Eu3+ and co-doping of Dy3+ ions no shift was observed in the diffraction peaks. All samples well-crystallized in the cubic structure so the lattice parameters are a=b=c=9.845 Å, α=90°, β= 90° and γ= 90°.
SEM-EDX Analysis
Figs 4 and 5 show typical SEM images and EDX results of prepared and powdered Y1.40Eu0.10Sc0.50 O3
and Y1.40Eu0.10Dy0.01Sc0.50O3 phosphors in the cubic
phase. As it is clear from all the SEM images that all samples have been agglomerated from very small particles. The particle distributions measured directly from all SEM images were approximately between 0.18–0.31 µm and 0.18–0.39 µm ranges for Y1.40Eu0.10Sc0.50O3 and Y1.40Eu0.10Dy0.01Sc0.50O3
phosphors, respectively. Furthermore, it was confirmed that all prepared samples with the micron size particles exhibit relatively irregular morphology and have the same morphological characteristics. When the EDX results are examined, the dopant and co-dopant materials added in low quantities gave peak at low intensities as expected.
Photoluminescence properties
The PL studies of all samples have effective results with PL spectra and intensities. Figs 6 and 7 give the PL spectra including excitation and emission wavelengths and intensities of Y1.40Eu0.10Sc0.50O3
phosphor and Y1.40Eu0.10Dy0.01Sc0.50O3 phosphor,
respectively. The PL results given in Figs 8 and 9 are similar because of these two doped phosphors are activated with Eu3+-ions as luminescent center. The results indicate at prominent emission band attributed to 5D0 →
7
F2 (610/611 nm), transitions of Eu 3+
ion. The other emission at about 700 and 702 nm were related to 5D0 →
7
F4 transitions of Eu 3+
. Obviously,
Fig. 3 — The comparative XRD patterns of Y1.40Eu0.10Sc0.50 O3
and Y1.40Eu0.10Dy0.01Sc0.50O3
Fig. 4 — (a) SEM image and (b) EDX spectrum of Y1.40Eu0.10Sc0.50 O3 phosphor
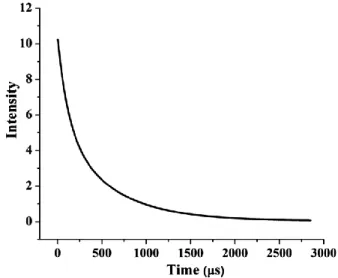
Fig. 9 — Luminescence decay from the 5D0 level of Eu3+ in
Y1.40Eu0.10Dy0.01Sc0.50O3 phosphor by monitoring the 5
D0 → 7
F2
transition at ∼610 nm
the emission spectrum is dominated by the red region (5D0 →
7
F2,610 nm) transition of the Eu 3+
, which is an electric-dipole allowed transition and is hypersensitive to the environment6,9,10. The major excitation peak of samples centered at range of 285 nm was associated with the charge-transfer state (CTS) band which is proved that the typical Eu3+-activated phosphors show strong CTS transition band excitation around 200–300 nm. Furthermore, the CTS is related to an electron transferred from the oxygen 2p orbital to the empty 4f orbital of europium, which may be ascribed as ligand-to-Eu3+ charge-transfer transitions (LMCT). Furthermore, the excitation peaks generally between 300-500 nm can be assigned to typical intra-4f transitions of the Eu3+ ion9. Also, no more emission was not observed related to the co-dopant Dy3+ in Y1.40Eu0.10Dy0.01Sc0.50O3
phosphor, indicating that the doped Dy3+ ion do not show any significant emission under those excitations. Decay time curves of all samples recorded at 611 nm and 610 nm emissions, respectively after excitations are shown in Figs 8 and 9. The decay process of all samples is composed of medium decay (Y1.40Eu0.10Dy0.01Sc0.50O3 phosphor) and subsequent of
slow decay (Y1.40Eu0.10Sc0.50 O3 phosphor). The decay
curves of materials are fitted as representatives, which are presented in figures. The decay curves are well fitted with the following double exponential functions:
y=I= A1*exp(-x/t1) + A2*exp(-x/t2) + y0 Fig. 6 — The PL spectra of Y1.40Eu0.10Sc0.50 O3 phosphor
Fig. 7 — The PL spectra of Y1.40Eu0.10Dy0.01Sc0.50O3 phosphor
Fig. 8 — Luminescence decay from the 5D
0 level of Eu3+ in
Y1.40Eu0.10Sc0.50 O3 phosphor by monitoring the 5D0 → 7F2
Table 1 — Results for fitted decay curve of samples
Samples Decay Lifetimes (µs)
τ1 τ2 τaverage
Y1.40Eu0.10Sc0.50 O3 684.275 684.275 684.275
Y1.40Eu0.10Dy0.01Sc0.50O3 529.878 105.181 317.529
where x is the time (t), I0 (y0) and y (I) is the
luminescence intensity at initial time and t, respectively. A1 and A2 are constants. t1 (τ1) and t2 (τ2)
are the decay time for the exponential components, respectively11. Results for fitted decay curve of samples are given in Table 1.
As clearly seen in decay curves and lifetimes’ (µs) τaverage of Y1.40Eu0.10Sc0.50 O3 and Y1.40Eu0.10Dy0.01
Sc0.50O3 phosphors clearly prove that Dy 3+
co-doped phosphor reduced the lifetime by half as well as it is shown in reduced PL intensities. This result is related with the luminescence intensity of the 5D0→
7
F2
(~611 nm, hypersensitive to the environment) transition which is decreased significantly with co-dopant (Dy3+) concentration in this host.
Conclusions
The phosphors in this research were prepared by solid-state reaction method under open atmosphere by obtaining Y1.40Sc0.50O3 host lattice. By 0.5 moles of
Sc3+-ions were added to the system substitution of Y3+-ions, Y1.40Sc0.50O3 host lattice was achieved. XRD
measurements verified the samples as Y2O3, the single
phase, cubic structure with high crystallinity. SEM observations indicated the particle size distributions are between 0.17–0.39 µm for samples and the EDX spectra confirmed the presence of doping of Eu and Dy in the phosphors. The PL analysis exhibited that the Eu3+-activated phosphors based on same
activator/co-activator couples exhibit excitations and red emissions due to Eu3+-ions because of its f-f transitions. The point is Dy3+-co-doped phoshor has the reduced excitation/emission intensities as well as decay lifetimes. Thus, Dy3+may cause the quenching effect for the photoluminescence intensity and lifetime of Y2O3:Eu
3+
phosphors.
Acknowledgement
The authors would like to thank Karamanoglu Mehmetbey University, Scientific Research Projects Commission (BAP, project number: 11-M-17), Republic of Turkey for financial support. The authors are grateful to Prof. Dr. Adil Denizli from Hacettepe University, Department of Chemistry and Biochromatography and Biodiagnostics Research Group for their kind helps.
References
1 Öztürk E & Karacaoglu E, Bull Mater Sci, 40 (2017) 25. 2 Uzun E, Öztürk E, Kalaycioglu Ozpozan N & Karacaoglu E,
J Lumin, 173 (2016) 73.
3 Liu Y Y & Smith D L, J Nucl Mater, 141–143 (1986) 38. 4 Liu W, Wang Y, Zhang M & Zheng Y, Mater Lett, 96 (2013)
42.
5 Gupta A, Brahme N & Bisen D P, J Lumin, 155 (2014) 112. 6 Muresana L, Popovici E J, Imre-Lucacia F, Grecu R &
Indrea E, J Alloys Comp, 483 (2009) 346. 7 Yu H & Yu J, J Lumin, 137 (2013) 274.
8 Roh K, Yang S, Hong B & Roh Y, J Korean Phys Soc, 40 (2002) 103.
9 Li R, Zi W, Li L, Liu L, Zhang J, Zou L & Gan S, J Alloys
Comp, 617 (2014) 498.
10 Li Y-C, Chang Y-H, Lin Y-F, Chang Y-S & Lin Y-J,
J Alloys Comp, 439 (2007) 367.
11 Tsai Y-C, Lin J-W, Huang Y-P & Huang Y-C, Sci World J, 2014 (2014) 1.